#CryptoMarketAnalysis
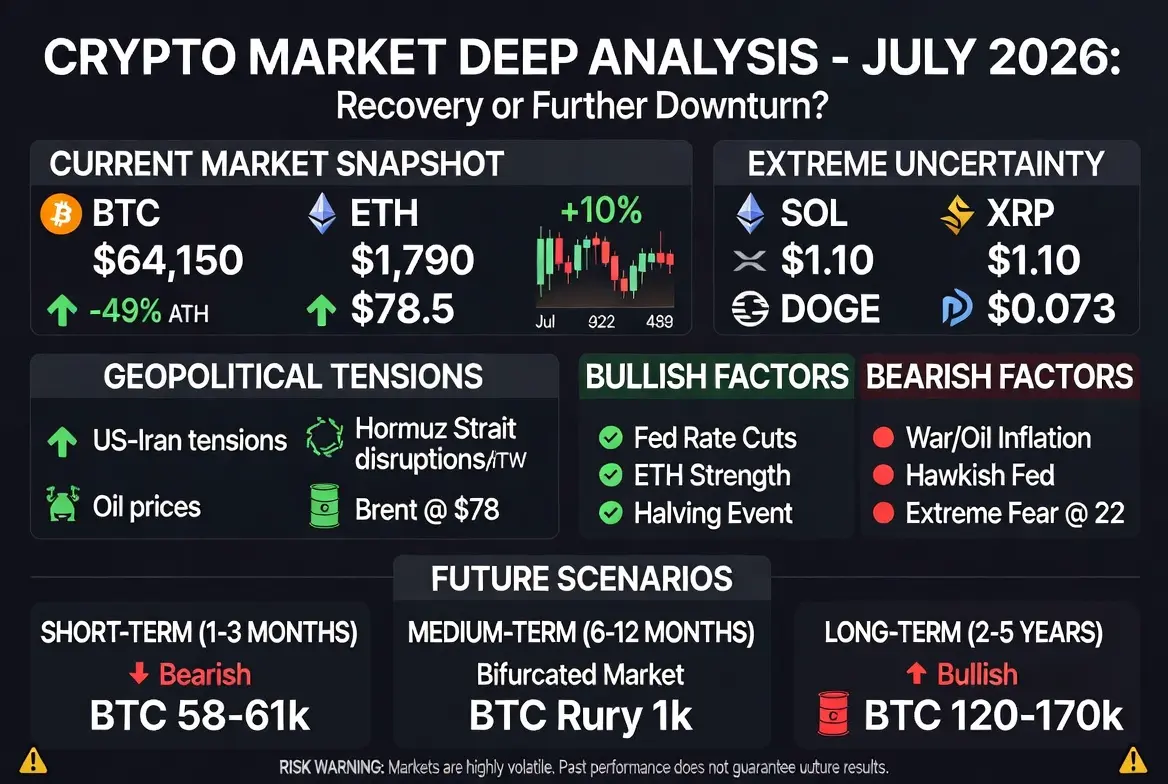
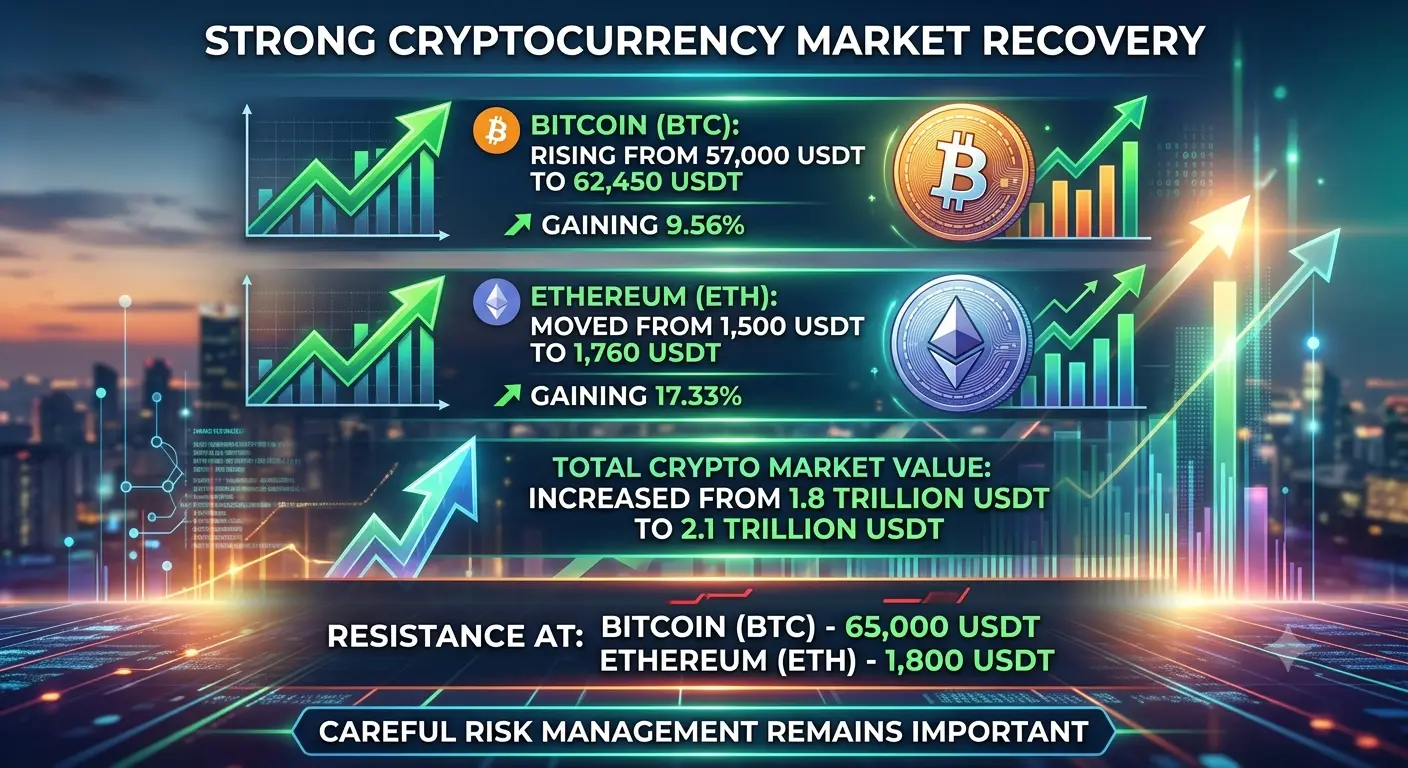
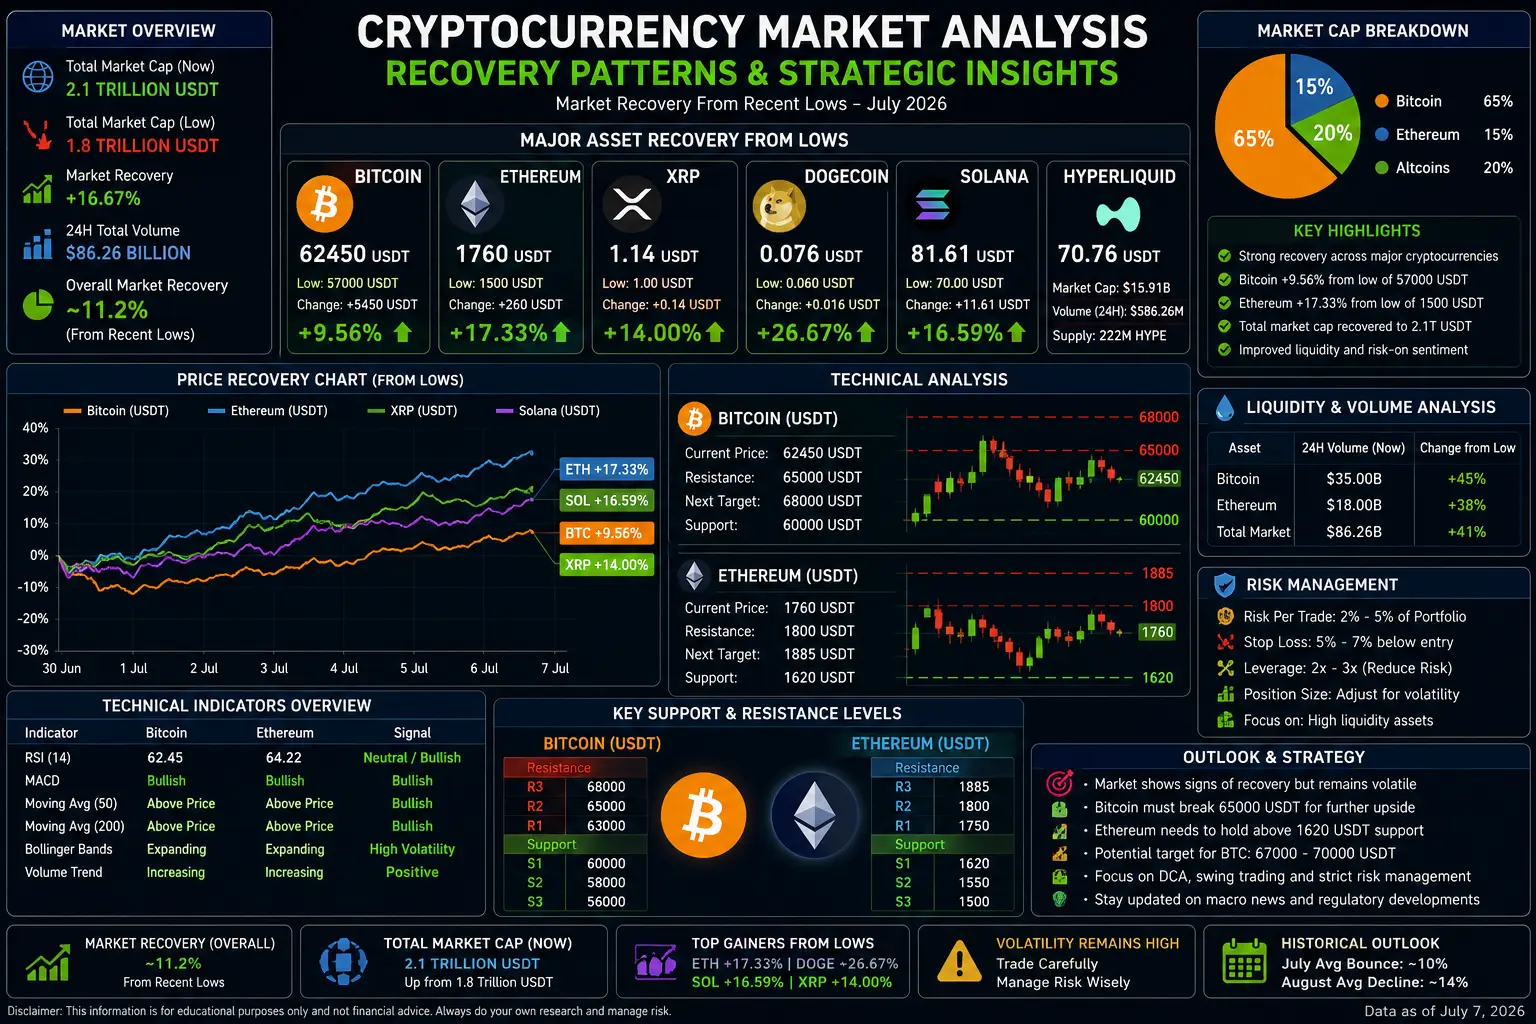
Bitcoin BTC 64,150 USD down 49 percent from ATH 126,000. July rally 10 percent from 58,250 to 64,000 but geopolitical tensions slowing momentum.
Ethereum ETH 1,790 USD showing better relative strength versus BTC in bullish consolidation. OBV stronger on ETH suggesting ETH could lead any broader bounce.
Solana SOL 78.5 USD support at 75 resistance targets 85, 92, 100. Altcoin breadth weak but trading interest active.
Gold XAU 4,117 USD down 26 percent from ATH 5,594 January 2026. HSBC cut forecast to 4,560 from 4,864. Expected range 3,800 to 4,700 rest of year.
XRP 1.10 USD critical 1 USD support. Below that next demand 0.80 to 0.85. SEC remedies active. Multiple ETFs pending as long-term catalysts.
DOGE 0.073 USD weak in meme category with declining volume and no strong catalyst.
US-IRAN GEOPOLITICAL TENSIONS - CRITICAL UPDATES
US military struck 85 targets in Iran after IRGC attacked commercial ships in Strait of Hormuz. Trump declared ceasefire over at NATO summit Turkey and signaled further strikes likely.
Iran responded with missile launches targeting US bases in Bahrain and Kuwait. IRGC attacked at least three tankers in Hormuz within 48 hours including an LNG carrier at highest explosion risk.
Strait of Hormuz handles 20 million barrels daily at pre-war levels. Current tanker traffic below 50 percent throughput. Iran declared it will enforce sovereignty over the Strait regardless of Oman or Gulf states agreement.
Peace talks status unclear. US officials reaffirm commitment to negotiations but Trump's public stance remains hardline. Military strikes dominate ground reality.
OIL PRICE IMPACT
Brent surged to 78 USD per barrel from 70 pre-ceasefire. WTI at 73.50. Higher oil feeds inflation giving Fed hawkish pressure which is negative for crypto risk assets. EIA forecast of 74 Brent average challenged by renewed hostilities. OPEC+ adding 188,000 bpd August insufficient if Hormuz remains disrupted. Full-scale war could push oil to 90 to 110 creating extreme inflation and significant crypto downward pressure.
RECOVERY OR FURTHER DOWN - ANALYSIS
BULLISH FACTORS: Fed rate cut possibility strongest driver after weak 57,000 NFP. New Chair Warsh uncertain but market hopes dovish direction. BTC 10 percent July rally already staged. TBO Cloud targets 64,700, 65,622, 67,292. OBV strong. ETH relative strength improving. Global M2 growth long-term bullish. BTC dominance in consolidation mode.
BEARISH FACTORS: War escalation most critical. Strikes ongoing ceasefire over. Oil surge feeding inflation. CME shows 50 percent probability of September rate hike from 3.75 percent. HSBC cut gold forecast on hawkish Fed. BTC 49 percent below ATH comparable to 2022 bear severity. Options market pricing equal probability of 50,000 downside or 250,000 upside. Altcoin breadth weak. Fear and Greed at 22 Extreme Fear. Asian investors reducing crypto exposure.
LIKELY SCENARIOS
SHORT TERM 2-4 WEEKS: Bearish dominant. BTC tests 58,000 to 61,000 support. ETH must hold 1,650 to 1,720. Gold volatile 4,000 to 4,200 on war headlines.
MEDIUM TERM 1-3 MONTHS: Bifurcated. Ceasefire restored plus rate cuts equals BTC 70,000 to 80,000. War intensifies plus hawkish Fed equals BTC 50,000 to 55,000.
LONG TERM 6-12 MONTHS: Structurally bullish. Halving supply effect cumulative. ETF institutional flows positive. Nations considering strategic BTC reserves. Cycle analysis targets 120,000 to 170,000 by end 2026 or early 2027 if macro improves.
MACRO FACTORS IMPACTING CRYPTO
Fed Policy most powerful driver at 3.75 percent current rate. Cuts bullish increasing liquidity and weakening dollar. Hikes bearish opposite effect. Warsh set hawkish tone at first FOMC. September meeting key decision point.
Dollar strength inversely correlated with crypto. Currently mixed signals between war uncertainty and rate expectations.
CPI directly triggers volatility. Higher readings push rate hike expectations creating sell pressure. War-driven oil increase feeds inflation.
M2 money supply growth positively correlated with crypto market cap. US M2 growth rate affected by war and Fed policy.
ETF flows mixed recently. Strategy sold 216 million BTC negative signal but broader trend constructive long-term.
Stock-correlation elevated. S&P facing resistance. NVDA chopping. TSLA volatile. VIX calm but war escalation could spike it hitting crypto and stocks.
New global tariffs planned for second half 2026 increasing import prices adding inflation pressure as additional hawkish factor.
NFP only 57,000 jobs extremely weak. Participation rate 61.5 percent lowest since March 2021. Disinflation trend intact but war uncertainty could disrupt.
Central banks buying 600 tonnes gold annually. Each 20-30 tonnes above trend adds roughly 1 percent to gold price.
PRICE BREAKDOWN
BTC 64,150 down 49 percent from ATH. 7-day minus 2 percent. July gain 10 percent. Volume moderate. Support 61,000 then 58,000. Resistance 64,700, 65,622, 67,292. Liquidations clustered 62-63K below and 65-67K above. Funding near neutral.
ETH 1,790 down 55 percent from cycle high. Support 1,720 then 1,650. Resistance 1,850, 1,920, 2,000. OBV stronger than BTC indicating accumulation.
SOL 78.5 support 75 then 71. Resistance 85, 92, 100. Volume moderate. Underperforming BTC. Liquidity thinner.
Gold 4,117 down 26 percent from ATH. Volume elevated on war. Support 4,000 then 3,800. Resistance 4,200, 4,300, 4,500. HSBC year-end target 4,750. COMEX drain ongoing physical tight.
XRP 1.10 support 1.00 critical then 0.80-0.85. Resistance 1.20, 1.35, 1.50. Fear 22 Extreme Fear. 50-day MA above price falling as resistance. SEC remedies active. ETFs pending. Bittrex 30 percent flow share unusual.
DOGE 0.073 declining volume. Support 0.065 then 0.060. Resistance 0.08, 0.085, 0.095. High BTC correlation with higher beta both directions.
Oil Brent 78 up 5-10 percent. Support 70 pre-war. Resistance 85, 90, 110 extreme. OPEC+ 188K bpd increase insufficient if Hormuz disrupted.
CONCLUSION
Short-term bearish dominant from war escalation, oil surge, inflation pressure, and hawkish Fed. Recovery possible but conditions unfavorable now.
Bullish triggers needed: ceasefire restored, Hormuz normal shipping, clear rate cut signal, supportive data, sustained ETF inflows.
Bearish triggers: war intensifies full-scale, Hormuz closure extended, September rate hike, oil 90-110, global risk-off mode.
Long-term structurally bullish provided macro improves. Accumulation zone possible for long-term holders with strict risk management and small position sizing. Gold serving safe-haven hedge function.
Overall: short-term bearish, medium-term bifurcated on war and Fed, long-term structurally bullish. Extreme uncertainty phase requiring patience and discipline.
@Gate_Square
Bitcoin BTC 64,150 USD down 49 percent from ATH 126,000. July rally 10 percent from 58,250 to 64,000 but geopolitical tensions slowing momentum.
Ethereum ETH 1,790 USD showing better relative strength versus BTC in bullish consolidation. OBV stronger on ETH suggesting ETH could lead any broader bounce.
Solana SOL 78.5 USD support at 75 resistance targets 85, 92, 100. Altcoin breadth weak but trading interest active.
Gold XAU 4,117 USD down 26 percent from ATH 5,594 January 2026. HSBC cut forecast to 4,560 from 4,864. Expected range 3,800 to 4,700 rest of year.
XRP 1.10 USD critical 1 USD support. Below that next demand 0.80 to 0.85. SEC remedies active. Multiple ETFs pending as long-term catalysts.
DOGE 0.073 USD weak in meme category with declining volume and no strong catalyst.
US-IRAN GEOPOLITICAL TENSIONS - CRITICAL UPDATES
US military struck 85 targets in Iran after IRGC attacked commercial ships in Strait of Hormuz. Trump declared ceasefire over at NATO summit Turkey and signaled further strikes likely.
Iran responded with missile launches targeting US bases in Bahrain and Kuwait. IRGC attacked at least three tankers in Hormuz within 48 hours including an LNG carrier at highest explosion risk.
Strait of Hormuz handles 20 million barrels daily at pre-war levels. Current tanker traffic below 50 percent throughput. Iran declared it will enforce sovereignty over the Strait regardless of Oman or Gulf states agreement.
Peace talks status unclear. US officials reaffirm commitment to negotiations but Trump's public stance remains hardline. Military strikes dominate ground reality.
OIL PRICE IMPACT
Brent surged to 78 USD per barrel from 70 pre-ceasefire. WTI at 73.50. Higher oil feeds inflation giving Fed hawkish pressure which is negative for crypto risk assets. EIA forecast of 74 Brent average challenged by renewed hostilities. OPEC+ adding 188,000 bpd August insufficient if Hormuz remains disrupted. Full-scale war could push oil to 90 to 110 creating extreme inflation and significant crypto downward pressure.
RECOVERY OR FURTHER DOWN - ANALYSIS
BULLISH FACTORS: Fed rate cut possibility strongest driver after weak 57,000 NFP. New Chair Warsh uncertain but market hopes dovish direction. BTC 10 percent July rally already staged. TBO Cloud targets 64,700, 65,622, 67,292. OBV strong. ETH relative strength improving. Global M2 growth long-term bullish. BTC dominance in consolidation mode.
BEARISH FACTORS: War escalation most critical. Strikes ongoing ceasefire over. Oil surge feeding inflation. CME shows 50 percent probability of September rate hike from 3.75 percent. HSBC cut gold forecast on hawkish Fed. BTC 49 percent below ATH comparable to 2022 bear severity. Options market pricing equal probability of 50,000 downside or 250,000 upside. Altcoin breadth weak. Fear and Greed at 22 Extreme Fear. Asian investors reducing crypto exposure.
LIKELY SCENARIOS
SHORT TERM 2-4 WEEKS: Bearish dominant. BTC tests 58,000 to 61,000 support. ETH must hold 1,650 to 1,720. Gold volatile 4,000 to 4,200 on war headlines.
MEDIUM TERM 1-3 MONTHS: Bifurcated. Ceasefire restored plus rate cuts equals BTC 70,000 to 80,000. War intensifies plus hawkish Fed equals BTC 50,000 to 55,000.
LONG TERM 6-12 MONTHS: Structurally bullish. Halving supply effect cumulative. ETF institutional flows positive. Nations considering strategic BTC reserves. Cycle analysis targets 120,000 to 170,000 by end 2026 or early 2027 if macro improves.
MACRO FACTORS IMPACTING CRYPTO
Fed Policy most powerful driver at 3.75 percent current rate. Cuts bullish increasing liquidity and weakening dollar. Hikes bearish opposite effect. Warsh set hawkish tone at first FOMC. September meeting key decision point.
Dollar strength inversely correlated with crypto. Currently mixed signals between war uncertainty and rate expectations.
CPI directly triggers volatility. Higher readings push rate hike expectations creating sell pressure. War-driven oil increase feeds inflation.
M2 money supply growth positively correlated with crypto market cap. US M2 growth rate affected by war and Fed policy.
ETF flows mixed recently. Strategy sold 216 million BTC negative signal but broader trend constructive long-term.
Stock-correlation elevated. S&P facing resistance. NVDA chopping. TSLA volatile. VIX calm but war escalation could spike it hitting crypto and stocks.
New global tariffs planned for second half 2026 increasing import prices adding inflation pressure as additional hawkish factor.
NFP only 57,000 jobs extremely weak. Participation rate 61.5 percent lowest since March 2021. Disinflation trend intact but war uncertainty could disrupt.
Central banks buying 600 tonnes gold annually. Each 20-30 tonnes above trend adds roughly 1 percent to gold price.
PRICE BREAKDOWN
BTC 64,150 down 49 percent from ATH. 7-day minus 2 percent. July gain 10 percent. Volume moderate. Support 61,000 then 58,000. Resistance 64,700, 65,622, 67,292. Liquidations clustered 62-63K below and 65-67K above. Funding near neutral.
ETH 1,790 down 55 percent from cycle high. Support 1,720 then 1,650. Resistance 1,850, 1,920, 2,000. OBV stronger than BTC indicating accumulation.
SOL 78.5 support 75 then 71. Resistance 85, 92, 100. Volume moderate. Underperforming BTC. Liquidity thinner.
Gold 4,117 down 26 percent from ATH. Volume elevated on war. Support 4,000 then 3,800. Resistance 4,200, 4,300, 4,500. HSBC year-end target 4,750. COMEX drain ongoing physical tight.
XRP 1.10 support 1.00 critical then 0.80-0.85. Resistance 1.20, 1.35, 1.50. Fear 22 Extreme Fear. 50-day MA above price falling as resistance. SEC remedies active. ETFs pending. Bittrex 30 percent flow share unusual.
DOGE 0.073 declining volume. Support 0.065 then 0.060. Resistance 0.08, 0.085, 0.095. High BTC correlation with higher beta both directions.
Oil Brent 78 up 5-10 percent. Support 70 pre-war. Resistance 85, 90, 110 extreme. OPEC+ 188K bpd increase insufficient if Hormuz disrupted.
CONCLUSION
Short-term bearish dominant from war escalation, oil surge, inflation pressure, and hawkish Fed. Recovery possible but conditions unfavorable now.
Bullish triggers needed: ceasefire restored, Hormuz normal shipping, clear rate cut signal, supportive data, sustained ETF inflows.
Bearish triggers: war intensifies full-scale, Hormuz closure extended, September rate hike, oil 90-110, global risk-off mode.
Long-term structurally bullish provided macro improves. Accumulation zone possible for long-term holders with strict risk management and small position sizing. Gold serving safe-haven hedge function.
Overall: short-term bearish, medium-term bifurcated on war and Fed, long-term structurally bullish. Extreme uncertainty phase requiring patience and discipline.
@Gate_Square