Square
Following
Hot
News
Profile

CryptoSelf

vip
Market Analyst
On-chain Analyst
Active for: 4.9y
No content yet
51
Following
9.6k
Followers
244.6k
Liked
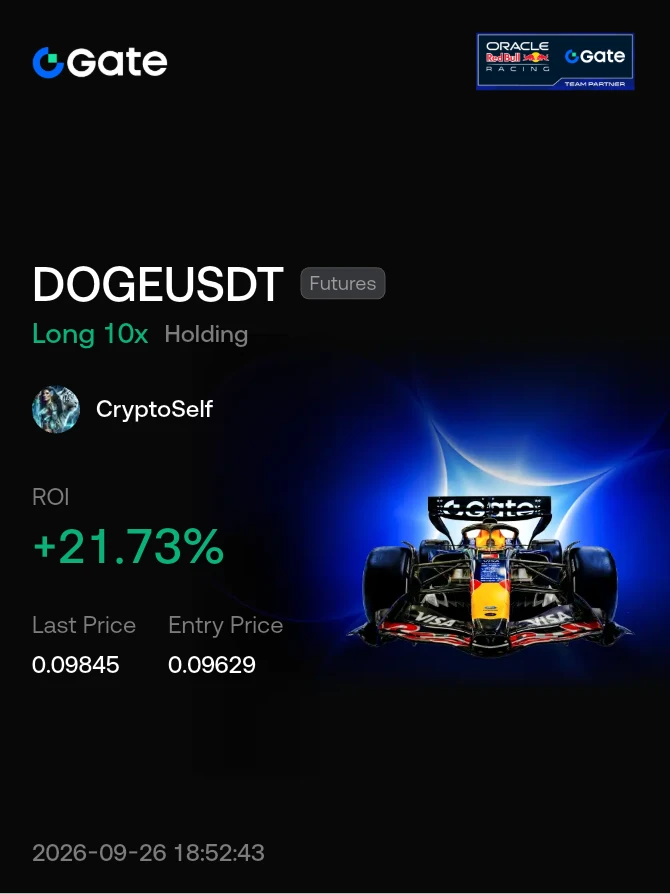
#Share My Holding Returns#
post-image
  • 4
BTC ETH and Altcoins
live-replay-cover
871 views09-24 19:38
02:24:26
#Gate广场中秋团圆局 $90K Is Only $4,500 Away But the Event Market Is Still Cautious
Bitcoin is back in the mid-$85,000s, and the distance to $90K has suddenly become small enough to make the question unavoidable: can BTC clear $90,000 before September ends?
Gate event-market pricing on September 23 puts the probability of BTC moving above $90,000 at 31% by the end of the month.
The market prices a 14% probability above $92,500, 7% above $95,000, and only 2% above $100,000.
But there is another side of the board that may be even more revealing.
The event market assigns a 94% probability to BTC falling
Falcon_Official
#Gate广场中秋团圆局 $90K Is Only $4,500 Away But the Event Market Is Still Cautious
Bitcoin is back in the mid-$85,000s, and the distance to $90K has suddenly become small enough to make the question unavoidable: can BTC clear $90,000 before September ends?
Gate event-market pricing on September 23 puts the probability of BTC moving above $90,000 at 31% by the end of the month.
The market prices a 14% probability above $92,500, 7% above $95,000, and only 2% above $100,000.
But there is another side of the board that may be even more revealing.
The event market assigns a 94% probability to BTC falling below $85,000, with probabilities of 49% below $82,500, 20% below $80,000, 10% below $77,500 and 5% below $75,000.
With BTC around $85,500, the market is essentially saying: upside toward $90K is possible, but holding the current breakout zone is still the immediate battle.
The $90K Question Is Really a $85K Question First
At first glance, a 31% probability of $90K may look relatively low.
But BTC does not need to jump directly from $85,500 to $90,000.
The more important sequence is:
$85K holds → $87.5K breaks → momentum expands → $90K becomes reachable.
If BTC repeatedly loses $85K, the $90K event becomes much harder to price.
That is why the event-market probabilities and technical structure are telling a similar story: the next move is highly dependent on whether BTC can establish acceptance above the current breakout area.
The Market Has Not Chosen a Direction Yet
This is not a clean bullish or bearish setup.
BTC has already recovered sharply from its September low near $74,913, but the event market continues to price meaningful downside risk.
That creates a classic tension between momentum and mean reversion.
Momentum says the market has recovered and broken through previous resistance.
Mean reversion says the move has happened quickly enough that a return toward lower levels remains possible.
The result is a market where traders are watching confirmation rather than simply chasing the headline.
Macro Is Still Sitting in the Background
The Federal Reserve remains one of the biggest variables for risk assets.
The September FOMC projections show a wide distribution of policymakers' year-end rate expectations rather than a single uniform path, meaning the interest-rate outlook remains an important source of uncertainty for markets.
Higher rates and elevated real yields can increase the opportunity cost of holding non-yielding assets such as Bitcoin.
But the relationship is not one-directional.
Bitcoin has continued to recover despite the restrictive-rate backdrop, which means crypto-specific demand, liquidity and positioning are currently competing with the macro headwind.
The Supply Side Is Tighter Than the Price Chart Suggests
On-chain structure adds another layer.
Long-term holders control roughly 14.8 million BTC, around 75% of circulating supply under the figures in the original dataset.
Exchange-held BTC has also declined substantially from more than 3.2 million BTC in 2023 to below 2.7 million.
Less immediately tradable supply can increase price sensitivity because a smaller liquid float means comparatively modest changes in demand can have a larger impact on price.
But that does not eliminate downside risk.
It changes the way the market reacts when demand suddenly increases or decreases.
The $75K Test Showed the Other Side of the Equation
When BTC tested approximately $75,000, short-term holders transferred more than 65,000 BTC to exchanges within 24 hours, with around 61,000 BTC reportedly coming from profitable positions.
That is an important reminder.
Long-term accumulation can reduce available supply, but short-term holders can still create substantial selling pressure when price reaches areas where profits are available.
So the current $85,500 region sits between two forces:
tight long-term supply vs. short-term profit-taking.
Institutional Capital Is Not Moving in One Direction
ETF flows add another layer of uncertainty.
Early September saw consecutive outflows, while September 22 produced a major inflow, showing that institutional positioning has not been a simple one-way accumulation story.
A JPMorgan report cited approximately $1.126 billion in net outflows from U.S. spot Bitcoin ETPs during one early-September week, with selling described as concentrated rather than broad-based.
That distinction matters.
If institutional selling is concentrated among a limited number of funds, it does not necessarily mean the entire institutional investor base has turned bearish.
The next question is whether the recent inflow impulse can persist.
Leverage Could Make the Next Move Bigger
Derivatives are adding another source of volatility.
BTC futures open interest has moved back above approximately $61 billion, while funding around 0.01% remains relatively neutral.
That combination is interesting because leverage is expanding without funding showing the same degree of one-sided bullish positioning.
At the same time, sentiment has moved into extreme greed.
Glassnode's market observations also point toward rebuilding long exposure in options, a rising put/call ratio and perpetual funding below neutral.
That creates an unusual mix:
high sentiment + growing open interest + relatively neutral funding.
It does not predict direction, but it can amplify whichever direction the market eventually chooses.
The Technical Map Is Becoming Very Clear
BTC's September recovery started from roughly $74,913.
The market then faced repeated rejection around $81,914–$82,833 before eventually moving above $85K.
That makes the previous resistance area important.
The current structure can be simplified into a few key zones:
$87,500 — next major upside reference.
$85,000–$85,500 — current breakout/confirmation area.
$84,000–$85,000 — first support band.
$80,000–$84,000 — broader former resistance zone.
The longer BTC holds above $85K, the more convincing the breakout structure becomes.
A move back below $84K would weaken that structure and bring the $80K–$84K zone back into focus.
The 94% Event-Market Probability Is a Warning, Not a Prediction
This is one of the most interesting contradictions in the current setup.
The market gives BTC a 31% probability of exceeding $90K, while simultaneously assigning 94% probability to trading below $85K.
These numbers should not be interpreted as a guaranteed future path.
They show how traders are pricing the possibility of volatility around the current level.
In other words, the market is not saying $90K cannot happen.
It is saying $85K may not be stable enough yet to make the upside path straightforward.
Regulation Has Changed the Background
The September 15 failure of the CLARITY Act's procedural vote initially added regulatory uncertainty to the market.
But the regulatory response did not stop there.
On September 17, the SEC issued its Innovation Exemption, providing temporary, conditional relief for certain venues seeking to trade tokenized NMS stocks through permissioned automated market makers and liquidity pools.
The same day, the CFTC issued a no-action position for providers of passive software, subject to specified conditions, relating to registration requirements when their software facilitates trading through registered intermediaries.
That creates an important shift in the regulatory story.
Congress may still be working through comprehensive legislation, but federal agencies are simultaneously using existing authority to create more defined operating frameworks.
So Can BTC Break $90K Before September Ends?
The data does not give a simple yes-or-no answer.
What it does show is a market approaching an important decision zone.
BTC has recovered from approximately $74.9K to the mid-$85Ks.
The $82K area has been reclaimed.
Altcoin participation is improving.
Institutional flows are mixed rather than uniformly negative.
Long-term supply remains relatively tight.
Open interest is elevated.
Funding is comparatively neutral.
Sentiment is extremely optimistic.
And the event market still sees substantial probability of a move back below $85K.
That makes $85K the immediate battleground and $87.5K the next upside checkpoint, while $90K remains the larger September objective.
For Gate Square traders, the most useful framework is therefore not simply chasing the $90K headline. Watch whether BTC can hold $85K, establish strength above $87.5K and maintain momentum without a sharp deterioration in leverage and spot flows.
The distance to $90K is now small.
The real question is whether the market can build enough structure underneath BTC to make that final move sustainable.
@Gate_Square

repost-content-media
  • 6
#每周来晒
‍#Gate广场中秋团圆局
‍#GT突破11美元近30日涨40%
$GT Holds above $11! After a parabolic run, the upside and risks must be clearly weighed
If you switch the candlestick chart to the daily timeframe, you will see that since the GT rally began on August 17, it has moved almost continuously northward without any obvious pullback. It only followed the broader market in a pullback today. Many of you have already started imagining how high it can fly and where the next target might be.
First, the big picture: I am not turning bearish or expecting a bear market; the bullish structure on the larger timefram
LittleGodOfWealthPlutus
#每周来晒
‍#Gate广场中秋团圆局
‍#GT突破11美元近30日涨40%
$GT Holds above $11! After a parabolic run, the upside and risks must be clearly weighed
If you switch the candlestick chart to the daily timeframe, you will see that since the GT rally began on August 17, it has moved almost continuously northward without any obvious pullback. It only followed the broader market in a pullback today. Many of you have already started imagining how high it can fly and where the next target might be.
First, the big picture: I am not turning bearish or expecting a bear market; the bullish structure on the larger timeframe remains completely intact. Continued platform buybacks and burns creating deflation, GateLayer ecosystem support, and the overall bull-market beta are all still in place, so the underlying logic remains intact and a further push higher is objectively possible. However, after rising continuously for more than two months, the move has been too smooth, and profit-taking positions have piled up. A washout pullback will inevitably follow the euphoria, so do not blindly chase the highs.
I. Price action and positioning: The rally looks strong, but short-term selling pressure has already built up
This wave of GT strength is partly driven by its own narrative and partly by benefiting from the entire crypto market. BTC strength has lifted risk appetite across the market, and platform tokens have risen along with it.
After breaking above $11, the short-term trend has already entered a resistance zone. The first major resistance above is $12.412.5, a previous area of concentrated trading and trapped positions, as well as the first strong resistance level of this rally. If market sentiment remains hot and price holds above this level with strong volume, it could open up upside potential toward around $14. But stay clear-headed: A large amount of low-entry positions have already accumulated substantial profits. As soon as the pace of the rise slows, profit-taking selling pressure will immediately rush in.
Do not treat the rise as a given. GT itself is highly tied to the broader market. If BTC undergoes a short-term correction, GT's pullback is often larger than BTC's, making it a highly elastic asset.
If the short-term move loses momentum, the first support to watch is the $9.810 range. This is a zone of concentrated positioning and a previous breakout platform. It is also a key launch point for this rally.
1. If the pullback holds the $9.810 support, then after the washout is complete and the indicators have recovered, GT may have a chance to launch another attack toward $12.5 and even higher;
2. If the range breaks down on strong volume, this phase of the rally will come to an end, and the correction will likely deepen further.
II. Technical indicators: The larger bullish trend is intact, but shorter timeframes have begun to enter overbought territory
Moving average system
On the daily timeframe, price is firmly above the 10-, 20-, and 50-day moving averages, with the medium- and long-term moving averages in a bullish alignment. There is no need to question the broader trend. However, price has now clearly pulled away from the 20-day moving average, with the deviation widening and the distance between price and the moving averages becoming excessive. Crypto markets rarely run far from the moving averages indefinitely; after rising too much, price will eventually pull back toward the moving averages to digest excess positions.
This is even more obvious on the 4-hour timeframe. Short-term moving averages are fanning upward, but price has already moved far away from MA20 and MA30. The market looks very strong, but momentum is actually weakening at the margin. Even if the broader outlook remains bullish, a pullback to repair the trend is needed to facilitate sufficient position rotation and build strength for the next rally.
Oscillation & momentum indicators
On the 4-hour and hourly charts, RSI has touched the overbought zone above 70 multiple times. Overbought does not mean an immediate crash, but it does indicate that short-term bullish momentum has been heavily depleted, and continued aggressive upside requires a steady stream of new buyers to take over.
The Bollinger Bands show price hugging the upper band and deviating from its normal volatility range, creating a need for a reversion toward the middle band. MACD remains in a bullish configuration above the zero line, but the red histogram bars have begun to contract: Price is making new highs, but upside momentum is failing to keep up, and the risk of high-level flattening is accumulating.
III. Fundamentals: The bullish logic is strong, but real-world constraints cannot be ignored
The bullish case for GT is actually quite clear:
1. Continued buybacks and burns permanently destroy a large amount of tokens, with deflation creating scarcity. This is the core underlying narrative for a platform token;
2. Progress in the GateLayer Layer 2 ecosystem expands GT's use cases as a Gas token, creating a new source of demand for the token;
3. Growth in exchange trading volume and user numbers provides a revenue base for buybacks;
4. The broader bull-market environment supports capital flowing into the platform-token sector.
But the other side of the coin must also be recognized: Most of these positive factors have already been priced in to a significant extent by the nearly 90-day rally. Burns are a slow, long-term narrative and will not stimulate the market every day; the results of the Layer 2 ecosystem will depend on actual on-chain data and are a long-term payoff, while in the short term they are driven more by narrative.
GT is still fundamentally a platform token with strong broader-market beta characteristics, making it difficult to produce a trend completely independent of BTC. Once the broader market turns into a correction, even the strongest fundamentals cannot withstand a decline in overall market risk appetite.
IV. What comes next?
Medium to long term: The bullish structure remains intact. If the exchange business and Layer 2 ecosystem continue to deliver, alongside a sustained bull-market environment, GT still has upside potential.
Short term: After a series of sharp gains, GT has reached a resistance zone and is not suitable for blindly chasing the rally.
First target resistance: $12.412.5. Only a high-volume breakout and hold would create an opportunity to challenge around $14;
First key support: $9.810. Holding this level keeps the trend intact; a decisive break below it would mark the beginning of a broader phase of correction.
Overall, the $11 level represents a phase in which the bullish factors have been fully played out and short-term sentiment is overheated. Do not let consecutive gains cloud your judgment, and do not chase high-priced premiums. It is better to wait for a pullback to support and assess the buying response than to rush aggressively into the highs. During the euphoria, always stay clear-headed about the potential risk of a washout. $GT
repost-content-media
GT+2.80%
BTC+0.44%
  • 3
#GlassnodeSignalFlipsToAltcoinSeason
🌊 Glassnode Just Flipped Toward Altseason — and This Time the Data Is Different
$1.19 trillion. That's the altcoin market cap right now, and Glassnode's indicators just turned toward altseason. Every cycle someone asks if it's finally altcoins' turn. But this time, the signal isn't coming from price alone — and that changes everything.
📊 Key Signal: Glassnode's flip is based on network activity, volume, and market depth — not just a pump.
The Story: The Early Signs of a Long-Awaited Season
Altseason historically begins when Bitcoin consolidates its stren
xxx40xxx
#GlassnodeSignalFlipsToAltcoinSeason
🌊 Glassnode Just Flipped Toward Altseason — and This Time the Data Is Different
$1.19 trillion. That's the altcoin market cap right now, and Glassnode's indicators just turned toward altseason. Every cycle someone asks if it's finally altcoins' turn. But this time, the signal isn't coming from price alone — and that changes everything.
📊 Key Signal: Glassnode's flip is based on network activity, volume, and market depth — not just a pump.
The Story: The Early Signs of a Long-Awaited Season
Altseason historically begins when Bitcoin consolidates its strength and capital rotates into smaller, higher-risk assets. Glassnode's data is catching the early signals of exactly that rotation. A $1.19 trillion market cap proves altcoins are no longer marginal players — they're the main event.
The Analysis: Why This Time Could Be Different
1. Indicator Support, Not Just Price Action
Glassnode measures more than price — it tracks on-chain activity, volume, and depth. When these align, you're looking at a foundation, not a spike.
2. Projects Have Grown Up
Past cycles were full of promises. Today there are real products in DeFi, layer-2, AI, and real-world assets. That sets the stage for a selective but powerful rally.
3. Investors Got Smarter
The "everything pumps" mentality is giving way to "the strong pump." That rewards quality — and creates a healthier, more durable market.
What's Next?**
Altseason's durability depends on Bitcoin's direction and overall risk appetite. But here's the rule that never changes: selectivity wins. Chasing every riser loses; picking strong fundamentals wins.
Your Turn: Pick a Side
Is this finally altcoins' real season — or another false start? Which altcoins are you holding through the rotation, and what's your altseason strategy? Drop your plan in the comments 👇
This content is for informational purposes only and is not investment advice.
$BTC $GT $ETH $SOL $XRP
#ZECBreaks1650ToNewHigh #SanDiskJumps7.7%ToHighestSinceJuly #GateSquareMidAutumnReunion #GTBreaks11Up40%In30Days
repost-content-media
BTC+0.44%
GT+2.80%
ETH+0.21%
SOL+0.46%
  • 6
#GlassnodeSignalFlipsToAltcoinSeason
$SOL ‌
The crypto market may be entering a different phase.
Glassnode’s Altcoin Cycle Signal has flipped from Bitcoin Season to Altcoin Season, reaching 81.25/100 on the latest seven-day reading. Glassnode says the difference this time is market breadth: the August rally was largely Bitcoin-led, while the latest move has spread across a much wider group of altcoins.
And one of the clearest large-cap examples of that shift is Solana ($SOL).
SOL has moved back toward the $120 area, recording roughly a 16% weekly gain an
Jiaa_Insights
#GlassnodeSignalFlipsToAltcoinSeason
$SOL ‌
The crypto market may be entering a different phase.
Glassnode’s Altcoin Cycle Signal has flipped from Bitcoin Season to Altcoin Season, reaching 81.25/100 on the latest seven-day reading. Glassnode says the difference this time is market breadth: the August rally was largely Bitcoin-led, while the latest move has spread across a much wider group of altcoins.
And one of the clearest large-cap examples of that shift is Solana ($SOL).
SOL has moved back toward the $120 area, recording roughly a 16% weekly gain and reaching around $119–$120, its highest level in about eight months. More importantly, SOL has also been gaining against BTC, with SOL/BTC up approximately 4.6% over seven days. ETH/BTC and XRP/BTC have shown much smaller gains during the same period, making Solana one of the stronger major altcoin-relative-strength stories in the current rotation.
SOL'S SEPTEMBER RECOVERY
The price structure tells an important story.
September 15 close: $97.20
September 16: $98.66
September 17: $101.58
September 18: $112.67
September 19: $111.03
September 20: $111.16
September 21: $118.53
September 22: $118.44
September 23 intraday data: roughly $115.77–$119.20
From the September 15 close near $97.20 to the September 22 close near $118.44, SOL gained approximately 21.9%.
That is a significant recovery in a relatively short period, and it coincides with the broader improvement in altcoin breadth.
WHY SOLANA IS IMPORTANT IN AN ALTSEASON
When an altcoin cycle begins to broaden, traders usually look beyond absolute price gains.
Relative performance becomes important.
Is the asset gaining against BTC?
Is liquidity moving into large-cap altcoins?
Are multiple sectors participating?
Is the move supported by increasing volume?
Solana currently checks several of those boxes.
Glassnode's latest signal shows broader altcoin participation, while SOL/BTC has gained roughly 4.6% in seven days. At the same time, Bitcoin dominance remains elevated around 57.2%, meaning this is not yet a simple story of capital completely leaving Bitcoin. Instead, the current data suggests that altcoins are beginning to capture more of the upside while BTC remains strong.
That distinction matters.
ALTSEASON DOES NOT MEAN “EVERY ALTCOIN GOES UP”
The Glassnode signal is a market-breadth indicator, not a guarantee that every altcoin will outperform.
Glassnode's methodology compares the market-cap growth of the 250 largest altcoins, excluding stablecoins, against Bitcoin. The latest seven-day rolling reading of 81.25 indicates that relative altcoin growth has strengthened significantly.
But Bitcoin dominance is still around 57%, and the one-month decline in BTC dominance has been relatively modest.
So the more accurate way to describe the current environment is:
Altcoin participation is expanding while Bitcoin remains strong.
That can be a very different market structure from an environment where BTC is falling sharply and traders rotate into alts simply because Bitcoin is weak.
SOLANA'S KEY PRICE BATTLE
With SOL now around the $118–$120 area, this becomes an important technical zone.
The first level to watch is:
$120
A sustained break and close above $120 would strengthen the recent recovery structure.
Above $120, the next zones traders may monitor are:
$125
$130
$135–$140
If momentum continues to expand across the altcoin market, higher levels could eventually come into focus, but each resistance area needs confirmation rather than assumption.
The $130 level is particularly interesting because some current technical analyses have identified it as the next major upside area following SOL's move above the $105 breakout zone.
THE SUPPORT MAP
After a rapid recovery, support becomes just as important as resistance.
The first area I would watch is:
$115–$118
If SOL holds this zone, buyers may attempt another test of $120.
Below that:
$110–$112
This area is important because SOL spent several recent sessions around this region before the acceleration.
Next:
$105–$108
This is a much more significant structural zone.
Then:
$100–$102
And the deeper September base:
$96–$98
A move back toward $100 would not automatically destroy the larger recovery, but losing $96–$98 with strong selling pressure would significantly weaken the current short-term structure.
THE BULLISH PATH
A stronger continuation structure would look like:
$115–$118 holds
→ buyers retest $120
→ daily close above $120
→ successful retest
→ $125
→ $130
The key is not simply touching $120.
The market needs to prove that $120 can become support after being resistance.
If that happens while SOL/BTC continues strengthening, the altseason narrative would have stronger confirmation from relative performance as well as absolute price.
THE PULLBACK PATH
The alternative is rejection around $120.
If SOL fails to break the level and falls below $115, the first reaction zone would be $110–$112.
A deeper correction could bring $105–$108 into focus.
If the market loses $100 and then $96–$98, the recent recovery would be considerably weaker.
This is why chasing a 16% weekly move is not necessarily the same thing as having a good risk/reward setup.
ALTCOIN BREADTH IS THE BIGGER STORY
The most interesting part of the current market is that SOL is not moving in isolation.
Recent market breadth data showed a large majority of the top 100 cryptocurrencies gaining over the latest 24-hour period. The broader non-stablecoin altcoin market share has also increased, while the seven-day altcoin performance has strengthened considerably.
That gives more context to Glassnode's 81.25 signal.
The market is showing signs of rotation.
But rotation needs to persist.
One strong week does not automatically establish a long-lasting altseason.
WHAT I WOULD WATCH NEXT
For SOL, I would focus on four things:
1. $120 breakout
A sustained close above $120 would be stronger than a temporary intraday spike.
2. SOL/BTC strength
If SOL continues outperforming BTC on the relative pair, that would provide additional evidence that capital is rotating toward Solana.
3. $115–$118 support
If this area holds after a rejection, it could become the foundation for another attempt at $120.
4. Overall altcoin breadth
If Glassnode's signal remains elevated while more large-cap and mid-cap altcoins participate, the current rotation would have broader confirmation.
TRADING STRUCTURE
After a move of roughly 16% in one week, I would avoid treating every green candle as an automatic entry.
A cleaner setup would be either:
Breakout confirmation: SOL closes above $120 and successfully retests the level.
Or:
Controlled pullback: SOL returns toward $110–$115 and buyers establish a higher low.
This approach keeps the focus on confirmation rather than FOMO.
The risk level should be defined before entering, and position size should be adjusted according to the distance to invalidation.
THE BIGGER PICTURE
Glassnode's signal flipping to altcoin season is significant because the current rally is showing something that was missing from the earlier August move: broader participation.
Bitcoin can remain strong while capital gradually expands into major altcoins.
Solana is currently one of the clearest examples of that relative-strength shift, with SOL gaining around 4.6% against BTC over seven days and recovering more than 20% from its September 15 close to September 22.
But the market still needs confirmation.
For SOL, the map is straightforward:
Above $120: $125 → $130 → $135–$140
$115–$120: key battle zone
$110–$112: first major support
$105–$108: structural support
$100–$102: psychological support
$96–$98: deeper September support
The most important signal from here is not simply whether SOL can print another green candle.
It is whether Solana can break $120, hold the breakout, continue outperforming BTC, and remain strong while the broader altcoin market keeps participating.
If those conditions continue to align, the current Glassnode signal becomes much more meaningful as a market-structure development rather than just another short-term crypto headline.
SOL+0.46%
BTC+0.44%
ETH+0.21%
XRP-1.71%
  • 4
🔥 Altseason signals are heating up—could Meme be next in line?
The market has started discussing capital rotating from BTC into altcoins, and Meme is often one of the sectors that attracts the most attention when risk appetite recovers 👀
Do you favor Meme taking the baton this round, or do you think we still need to wait?
Bring #GateMeme狂欢季 to Gate Square to share your Meme views and trading ideas 👇
🎯 The more you post, the more chances you have to win, with up to 10 USDT per draw
📈 Your first valid trade-showcase post each week guarantees a 50 USDT futures position experience voucher
🍀
GateSquare
🔥 Altseason signals are heating up—could Meme be next in line?
The market has started discussing capital rotating from BTC into altcoins, and Meme is often one of the sectors that attracts the most attention when risk appetite recovers 👀
Do you favor Meme taking the baton this round, or do you think we still need to wait?
Bring #GateMeme狂欢季 to Gate Square to share your Meme views and trading ideas 👇
🎯 The more you post, the more chances you have to win, with up to 10 USDT per draw
📈 Your first valid trade-showcase post each week guarantees a 50 USDT futures position experience voucher
🍀 Complete copy trading to enter a weekly draw for 2 Meme copy-trading lucky winners, each receiving 20 USDT
Whether altseason has arrived is up for discussion, but whether Meme has a chance is even more worth talking about.
👉 Join now: https://www.gate.com/campaigns/6197
#GateMemeCarnivalSeason
repost-content-media
MEME+2.08%
BTC+0.44%
  • 3
🚀 Gate Square is recruiting new creators—keep posting to unlock more rewards!
First-post rewards · Bonus for consecutive posts · Monthly leaderboard rewards—keep creating to share $50,000+ in monthly rewards!
👉 https://www.gate.com/campaigns/5987
🎁 New Creator Benefits
1️⃣ First-Post Reward
Complete your first post with a trading card to win a $10 position experience voucher
2️⃣ Weekly Creation Rewards
3 posts per week → Share $6,000
Post for 5 consecutive days → Extra $3,000
Post for 7 consecutive days → An additional $2,500
3️⃣ Monthly Leaderboard Rewards
Compete for a share of $10,000+,
GateSquare
🚀 Gate Square is recruiting new creators—keep posting to unlock more rewards!
First-post rewards · Bonus for consecutive posts · Monthly leaderboard rewards—keep creating to share $50,000+ in monthly rewards!
👉 https://www.gate.com/campaigns/5987
🎁 New Creator Benefits
1️⃣ First-Post Reward
Complete your first post with a trading card to win a $10 position experience voucher
2️⃣ Weekly Creation Rewards
3 posts per week → Share $6,000
Post for 5 consecutive days → Extra $3,000
Post for 7 consecutive days → An additional $2,500
3️⃣ Monthly Leaderboard Rewards
Compete for a share of $10,000+, plus GT, exclusive merchandise, and high-value vouchers
🔥 The more you post, the more rewards you unlock!
👉 Join Gate Square now: https://www.gate.com/post
repost-content-media
GT+2.80%
  • 3
  • 1
🎁 Prize pool boosted, 100% chance of winning, with the highest prize being a 5,000 USDT position experience voucher!
The Gate Social Growth Value Lottery 2️⃣3️⃣ is in full swing—here’s your participation guide!
📌 How to participate
1️⃣ Enter [Square] → tap [+] to post → [Event Center]
2️⃣ Complete the daily tasks in [Square], [Live], and [Hot Chat] to earn Growth Value
3️⃣ Draw once for every 300 Growth Value, with a maximum of 10 draws per day
🎉 Exclusive Gate computer bags, popular tokens, multiple coupons, and more exciting rewards are waiting for you to unlock!
👉 Participate in today’s
GateSquare
🎁 Prize pool boosted, 100% chance of winning, with the highest prize being a 5,000 USDT position experience voucher!
The Gate Social Growth Value Lottery 2️⃣3️⃣ is in full swing—here’s your participation guide!
📌 How to participate
1️⃣ Enter [Square] → tap [+] to post → [Event Center]
2️⃣ Complete the daily tasks in [Square], [Live], and [Hot Chat] to earn Growth Value
3️⃣ Draw once for every 300 Growth Value, with a maximum of 10 draws per day
🎉 Exclusive Gate computer bags, popular tokens, multiple coupons, and more exciting rewards are waiting for you to unlock!
👉 Participate in today’s lottery now: https://www.gate.com/activities/pointprize?now_period=23
$BTC $ETH $GT
repost-content-media
BTC+0.44%
ETH+0.21%
GT+2.80%
  • 5
🚀 60 million Gate users. That’s a pretty impressive milestone.
I remember when Gate was mainly known as a crypto exchange. Today, it feels like the ecosystem has grown far beyond that — thousands of crypto assets, plus access to stocks and ETFs.
What I enjoy most is being able to explore different markets from one platform. There’s always something new to check out — a new token, a new trading tool, or simply a different market to follow.
60 million users is a huge achievement, but honestly, I’m even more curious about what comes next. 👀
More markets? Better tools? New opportunities?
For me,
Engin1979
🚀 60 million Gate users. That’s a pretty impressive milestone.
I remember when Gate was mainly known as a crypto exchange. Today, it feels like the ecosystem has grown far beyond that — thousands of crypto assets, plus access to stocks and ETFs.
What I enjoy most is being able to explore different markets from one platform. There’s always something new to check out — a new token, a new trading tool, or simply a different market to follow.
60 million users is a huge achievement, but honestly, I’m even more curious about what comes next. 👀
More markets? Better tools? New opportunities?
For me, the journey is still just getting started. 🚀
What’s been your most memorable Gate experience so far?
#Gate全球用户突破6000万 #Gate广场中秋团圆局 #GateGlobalUsers
repost-content-media
TOKEN+1.00%
  • 4
☀️ GM! BTC and ETH have had a strong run — time for a quick breather 😮‍💨
📌 Today’s question: just a pause, or is the market shifting gears?
📈 Keep climbing after the cooldown, or pull back first?
👀 What signal are you watching most right now?
💼 Would you hold, wait to add, or take some profit?
Got a trading idea? Turn it into content.
Share your market view, trading plan, or recap on Gate Square. Add a trading card, and quality content may also help drive trading conversions and referral rewards.
👇 Share your take:
https://www.gate.com/post
Gate_Square
☀️ GM! BTC and ETH have had a strong run — time for a quick breather 😮‍💨
📌 Today’s question: just a pause, or is the market shifting gears?
📈 Keep climbing after the cooldown, or pull back first?
👀 What signal are you watching most right now?
💼 Would you hold, wait to add, or take some profit?
Got a trading idea? Turn it into content.
Share your market view, trading plan, or recap on Gate Square. Add a trading card, and quality content may also help drive trading conversions and referral rewards.
👇 Share your take:
https://www.gate.com/post
repost-content-media
BTC+0.44%
ETH+0.21%
  • 5
💰 Capital is moving. Gate is where part of it is landing.
Gate recorded around $114M in 24H net inflows, ranking No. 2 among global centralized exchanges, according to DefiLlama.
That’s more than a headline number.
It reflects rising activity, growing attention, and fresh capital entering the platform.
What are you watching on Gate right now — BTC, alts, GT, or something else?
Share your latest trade, market view, or next setup on Gate Square with #Gate24HNetInflowNo2
👉 https://www.gate.com/post
Gate_Square
💰 Capital is moving. Gate is where part of it is landing.
Gate recorded around $114M in 24H net inflows, ranking No. 2 among global centralized exchanges, according to DefiLlama.
That’s more than a headline number.
It reflects rising activity, growing attention, and fresh capital entering the platform.
What are you watching on Gate right now — BTC, alts, GT, or something else?
Share your latest trade, market view, or next setup on Gate Square with #Gate24HNetInflowNo2
👉 https://www.gate.com/post
repost-content-media
BTC+0.44%
GT+2.80%
  • 7
  • 2
🔥 Gate Square Daily Standouts | September 23 Picks Are In
Square Scout is on patrol 👀
Trade the momentum or wait for a confirmed pullback? From oil shorts and UNI trades to the AI supply chain—which approach speaks to you?
🛢️ @流云不见光 | Oil Pulls Back—What Are Bears Watching?
https://www.gate.com/post/status/24474759
📊 @北狼居 | ETH Ahead of Options Expiry: Trade or Wait?
https://www.gate.com/post/status/24449248
⚡ @诺贝尔盈利王 | UNI Momentum: A Quick Entry and Exit
https://www.gate.com/
Gate_Square
🔥 Gate Square Daily Standouts | September 23 Picks Are In
Square Scout is on patrol 👀
Trade the momentum or wait for a confirmed pullback? From oil shorts and UNI trades to the AI supply chain—which approach speaks to you?
🛢️ @流云不见光 | Oil Pulls Back—What Are Bears Watching?
https://www.gate.com/post/status/24474759
📊 @北狼居 | ETH Ahead of Options Expiry: Trade or Wait?
https://www.gate.com/post/status/24449248
⚡ @诺贝尔盈利王 | UNI Momentum: A Quick Entry and Exit
https://www.gate.com/post/status/24476958
🤖 @孔大锤 | Beyond NVIDIA: Where Else to Look in AI?
https://www.gate.com/post/status/24474918
🎬 @苏森有很多木头 | What’s Next for Bitcoin? A Video Breakdown
https://www.gate.com/post/status/24474778
🔍 @Cas Abbe | Can ZEC Keep Going After the Breakout?
https://www.gate.com/post/status/24481337
₿ @阿酒 | Bullish on BTC—but When Is the Thesis Wrong?
https://www.gate.com/post/status/24474106
📈 @作手Trader | SNDK Breaks Out—Can It Hold?
https://www.gate.com/zh/post/status/24490043
🎁 Featured creators get a 3-day traffic boost + Featured placement
Read the posts and share your take with the authors 👇
Keep sharing valuable content—your next post could be featured!
#DailyStandouts #GateSquare
repost-content-media
UNI-0.46%
ETH+0.21%
BTC+0.44%
ZEC+1.66%
NVDA+0.23%
  • 4
🔥 Altseason signals are heating up — could Meme be next?
The market is starting to talk about capital rotating from BTC into alts. Meme is often one of the first high-beta sectors to pick up when risk appetite returns 👀
Do you think Meme is ready to catch the next wave, or is it still too early?
Post your Meme take and trading view on Gate Square with #GateMemeCarnival 👇
🎯 More posts = more draw entries, up to 10 USDT per draw
📈 First valid trade post each week guarantees a 50 USDT Futures Position Trial Voucher
🍀 Complete a copy trade for a chance to be 1 of 2 weekly winners, 20 USDT ea
Gate_Square
🔥 Altseason signals are heating up — could Meme be next?
The market is starting to talk about capital rotating from BTC into alts. Meme is often one of the first high-beta sectors to pick up when risk appetite returns 👀
Do you think Meme is ready to catch the next wave, or is it still too early?
Post your Meme take and trading view on Gate Square with #GateMemeCarnival 👇
🎯 More posts = more draw entries, up to 10 USDT per draw
📈 First valid trade post each week guarantees a 50 USDT Futures Position Trial Voucher
🍀 Complete a copy trade for a chance to be 1 of 2 weekly winners, 20 USDT each
Altseason may still be up for debate — but Meme is worth watching.
👉 Join now: https://www.gate.com/campaigns/6197
#GateMemeCarnival
repost-content-media
MEME+2.08%
BTC+0.44%
  • 5
BTC ETH and Altcoins
live-replay-cover
957 views09-22 19:06
01:40:35
#GateSquareMidAutumnReunion
BTC AT $85,908 - Is $100K Next? My Gate Story as Gate Hits 60 MILLION Users!
#Gate全球用户突破6000万 #Gate广场中秋团圆局 #GateGlobalUsers
BREAKING: Gate's global users surpass 60 MILLION! And BTC is pumping at the same time - Coincidence? I don't think so.
From 2013 to 2025, Gate became the ONLY exchange where I can trade 5,200+ cryptos AND 12,800 stocks & ETFs in one account. No other exchange comes close.
MY MEMORABLE STORY WITH GATE:
I started on Gate during the bear market. While other exchanges froze, Gate's liquidity saved my position. That's when I knew - this exchange is
post-image
BTC+0.44%
ETH+0.21%
  • 5
🔥 GT surges to $11.41 as market attention continues to heat up
After just breaking above $11 yesterday, GT climbed further to an intraday high of $11.41 today.
As of the poster’s data timestamp, GT is trading at approximately $10.96, up +4.47% over 24H; its market cap has risen to approximately $1.09 billion, while 24H trading volume has increased by about 10%.
Prices are moving, and trading activity is following suit.
Open Gate to check GT’s real-time market data. After trading, you’re also welcome to share your trades, holdings, and next-step outlook on Gate Square.
Post with #GT突破11美元 to
GateSquare
🔥 GT surges to $11.41 as market attention continues to heat up
After just breaking above $11 yesterday, GT climbed further to an intraday high of $11.41 today.
As of the poster’s data timestamp, GT is trading at approximately $10.96, up +4.47% over 24H; its market cap has risen to approximately $1.09 billion, while 24H trading volume has increased by about 10%.
Prices are moving, and trading activity is following suit.
Open Gate to check GT’s real-time market data. After trading, you’re also welcome to share your trades, holdings, and next-step outlook on Gate Square.
Post with #GT突破11美元 to get more people to see your views.
✨ High-quality content may receive 3 days of Gate Square traffic support
👉 https://www.gate.com/post
repost-content-media
GT+2.80%
  • 6