#SPCX
Company Overview and Business Profile
SpaceX trades on NASDAQ under the ticker SPCX after completing the largest IPO in market history on June 12, 2026, raising $75 billion at $135 per share, valuing the company at approximately $1.75 trillion. Led by Elon Musk, SpaceX operates three core businesses: Starlink (Connectivity), Launch Services, and Starship Exploration.
The S-1 filing also included xAI and X (formerly Twitter) as common-control transactions, boosting reported revenue compared with standalone SpaceX operations. Total 2025 revenue reached $18.67 billion, up 33% from 2024, but the company reported a GAAP net loss of $4.9 billion and an operating loss of $2.59 billion after spending $20.7 billion in capital expenditures. Q1 2026 revenue was $4.69 billion, reflecting only 15% YoY growth, while quarterly capex reached $10.1 billion, highlighting the company's aggressive investment strategy.
Business Segments
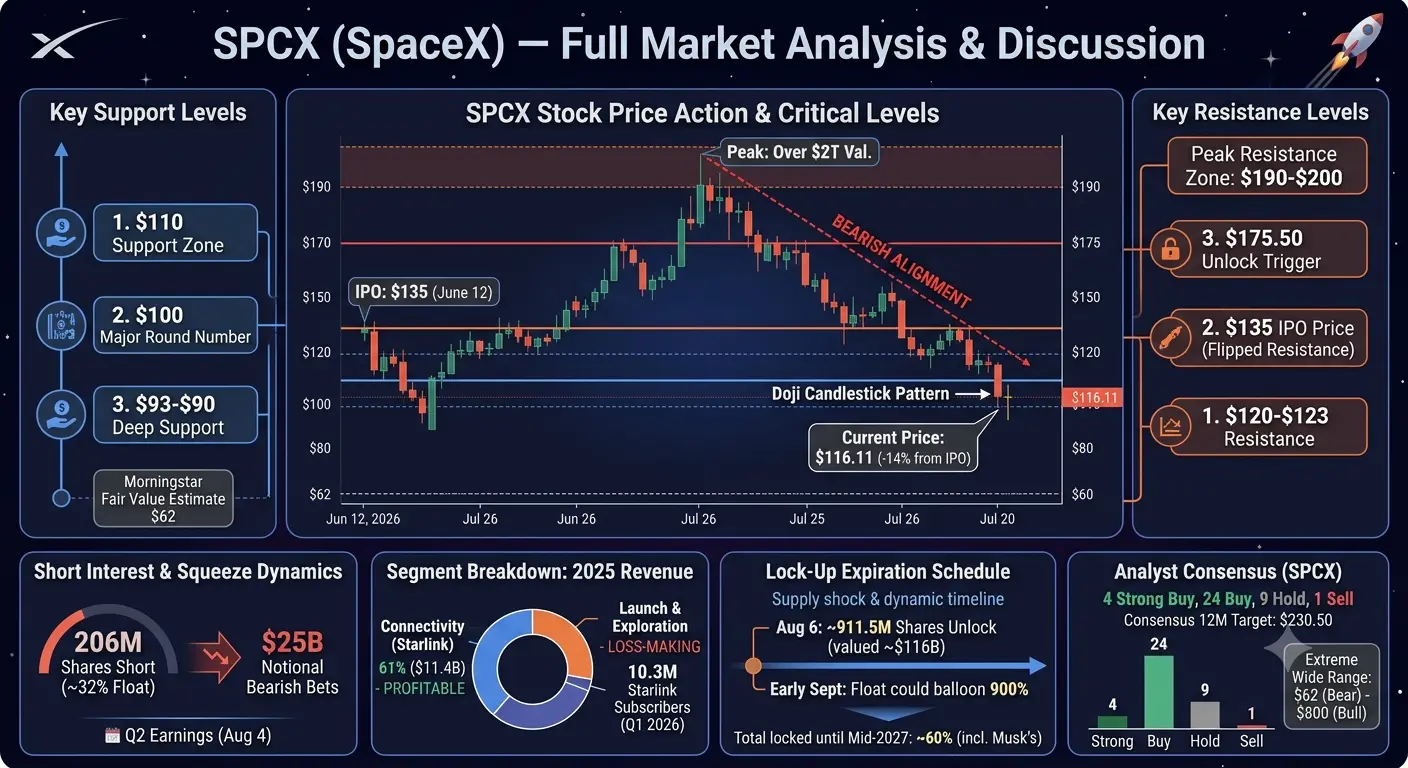
Starlink remains the company's only profitable division. It generated $11.4 billion in 2025 revenue, representing 61% of total sales and nearly 69% in Q1 2026. Operating profit reached approximately $4.4 billion, with EBITDA margins close to 63%. Subscribers doubled from 5 million to 10.3 million across 164 countries.
However, Starlink's average revenue per user declined from about $99 per month in 2023 to the mid-$60s by early 2026. Lower pricing has accelerated subscriber growth but reduced profitability per customer.
Meanwhile, the Launch and Exploration divisions continue operating at a loss as Starship development consumes significant capital without meaningful commercial revenue.
Successful Starship deployment could dramatically reduce launch costs and unlock entirely new markets, but continued delays increase financial pressure.
Current Price Action
SPCX trades around $116.11, roughly 14% below its IPO price and almost 48% below its post-IPO peak. The stock debuted at $161, surged above 40% during its first week, then entered a prolonged correction.
Recently it declined during 8 of the last 10 trading sessions, losing approximately 20.8% over ten days. Recent trading ranged between $111.40 and $116.74, reflecting elevated volatility.
Technical indicators remain bearish, although a doji candle with a long lower shadow near $110 suggests buyers are attempting to defend support.
Support Levels
$110 is the immediate support and has repeatedly held on closing prices despite brief intraday breaks.
The next major support sits at the psychological $100 level, where many long-term investors may become buyers. Historical IPO drawdown patterns also point toward approximately $104.
If selling accelerates below $100, the next important support lies in the $90–93 range.
Morningstar's estimated fair value of $62 represents a long-term valuation estimate rather than an immediate trading target.
Resistance Levels
Immediate resistance appears between $120 and $123.
Above that, the IPO price of $135 becomes the next major hurdle. Reclaiming this level would significantly improve market sentiment.
The $175.50 area is especially important because trading above this level activates an additional 455.8 million-share lock-up release, creating potential selling pressure. Strong resistance also exists around $190–200, the stock's previous highs.
Short Interest and Short Squeeze Potential
Approximately 206 million shares are currently sold short, representing nearly 32% of the public float and around $25 billion in bearish positions. This has increased nearly 400% since the IPO.
The short-interest ratio stands near 2.2 days to cover, meaning a positive earnings surprise could force rapid buying by short sellers.
Cathie Wood's ARK Invest appears positioned for this possibility, while institutional bears argue the valuation remains too expensive given current fundamentals. Elon Musk has repeatedly stated that short sellers "won't survive," echoing Tesla's history, although SpaceX's financial profile differs significantly today.
Lock-Up Expiration
The biggest structural risk remains the August 6 lock-up expiration, only two days after Q2 earnings.
Around 911.5 million shares worth roughly $116 billion become eligible for sale, exceeding today's public float value.
Additional tranches unlock throughout August, September, and October, potentially increasing the freely tradable float dramatically. By early December, roughly 40% of total shares could be publicly tradable, while Elon Musk's holdings remain locked until mid-2027.
This anticipated increase in supply explains much of the current selling pressure.
Analyst Outlook
Wall Street maintains a Moderate Buy rating based on 38 analysts, including 4 Strong Buy, 24 Buy, 9 Hold, and 1 Sell ratings.
The average 12-month price target is approximately $230.50, implying nearly 98% upside from current levels. Targets range from $62 (Morningstar) to $800 (Raymond James).
Bullish forecasts assume Starlink, Starship, orbital computing, and government contracts drive explosive long-term growth. Bears argue that a valuation exceeding 35–40x sales remains difficult to justify given ongoing losses.
Trading Strategy
The August 4 earnings report and August 6 lock-up expiration will likely determine SPCX's near-term direction.
If $110 continues holding, a rebound toward $120–123 is possible. A decisive breakdown increases the probability of a move toward $100.
Traders considering long positions may gradually accumulate between $110–115 with risk management below $105, while more conservative investors may wait closer to $100.
Strong earnings, accelerating Starlink growth, or improved guidance could trigger a meaningful short squeeze. Weak results combined with lock-up selling could accelerate downside pressure.
Longer term, reclaiming $135 would improve technical momentum, while sustained strength above $175 would depend on absorbing new share supply. A move back toward $200+ requires successful Starship commercialization, continued Starlink expansion, and improving fundamentals.
How High Can SPCX Go?
In the most bullish scenario, a strong earnings beat combined with short covering could quickly lift SPCX toward $150–175. Moving beyond $175.50 becomes more difficult because additional shares enter the market.
A return to $200 requires meaningful operational progress, while targets above $300 depend on multi-year execution in Starship, direct-to-cell communications, orbital computing, and defense contracts.
Raymond James' $800 target represents an aggressive long-term scenario requiring SpaceX to dominate global orbital infrastructure.
On the downside, continued Starship delays, faster ARPU declines, or overwhelming lock-up selling could push the stock toward $60–75.
Overall, the most realistic trading range for the next 3–6 months appears to be $90–150, with volatility driven primarily by earnings, lock-up events, and overall market sentiment.
@Gate_Square
Company Overview and Business Profile
SpaceX trades on NASDAQ under the ticker SPCX after completing the largest IPO in market history on June 12, 2026, raising $75 billion at $135 per share, valuing the company at approximately $1.75 trillion. Led by Elon Musk, SpaceX operates three core businesses: Starlink (Connectivity), Launch Services, and Starship Exploration.
The S-1 filing also included xAI and X (formerly Twitter) as common-control transactions, boosting reported revenue compared with standalone SpaceX operations. Total 2025 revenue reached $18.67 billion, up 33% from 2024, but the company reported a GAAP net loss of $4.9 billion and an operating loss of $2.59 billion after spending $20.7 billion in capital expenditures. Q1 2026 revenue was $4.69 billion, reflecting only 15% YoY growth, while quarterly capex reached $10.1 billion, highlighting the company's aggressive investment strategy.
Business Segments
Starlink remains the company's only profitable division. It generated $11.4 billion in 2025 revenue, representing 61% of total sales and nearly 69% in Q1 2026. Operating profit reached approximately $4.4 billion, with EBITDA margins close to 63%. Subscribers doubled from 5 million to 10.3 million across 164 countries.
However, Starlink's average revenue per user declined from about $99 per month in 2023 to the mid-$60s by early 2026. Lower pricing has accelerated subscriber growth but reduced profitability per customer.
Meanwhile, the Launch and Exploration divisions continue operating at a loss as Starship development consumes significant capital without meaningful commercial revenue.
Successful Starship deployment could dramatically reduce launch costs and unlock entirely new markets, but continued delays increase financial pressure.
Current Price Action
SPCX trades around $116.11, roughly 14% below its IPO price and almost 48% below its post-IPO peak. The stock debuted at $161, surged above 40% during its first week, then entered a prolonged correction.
Recently it declined during 8 of the last 10 trading sessions, losing approximately 20.8% over ten days. Recent trading ranged between $111.40 and $116.74, reflecting elevated volatility.
Technical indicators remain bearish, although a doji candle with a long lower shadow near $110 suggests buyers are attempting to defend support.
Support Levels
$110 is the immediate support and has repeatedly held on closing prices despite brief intraday breaks.
The next major support sits at the psychological $100 level, where many long-term investors may become buyers. Historical IPO drawdown patterns also point toward approximately $104.
If selling accelerates below $100, the next important support lies in the $90–93 range.
Morningstar's estimated fair value of $62 represents a long-term valuation estimate rather than an immediate trading target.
Resistance Levels
Immediate resistance appears between $120 and $123.
Above that, the IPO price of $135 becomes the next major hurdle. Reclaiming this level would significantly improve market sentiment.
The $175.50 area is especially important because trading above this level activates an additional 455.8 million-share lock-up release, creating potential selling pressure. Strong resistance also exists around $190–200, the stock's previous highs.
Short Interest and Short Squeeze Potential
Approximately 206 million shares are currently sold short, representing nearly 32% of the public float and around $25 billion in bearish positions. This has increased nearly 400% since the IPO.
The short-interest ratio stands near 2.2 days to cover, meaning a positive earnings surprise could force rapid buying by short sellers.
Cathie Wood's ARK Invest appears positioned for this possibility, while institutional bears argue the valuation remains too expensive given current fundamentals. Elon Musk has repeatedly stated that short sellers "won't survive," echoing Tesla's history, although SpaceX's financial profile differs significantly today.
Lock-Up Expiration
The biggest structural risk remains the August 6 lock-up expiration, only two days after Q2 earnings.
Around 911.5 million shares worth roughly $116 billion become eligible for sale, exceeding today's public float value.
Additional tranches unlock throughout August, September, and October, potentially increasing the freely tradable float dramatically. By early December, roughly 40% of total shares could be publicly tradable, while Elon Musk's holdings remain locked until mid-2027.
This anticipated increase in supply explains much of the current selling pressure.
Analyst Outlook
Wall Street maintains a Moderate Buy rating based on 38 analysts, including 4 Strong Buy, 24 Buy, 9 Hold, and 1 Sell ratings.
The average 12-month price target is approximately $230.50, implying nearly 98% upside from current levels. Targets range from $62 (Morningstar) to $800 (Raymond James).
Bullish forecasts assume Starlink, Starship, orbital computing, and government contracts drive explosive long-term growth. Bears argue that a valuation exceeding 35–40x sales remains difficult to justify given ongoing losses.
Trading Strategy
The August 4 earnings report and August 6 lock-up expiration will likely determine SPCX's near-term direction.
If $110 continues holding, a rebound toward $120–123 is possible. A decisive breakdown increases the probability of a move toward $100.
Traders considering long positions may gradually accumulate between $110–115 with risk management below $105, while more conservative investors may wait closer to $100.
Strong earnings, accelerating Starlink growth, or improved guidance could trigger a meaningful short squeeze. Weak results combined with lock-up selling could accelerate downside pressure.
Longer term, reclaiming $135 would improve technical momentum, while sustained strength above $175 would depend on absorbing new share supply. A move back toward $200+ requires successful Starship commercialization, continued Starlink expansion, and improving fundamentals.
How High Can SPCX Go?
In the most bullish scenario, a strong earnings beat combined with short covering could quickly lift SPCX toward $150–175. Moving beyond $175.50 becomes more difficult because additional shares enter the market.
A return to $200 requires meaningful operational progress, while targets above $300 depend on multi-year execution in Starship, direct-to-cell communications, orbital computing, and defense contracts.
Raymond James' $800 target represents an aggressive long-term scenario requiring SpaceX to dominate global orbital infrastructure.
On the downside, continued Starship delays, faster ARPU declines, or overwhelming lock-up selling could push the stock toward $60–75.
Overall, the most realistic trading range for the next 3–6 months appears to be $90–150, with volatility driven primarily by earnings, lock-up events, and overall market sentiment.
@Gate_Square