For day traders and swing traders, choosing the right momentum indicator matters because a rising price doesn't always mean buying pressure is accelerating. The following 12 tools compare momentum signals, overbought and oversold conditions, and practical trading applications, including where indicators can produce false signals.
Key Takeaways
-
Momentum indicators measure the speed and strength of price changes, helping identify bullish momentum, bearish momentum, and trend exhaustion.
-
RSI, Stochastic RSI, and Williams %R highlight overbought or oversold conditions, while MACD and PPO track momentum through moving averages.
-
Divergence between price action and momentum signals can indicate potential trend reversals, although timing remains uncertain.
-
Combining momentum analysis with volume, trend direction, and key levels generally provides better context than relying on one indicator.
What Is a Momentum Indicator and How Does It Work?
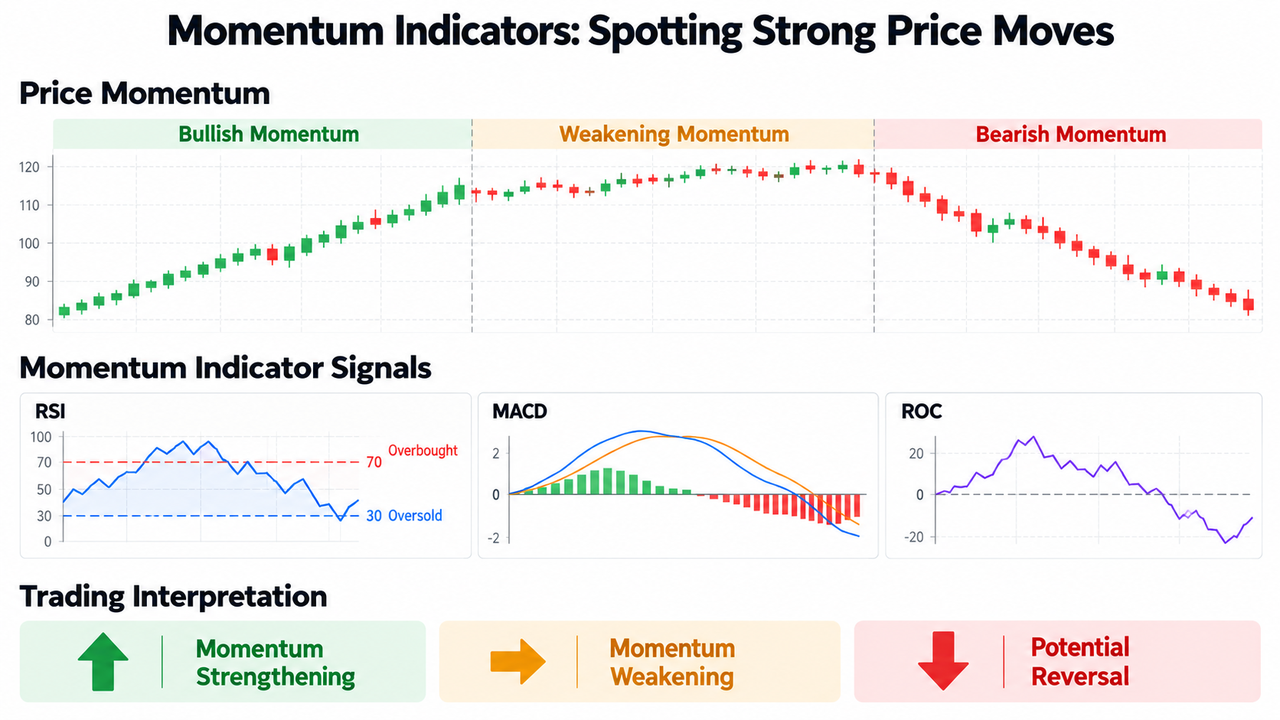
A momentum indicator measures the rate of price movement over a given period. Unlike a trend indicator that primarily identifies direction, a momentum tool helps determine whether upward momentum or downward pressure is strengthening or fading.
Most tools compare a recent price or closing price with historical norms. The resulting momentum value may appear around a zero line, between fixed boundaries, or as a percentage.
High readings can indicate rapid price changes. However, strong momentum doesn't guarantee continuation.
For example, Bitcoin might rise while RSI forms progressively lower highs. This bearish divergence suggests weakening buying momentum even though prices remain elevated.
Momentum indicators become more useful when combined with price action trading strategies, volume, and established support or resistance.
12 Best Momentum Indicators for Trading
These indicators were selected for their ability to measure price acceleration, identify momentum shifts, or confirm trend strength. They aren't ranked by profitability, which depends on market conditions and trading strategy.
| Indicator |
Primary Use |
Common Signal |
| RSI |
Momentum extremes |
70/30 levels |
| MACD |
Trend momentum |
Signal-line crossover |
| Stochastic Oscillator |
Closing-price position |
80/20 levels |
| Stochastic RSI |
Faster momentum shifts |
80/20 levels |
| ROC |
Percentage price change |
Zero-line crossover |
| CCI |
Price deviation |
+100/-100 levels |
| Williams %R |
Price extremes |
-20/-80 levels |
| TSI |
Smoothed momentum |
Zero-line crossover |
| PPO |
Percentage-based momentum |
Signal crossover |
| Awesome Oscillator |
Momentum acceleration |
Zero-line crossover |
| Accelerator Oscillator |
Momentum acceleration changes |
Histogram shifts |
| ADX |
Trend-strength confirmation |
Rising ADX |
-
Relative Strength Index (RSI): Best Momentum Indicator for Overbought and Oversold Conditions
The Relative Strength Index (RSI), developed by J. Welles Wilder Jr. in 1978, compares average recent gains and losses.
RSI ranges from 0 to 100, typically using 14 periods.
-
Above 70: Overbought conditions.
-
Below 30: Oversold conditions.
-
Above 50: Generally bullish momentum.
-
Below 50: Generally bearish momentum.
RSI can remain above 70 during strong rallies. Experienced traders therefore assess divergence and trend direction before interpreting extreme readings as sell signals.
-
Moving Average Convergence Divergence (MACD): Best for Momentum Signals
Moving Average Convergence Divergence (MACD) measures the relationship between two exponential moving averages.
The standard calculation subtracts the 26-period EMA from the 12-period EMA. A nine-period EMA of the MACD line becomes its signal line.
When MACD moves above its signal line, it indicates potential bullish momentum. A crossover below can suggest bearish momentum.
MACD is an unbounded oscillator. Its zero-line position and histogram help assess momentum, but sideways markets frequently produce misleading crossovers.
-
Stochastic Oscillator: Best for Closing Price Momentum
The Stochastic Oscillator compares the latest closing price with the high-low range over a selected period.
Readings above 80 suggest overbought conditions, while values below 20 indicate oversold levels.
Its %K and %D lines generate crossover signals. The indicator works particularly well for examining momentum near trading-range boundaries, although strong trends can keep readings extreme.
-
Stochastic RSI: Best for Early Momentum Changes
Stochastic RSI applies the stochastic calculation to RSI values rather than directly to prices.
It reacts more quickly than standard RSI and can identify potential reversals earlier.
The catch is sensitivity. Frequent overbought and oversold signals may create false entry and exit points during volatile trading sessions.
-
Rate of Change (ROC): Best for Measuring Price Acceleration
The Rate of Change indicator calculates the percentage change between the current closing price and a closing price from an earlier period.
ROC = [(Current Price − Previous Price) / Previous Price] × 100
Positive readings indicate gains over the lookback period; negative readings indicate losses.
An increasing positive ROC can reflect accelerating upward momentum, while divergence may suggest trend exhaustion.
-
Commodity Channel Index (CCI): Best for Price Deviations
The Commodity Channel Index compares typical price with its moving average, scaled by mean deviation.
Readings above +100 suggest unusually strong positive deviations, while readings below -100 suggest negative deviations.
CCI can identify emerging momentum and potential reversals, but its unbounded readings aren't automatic trading signals.
-
Williams %R: Best for Detecting Price Extremes
Williams %R measures where the closing price sits within its recent high-low range.
It ranges from -100 to 0.
Readings above -20 are commonly considered overbought; those below -80 indicate oversold conditions.
The indicator resembles the Stochastic Oscillator but uses a different scale. Extreme readings can persist during strong price trends.
-
True Strength Index (TSI): Best for Smoother Momentum Analysis
The True Strength Index uses double-smoothed price changes to evaluate momentum.
Positive readings generally indicate bullish momentum, while negative values indicate bearish momentum.
TSI reduces some short-term fluctuations, making it useful for swing traders. However, additional smoothing introduces lag when prices reverse sharply.
-
Percentage Price Oscillator (PPO): Best for Comparing Momentum Across Assets
The Percentage Price Oscillator measures the percentage difference between two exponential moving averages.
Unlike MACD, PPO expresses this difference relative to the longer EMA.
That makes momentum comparisons more meaningful across assets with substantially different prices.
-
Awesome Oscillator: Best for Short-Term Momentum Shifts
The Awesome Oscillator subtracts a 34-period simple moving average of median prices from a five-period average.
Histogram bars above the zero line indicate positive short-term momentum relative to longer-term momentum.
Changes in histogram direction may reveal weakening or strengthening movement before a clear price reversal.
-
Accelerator Oscillator: Best for Momentum Acceleration Changes
The Accelerator Oscillator measures changes in the Awesome Oscillator relative to its five-period simple moving average.
It aims to identify changes in momentum acceleration before the underlying momentum itself changes direction.
Its sensitivity can generate early warnings, but signals require confirmation because acceleration changes don't guarantee price reversals.
-
Average Directional Index (ADX): Best for Confirming Trend Strength
The Average Directional Index measures trend strength on a 0–100 scale without identifying direction.
A rising ADX indicates increasing trend strength, whether prices are rising or falling.
Readings above approximately 25 are commonly associated with stronger trends, although thresholds vary.
As explained in Charles Schwab's ADX and RSI analysis, combining trend strength with momentum readings helps distinguish sustained movements from possible exhaustion.
How to Combine Momentum Indicators With Moving Averages for Entry and Exit
Using multiple indicators can improve signal reliability when they measure different market characteristics rather than duplicate the same information.
Consider a hypothetical trader analyzing the BTC/USDT spot market on Gate.com.
The trader identifies three conditions:
-
Price closes above its 20-period EMA, indicating a positive short-term price trend.
-
RSI moves above 50 while MACD crosses its signal line, suggesting bullish momentum.
-
Trading volume increases during a breakout above resistance, supporting participation.
The trader can then assess entry and exit points against recent swing lows, position size, and risk tolerance.
Volume confirmation is useful because Money Flow Index incorporates both price and volume, while money flow volume measures volume weighted by a price's position within its range.
As Fidelity explains, money flow readings can help evaluate buying and selling pressure.
How to Choose the Right Momentum Indicator and Manage Risk
The best momentum indicator depends on trading style, time frame, and market conditions.
Day traders may prefer responsive tools such as Stochastic RSI, while swing traders may favor smoother TSI or MACD signals. Professional traders also assess liquidity, volatility, and key price levels.
Avoid stacking highly correlated technical indicators. RSI, Stochastic RSI, and Williams %R can produce similar signals without genuinely independent confirmation.
Indicator settings also matter. Shorter periods respond faster but increase noise; longer periods smooth movement while delaying signals.
A structured approach combines momentum analysis with risk management, defined exit points, and appropriate position size. No indicator guarantees trading success, especially during abrupt reversals or illiquid market conditions.
Conclusion
The 12 best momentum indicators help traders assess price movement strength, identify potential reversals, and evaluate trend continuation.
RSI and MACD are useful starting points, while ROC, TSI, PPO, and ADX provide different perspectives on momentum and trend strength.
The strongest trading decisions come from combining complementary indicators with price action, volume, and disciplined risk controls.
FAQs
What Is the Best Momentum Indicator for Beginners?
RSI is often a practical starting point because its 0–100 scale and traditional 70/30 thresholds are straightforward. MACD can complement RSI by showing momentum changes through moving averages.
Which Momentum Indicator Works Best for Day Trading?
Stochastic RSI, ROC, and MACD are commonly used for short-term momentum analysis. Their effectiveness depends on market volatility, indicator settings, and the chosen time frame.
Can Momentum Indicators Predict Price Reversals?
Momentum indicators can identify divergence, weakening momentum, and potential trend exhaustion. However, these signals cannot reliably predict the exact timing or size of a price reversal.
Is MACD Better Than RSI?
Neither is universally better. MACD is generally useful for examining trend momentum and moving-average relationships, while RSI helps identify momentum extremes and overbought or oversold conditions.
Can Momentum Indicators Be Used With Volume?
Yes. Combining momentum signals with trading volume can help assess whether market participation supports a price move. Money Flow Index and Chaikin Money Flow provide volume-sensitive perspectives, but neither eliminates false signals.
Disclaimer
This content is for educational and informational purposes only and does not constitute financial or investment advice. Technical indicators rely on historical market data and cannot guarantee future price movements. Cryptocurrency trading involves substantial risk, and product availability may vary by jurisdiction.







