Developed by Bill Williams, the Accelerator Oscillator indicator tracks whether market momentum is gaining speed or undergoing deceleration. Its calculation basically compares the Awesome Oscillator with a 5 period moving average, creating a data set that traders can use to detect early shifts in the market driving force. During a downtrend, traders can adjust the indicator alongside price structure and other confirmation tools, since its readings neither establish future price direction nor guarantee potential reversals.
TL;DR
-
The Accelerator Oscillator measures acceleration changes in market momentum rather than price direction alone.
-
Positive values place AC above the zero line, while negative values place it below the zero line.
-
Green columns indicate increasing acceleration, while red columns indicate decreasing acceleration.
-
Bill Williams’ original method uses two confirming bars when trading with the driving force and three when trading against it.
-
False signals are common in choppy markets, so traders should use price structure and other indicators for additional confirmation.
What Is the Accelerator Oscillator?
The Accelerator Oscillator, or AC, is a technical-analysis tool that measures whether the current driving force behind a market is accelerating or decelerating. It is sometimes called the Acceleration/Deceleration Oscillator or simply the acceleration oscillator.
Bill Williams developed the indicator around the idea that price changes occur after shifts in the forces driving the market. In this framework, acceleration changes first, momentum or driving force changes next, and price responds last. AC may therefore provide an earlier warning than indicators that focus only on price or broader momentum. It remains a leading signal rather than a reliable forecast.
Unlike a trend-following tool that mainly determines trend direction, AC gauges the difference between current momentum and its recent average. It can be applied across stocks, forex, futures and cryptocurrencies because its calculation uses only high and low price data from a selected chart.
How Does the Awesome Oscillator Support the Accelerator Oscillator?
The Awesome Oscillator forms the basis of the Accelerator Oscillator calculation. AO compares a five-period simple moving average with a 34-period simple moving average, both calculated from median price.
The median price for each period is:
Median Price = (High + Low) ÷ 2
The Awesome Oscillator is then calculated as:
AO = SMA(Median Price, 5) − SMA(Median Price, 34)
AO shows whether shorter-term momentum is stronger or weaker than longer-term momentum. The Awesome Oscillator indicator therefore measures the broader driving force, while AC measures how quickly that force is changing.
Understanding the SMA indicator also helps clarify why AC responds to averaged market data rather than every isolated price change.
How Is the Accelerator Oscillator Indicator Calculated?
The Accelerator Oscillator indicator is calculated by subtracting a five-period moving average of the Awesome Oscillator from the current AO value:
AC = AO − SMA(AO, 5)
The calculation follows three steps:
-
Determine the median price for each candle.
-
Calculate the difference between the five-period and 34-period SMAs of median price to produce AO.
-
Subtract the five-period SMA of AO from the current AO value.
The final difference appears as a histogram. A rising value normally produces a green column, while a declining value produces a red column. The colour represents the change from the previous bar, not whether the value itself is positive or negative.
How Does the Zero Line Affect Accelerator Oscillator Signals?
The zero line, also called the nought line, represents the point where the current Awesome Oscillator value equals its five-period average. It reflects a temporary balance between the market driving force and its acceleration.
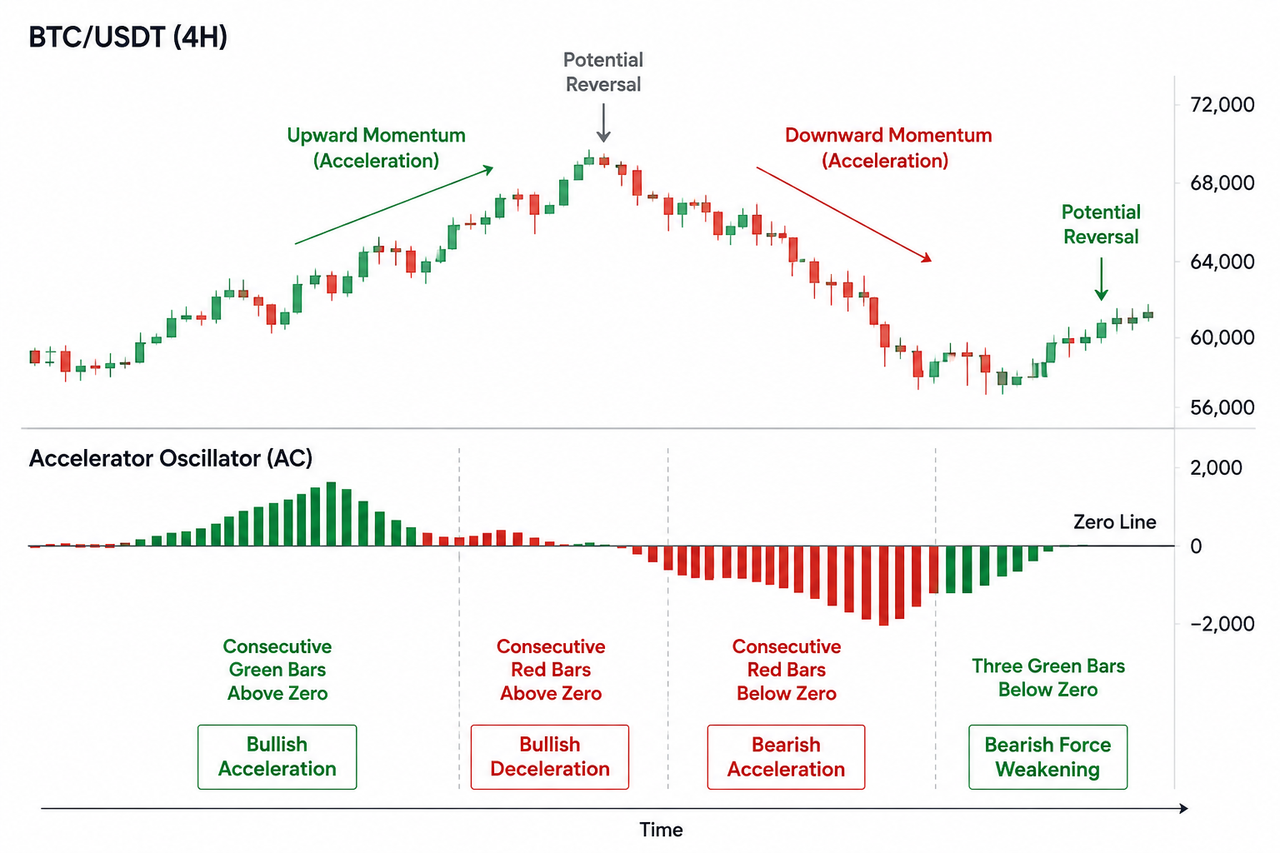
Positive values place the histogram above the zero line and generally indicate that upward acceleration has the advantage. Negative values place it below the zero line and generally indicate that downward acceleration has the advantage.
However, Bill Williams’ original interpretation does not treat a zero-line crossover as an independent trading signal. A cross above zero may support a bullish reading, while a cross below zero may support a bearish reading, but traders are instructed to watch the sequence and colour of the columns.
| AC condition |
Basic interpretation |
| Green columns above zero |
Bullish acceleration is increasing |
| Red columns above zero |
Upward momentum is decelerating |
| Red columns below zero |
Bearish acceleration is increasing |
| Green columns below zero |
Downward momentum is decelerating |
| Frequent shifts around zero |
Market direction may be weak or choppy |
How Does an Accelerator Oscillator Strategy Work?
An Accelerator Oscillator strategy uses consecutive green bars or consecutive red bars to confirm an acceleration change. The number of bars required depends on whether the proposed position follows or opposes the current driving force.
When AC is above zero, two consecutive green bars can form a potential buy signal because the buy position follows the positive driving force. When AC is below zero, two consecutive red bars can form a potential sell signal because the sell position follows the negative driving force.
Additional confirmation is required when the proposed trade opposes the current force:
-
Three consecutive green bars below zero may confirm a long position.
-
Three consecutive red bars above zero may confirm a short or sell position.
-
Traders should not buy while the current column is red.
-
Traders should not sell while the current column is green.
These are traditional AC signal rules, not guaranteed instructions. A trader may wait for the bar sequence to complete, confirm the trend direction, define a stop loss and determine a take-profit level before opening a position.
For example, a trader studying a BTC/USDT spot chart might look for three green bars below zero while price holds support and begins forming a higher low. The AC sequence shows that bearish force is decelerating, while price structure provides additional confirmation.
How Can a Moving Average Confirm Accelerator Oscillator Signals?
A moving average can establish the broader trend while AC gauges momentum acceleration within that trend. This combination can filter some false breakouts because the trading signal must agree with both market direction and acceleration.
For instance, price holding above a rising EMA 20 indicator suggests a short-term uptrend. Consecutive green bars on AC may then indicate that upward momentum is accelerating. Conversely, red columns appearing while price falls below the moving average can signal increasing downside pressure.
The ADX indicator can provide a different form of confirmation by showing whether the trend has meaningful strength. Unlike AC, ADX does not determine bullish or bearish direction.
What Are the Limitations of the Accelerator Oscillator?
The Accelerator Oscillator can produce false signals when the market is range-bound, volatile or reacting to sudden news. Green and red columns may alternate rapidly without developing into a sustained trend.
AC also measures acceleration from historical price data. Although it may detect early changes before some other oscillators, it cannot know whether the shift will lead to a reversal, consolidation or continuation. A weakening current driving force does not automatically mean price will turn.
Leverage increases the consequences of incorrect signals. Applying the strategy to a BTC/USDT perpetual contract requires separate analysis of liquidation risk, position size, margin, fees, stop-loss placement and market volatility.
Conclusion
The Accelerator Oscillator measures acceleration and deceleration in market momentum by subtracting a five-period SMA of the Awesome Oscillator from the current AO value. Its greatest advantage is the ability to highlight early changes in the market driving force through green and red histogram columns.
AC does not predict direction by itself. Traders gain more useful insights when its signals agree with price structure, trend direction, moving averages and other indicators. Proper position sizing, stop-loss planning and additional confirmation remain essential.
FAQ
Is the Accelerator Oscillator a leading indicator?
The Accelerator Oscillator is commonly treated as a leading indicator because it measures acceleration changes that may occur before momentum and price change direction. Early warning does not mean it can predict every reversal.
Do positive Accelerator Oscillator values always mean buy?
No. Positive values indicate that AC is above the zero line, but a buy signal depends on the colour and sequence of the bars. A red current bar does not support a buy under the traditional method.
What do two red columns mean?
Two red columns below zero may support a sell signal because the position follows the bearish driving force. When AC is above zero, the traditional method requires three red columns as additional confirmation.
Can the Accelerator Oscillator detect potential reversals?
AC can detect early acceleration changes that may precede potential reversals. The same signal can also lead to consolidation or trend continuation, so price action and other indicators should confirm the setup.
Is the Accelerator Oscillator suitable for cryptocurrency markets?
Yes. The calculation can be applied to cryptocurrency, stock, forex and futures charts. Its reliability still depends on timeframe, volatility, liquidity and prevailing market conditions.







