The Percentage Price Oscillator (PPO) tracks trend momentum through a percentage comparison between a shorter moving average and a longer moving average. This PPO calculation helps identify price trend direction across different securities, assets, and time frames because PPO readings are not tied to absolute price levels. As a technical analysis tool, it can highlight bullish or bearish sentiment, centerline and signal-line crossovers, histogram shifts, divergence, and potential buy or sell signals. This article explains how the PPO is calculated, how traders use those signals in practice, how it compares with MACD, and where its limitations can weaken trading decisions without confirmation from price structure, volume, and other indicators.
TL;DR
-
The PPO indicator measures the percentage distance between a fast moving average and a slow moving average.
-
A positive PPO generally reflects bullish trend momentum, while a negative value reflects bearish trend momentum.
-
PPO and signal-line crossovers can reveal changes in momentum, while the histogram shows whether that momentum is strengthening or weakening.
-
Unlike MACD, PPO produces percentage-based values that are easier to compare across assets and historical price levels.
-
PPO remains a lagging indicator and can generate repeated false signals during sideways or highly volatile markets.
What Is the Percentage Price Oscillator (PPO) Indicator?
The Percentage Price Oscillator belongs to the family of trend-following momentum oscillators. It compares two moving averages of the same asset and converts their difference into a percentage of the slower moving average.
Most charting platforms use exponential moving averages because an EMA gives greater weight to recent price data, allowing the oscillator to react faster than a comparable calculation based on a simple moving average. A simple moving average distributes equal weight across its selected periods, which generally produces a smoother but slower response.
The PPO usually appears below the price chart with three components:
| PPO Component |
Common Setting |
Function |
| Fast EMA |
12 periods |
Represents shorter-term price direction |
| Slow EMA |
26 periods |
Establishes the longer-term momentum baseline |
| Signal line |
9-period EMA of PPO |
Smooths the PPO line and highlights momentum shifts |
| Histogram |
PPO minus signal line |
Shows the distance between the two lines |
The 12, 26, and 9 settings are common conventions rather than universal requirements. Traders may adjust them according to the asset, timeframe, volatility, and desired sensitivity.
How Is the PPO Indicator Calculated Using Exponential Moving Average?
The standard PPO formula is:
PPO = [(Fast EMA − Slow EMA) ÷ Slow EMA] × 100
The signal line is then calculated as:
Signal Line = EMA of the PPO Line
Finally:
PPO Histogram = PPO Line − Signal Line
Suppose a cryptocurrency has a 12-period EMA of $105 and a 26-period EMA of $100:
PPO = [($105 − $100) ÷ $100] × 100 = 5%
The result means the fast EMA stands 5% above the slow EMA. It does not mean that the asset itself gained exactly 5% during the period. Instead, it describes the relative separation between the two smoothed price averages.
Dividing by the slow EMA gives PPO its main analytical advantage. A five-dollar moving-average difference has very different significance for an asset priced at $20 than for one priced at $2,000. Expressing that distance as a percentage makes cross-asset and long-term historical comparisons more meaningful.
How to Interpret PPO Signals
PPO Above or Below Zero
The zero line identifies the relationship between the two moving averages:
-
PPO above zero: The fast EMA is above the slow EMA, commonly indicating positive trend momentum.
-
PPO below zero: The fast EMA is below the slow EMA, commonly indicating negative trend momentum.
-
PPO near zero: The averages are close together, often reflecting weak momentum, consolidation, or a developing transition.
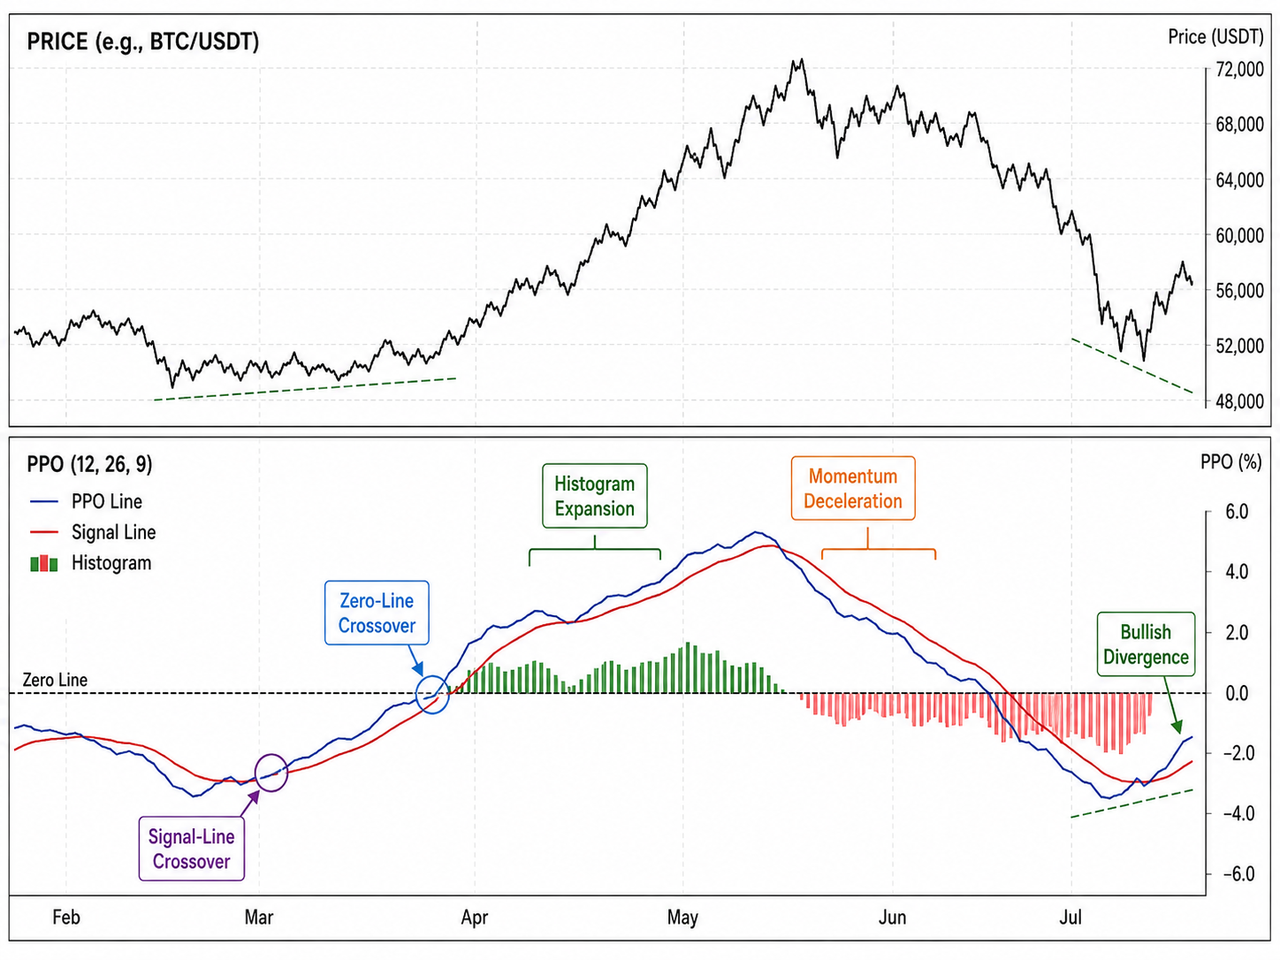
A zero-line crossover can confirm that the moving-average relationship has changed. However, it usually occurs after price has already begun moving because both EMAs depend on historical data.
PPO and Signal-Line Crossovers
A bullish crossover occurs when the PPO line moves above its signal line. This suggests that shorter-term momentum is improving relative to its recent smoothed trend.
A bearish crossover occurs when the PPO line moves below the signal line, suggesting that momentum is weakening. These signals resemble MACD crossovers because both indicators compare fast and slow exponential moving averages.
Crossovers carry more weight when they align with the broader trend. For example, a bullish crossover above zero may support trend continuation, while the same crossover below zero may represent only a temporary recovery within a downtrend.
PPO Histogram Expansion and Contraction
The histogram measures the difference between the PPO line and its signal line:
-
Rising positive bars indicate strengthening bullish momentum.
-
Shrinking positive bars indicate that bullish momentum is decelerating.
-
Falling negative bars indicate strengthening bearish momentum.
-
Shrinking negative bars indicate that bearish momentum is losing force.
Histogram contraction does not automatically confirm a reversal. It shows that the existing rate of momentum is changing, while price may continue in the same direction.
PPO Divergence and Momentum Shifts
Divergence develops when price and PPO move in different directions.
Bullish divergence occurs when price forms a lower low while PPO forms a higher low. The percentage-based downward momentum has weakened even though price reached a new low.
Bearish divergence occurs when price forms a higher high while PPO forms a lower high. Price remains elevated, but the underlying upward momentum has decelerated.
PPO divergence develops when the price plot reaches a new high or low without a corresponding extreme in the oscillator. A higher price high paired with a lower PPO high indicates weakening upward momentum, while a lower price low paired with a higher PPO low indicates that bearish momentum is easing. Divergence warns of momentum deterioration but does not confirm that a reversal has begun. Confirmation may come from a support or resistance break, changing volume, candlestick structure, or another oscillator. The RSI indicator measures the speed and magnitude of recent price changes, while the ROC indicator directly compares current price with price from a selected number of periods earlier.
PPO vs. MACD: What Is the Difference?
PPO and MACD use similar moving-average structures, but their output scales differ.
| Criterion |
PPO |
MACD |
| Calculation |
Percentage difference between two moving averages |
Absolute difference between two moving averages |
| Output |
Percentage |
Price units |
| Cross-asset comparison |
More consistent |
Less consistent |
| Historical comparison |
Adjusts for changing price levels |
Influenced by the asset’s price level |
| Signals |
Zero crosses, signal crosses, histogram and divergence |
Zero crosses, signal crosses, histogram and divergence |
Consider two assets whose fast EMA sits $10 above the slow EMA. MACD reports the same $10 difference for both. PPO distinguishes whether that gap represents 1%, 5%, or 20% of the slower average.
Because it normalizes by the slower average, PPO is less sensitive to large price changes than MACD over an extended period.
PPO is therefore more suitable when comparing percentage-based momentum across cryptocurrencies with substantially different prices. MACD may be more intuitive when the absolute price-unit difference is analytically useful. Neither indicator is universally superior.
How Traders Can Use the PPO Indicator
PPO works best as part of a confirmation process rather than as an isolated buy-or-sell trigger.
A trend-following approach may first identify whether PPO is above or below zero, then use a signal-line crossover to evaluate changes in momentum. Price should still confirm the interpretation through market structure, such as a breakout, higher low, lower high, or support retest.
Traders can compare a PPO signal with a live BTC/USDT chart to determine whether price action, trading volume, and nearby support or resistance reinforce the oscillator reading. An ADX reading can help distinguish a strong directional trend from a weak market, while a Stochastic RSI can identify short-term momentum extremes within the broader setup.
Shorter PPO settings react faster but create more noise. Longer settings reduce sensitivity but increase lag. Testing should therefore use the same asset, timeframe, and market conditions in which the indicator will be applied.
Risks and Limitations of the PPO Indicator
PPO inherits the lag of its underlying moving averages. Signal-line and zero-line crossovers may appear only after a substantial part of the move has occurred.
Sideways markets can produce frequent crossovers around zero without establishing a sustainable trend. Sudden price movements can also expand the histogram sharply before reversing, particularly in thin or highly leveraged markets.
Percentage normalization improves comparison but does not make momentum directly comparable under every condition. Two assets can show identical PPO values while having very different liquidity, volatility, volume, and market structure.
PPO does not have universal overbought and oversold levels. A reading above +5 may appear unusually high for a particular security based on its historical PPO range, but +5 should not be treated as a standard overbought threshold across cryptocurrencies, stocks, or different time frames. Extreme PPO readings must be evaluated relative to the same asset’s volatility, market trends, and previous oscillator behavior.
Conclusion
The PPO indicator measures trend momentum by expressing the distance between fast and slow moving averages as a percentage of the slower average. This normalization makes PPO especially useful for comparing momentum across assets or across periods in which an asset’s price changed substantially.
Zero-line position establishes the broad momentum direction, while signal-line crossovers, histogram changes, and divergence reveal acceleration or deceleration. Its strongest use involves confirming an existing price trend rather than predicting a reversal independently. Because PPO remains lagging and vulnerable to whipsaws, signals should be evaluated with price structure, volume, trend strength, and risk controls.
FAQ
Is the PPO indicator a momentum indicator?
Yes. PPO is a trend-following momentum oscillator that measures the percentage separation between fast and slow moving averages. It reflects both momentum direction and changes in momentum strength.
What are the best PPO settings?
The conventional setting is 12, 26, and 9, representing the fast EMA, slow EMA, and signal line; these settings reflect the number of time periods used in each calculation. The best setting varies by asset, timeframe, volatility, and trading objective, so no configuration is universally optimal.
Does PPO show overbought and oversold conditions?
PPO has no fixed overbought or oversold thresholds. Extreme readings should be compared with the asset’s historical PPO range and current market regime.
Is PPO better than MACD?
PPO, the percentage version of MACD, is generally more suitable for comparing assets or historical periods because it expresses momentum as a percentage. MACD may be more intuitive when absolute price-unit differences matter, but neither provides consistently superior signals in every market.
Can PPO predict trend reversals?
PPO can reveal weakening momentum through histogram contraction or divergence, but it cannot reliably predict the timing of a reversal. Price confirmation and risk management remain necessary.
Which indicators work well with PPO?
PPO works best with other indicators such as ADX for trend strength, RSI or the Stochastic Oscillator for overbought and oversold context, and volume or support and resistance for confirmation. Combining indicators does not eliminate false signals.







