The CCI indicator, formally known as the Commodity Channel Index (CCI), is a momentum oscillator developed by Donald Lambert in 1980 to measure price deviation from an average price level. The commodity channel index indicator helps traders identify overbought and oversold conditions, evaluate market momentum, and detect potential trend reversals by comparing an asset's current price with its historical statistical mean. Although CCI values typically oscillate between +100 and -100, the indicator has no fixed upside or downside limits, meaning exceptionally strong trends can push readings beyond +200 or -200.
TL;DR
-
The Commodity Channel Index CCI compares the typical price with its recent average price and average deviation.
-
CCI values typically oscillate between +100 and -100, although the indicator has no fixed upside or downside limits.
-
Readings above +100 indicate strong bullish momentum or overbought conditions, while readings below -100 indicate strong selling pressure or oversold conditions.
-
CCI signals can support trend confirmation, mean-reversion analysis, and the identification of momentum shifts.
-
Combining CCI with price action, moving averages, volume, and other momentum indicators can reduce false signals.
What Is the CCI Indicator?
The Commodity Channel Index indicator is a technical indicator developed by Donald Lambert in 1980 to identify cyclical trends and overextended price levels. Although it was originally designed for commodities, CCI is now used across financial markets, including cryptocurrencies, stocks, forex, and indices.
The CCI indicator measures the current price level relative to an asset’s recent average price. Positive values show that the typical price is above the average price level, while negative values indicate that it is below the average.
Unlike the Relative Strength Index, which remains between 0 and 100, CCI has no fixed upper or lower boundary. CCI values typically oscillate between +100 and -100, but strong trends can push the indicator beyond +200 or -200.
The main applications of the Commodity Channel Index include:
-
identifying overbought and oversold conditions;
-
confirming bullish or bearish trends;
-
measuring trend strength;
-
detecting bullish divergence and bearish divergence;
-
identifying momentum shifts through zero-line crossovers.
An extreme reading does not automatically indicate a price reversal. In trending markets, CCI can remain above overbought levels or below oversold levels for an extended period.
How Does the CCI Indicator Work?
The CCI calculation measures price deviation from a recent average and adjusts that distance according to normal market variability. The standard CCI setting is commonly 14 or 20 periods, although 20 periods is widely used on many price chart platforms.
The calculation begins with the following formula:
Typical Price = (High + Low + Close) ÷ 3
The complete formula is:
CCI = (Typical Price − Moving Average of Typical Price) ÷ (0.015 × Mean Absolute Deviation)
| Component |
Purpose |
| Typical price |
Represents the average location of price during one period |
| Moving average |
Establishes the recent average price level |
| Mean absolute deviation |
Measures the average distance between past prices and the statistical mean |
| 0.015 constant |
Scales most CCI values around the +100 and -100 range |
The SMA indicator provides the average price baseline used in the standard formula. CCI then compares the asset’s current price with that baseline and accounts for the average deviation of previous price movements.
When price stays near its recent average, CCI moves close to the zero line. When price rises or falls much farther than normal, the CCI line moves toward an extreme.
What Do CCI Values Mean?
CCI values show the direction and intensity of market momentum.
| CCI value |
Common interpretation |
| Above +200 |
Exceptionally strong bullish trend or extreme upside extension |
| Above +100 |
Strong upward momentum or overbought conditions |
| Between 0 and +100 |
Moderate positive momentum |
| Between 0 and -100 |
Moderate negative momentum |
| Below -100 |
Strong downward momentum or oversold conditions |
| Below -200 |
Exceptionally strong bearish trend or extreme downside extension |
A reading above +100 may indicate that price has entered an overbought zone, but it can also confirm a strong uptrend. A reading below -100 may identify oversold conditions, although it can also reflect sustained selling pressure in a bearish trend.
For this reason, overbought and oversold levels should be interpreted according to market structure. In choppy markets, the CCI indicator may produce frequent false signals as price repeatedly crosses the +100, -100, and zero-line thresholds.
How Does CCI Identify Cyclical Momentum Extremes?
The Commodity Channel Index identifies cyclical momentum extremes by showing when an asset’s price has moved unusually far from its recent statistical mean.
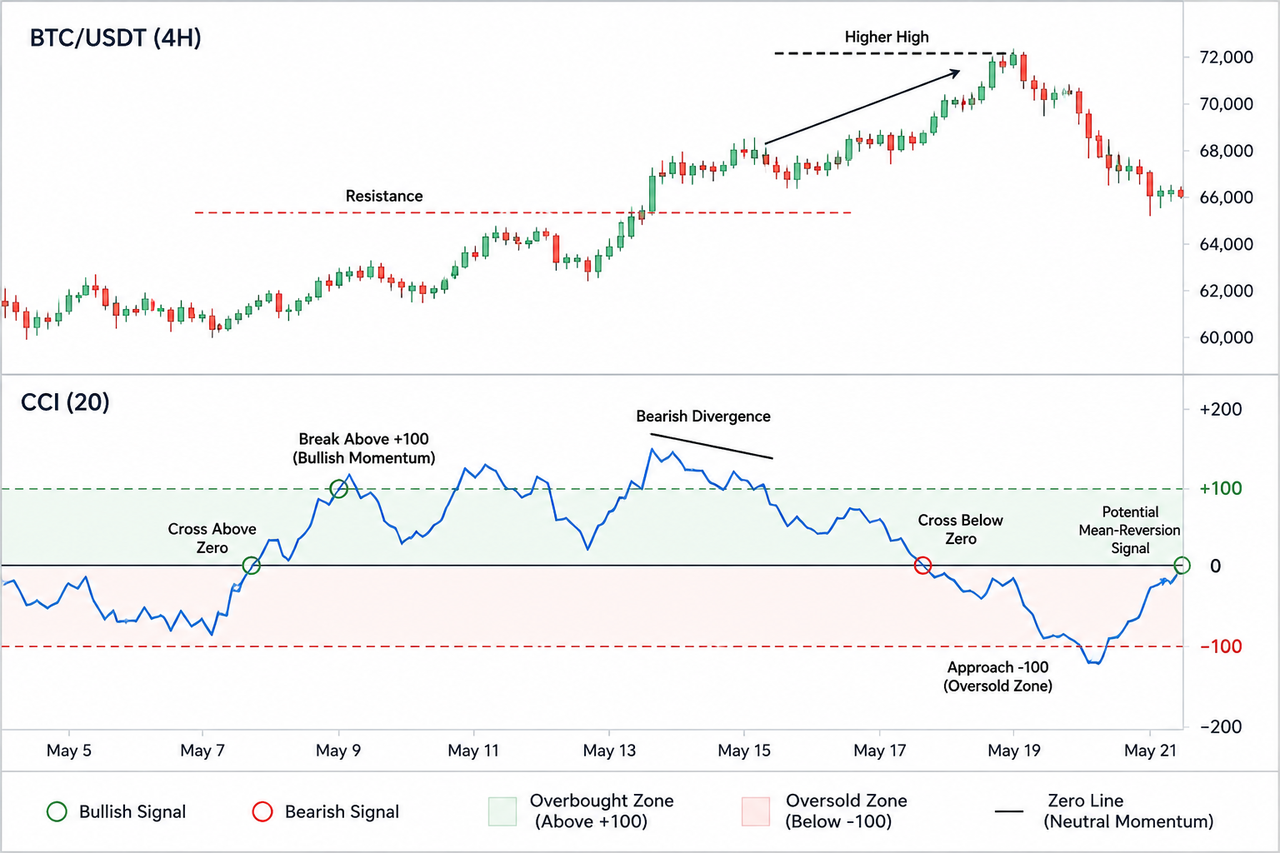
A bullish momentum cycle may develop as follows:
-
CCI moves upward from negative values.
-
CCI crosses above the zero line as market momentum turns positive.
-
A CCI break above +100 confirms stronger bullish momentum.
-
The CCI line reaches an extreme while price trends higher.
-
CCI falls back toward zero as momentum begins weakening.
A bearish cycle follows the opposite sequence. CCI moves below zero, breaks under -100, and may continue toward -200 during a strong bearish trend.
The EMA 20 indicator can help define the short-term trend, while CCI measures how far the current move has extended from its average price. Traders can compare these relationships across multiple timeframes on a BTC/USDT spot chart, since the same CCI value may describe different market cycles on hourly and daily charts.
How Can CCI Identify Overbought and Oversold Conditions?
CCI can identify overbought and oversold conditions by locating unusually large deviations from the average price.
A possible overbought setup may include:
-
CCI moving above the +100 overbought threshold;
-
price reaching resistance;
-
CCI falling back below +100;
-
declining volume;
-
a failed breakout or bearish reversal candle.
A possible oversold setup may include:
-
CCI falling below -100;
-
price reaching support;
-
CCI crossing back above the oversold threshold;
-
reduced selling pressure;
-
a bullish reversal pattern.
The overbought oversold interpretation is most useful in ranging or cyclical markets. During strong trends, fading every extreme CCI move can create premature entry or exit points.
How Do Bullish and Bearish Divergence Work?
Bullish divergence occurs when the asset’s price forms a lower low while CCI makes a higher low. The pattern suggests that bearish momentum is weakening even though the price chart continues declining.
Bearish divergence occurs when the asset price reaches a new high while CCI makes a lower high. This shows that the new price high is supported by less momentum than the previous one.
Divergence signals can identify potential trend reversals, but they are not confirmed buy or sell signals. Divergence may continue for several periods during strong trends, so traders often wait for price crosses, support or resistance breaks, or a CCI zero-line crossover.
How Can CCI Confirm Trend Strength?
CCI can help identify the strength of market trends when extreme values align with price action.
Repeated CCI crosses above +100 during a bullish trend may confirm sustained buying pressure. Repeated readings below -100 during a bearish trend may indicate continued selling pressure.
The ADX indicator can help determine whether the market is trending or moving sideways. Rising ADX with a CCI break supports trend continuation, while weak ADX may make mean-reversion CCI signals more relevant.
Combining CCI with the MACD indicator can also improve price analysis. CCI measures price deviation, while MACD evaluates relationships between moving averages. Agreement between both momentum indicators may provide stronger confirmation, although no combination eliminates risk.
CCI can also be studied on a BTC/USDT perpetual futures chart, but leverage and liquidation pressure can keep CCI values extended. Extreme futures readings should not be treated as guaranteed reversal signals.
What Are the Limitations of the CCI Indicator?
The CCI indicator is a useful and reliable technical indicator when interpreted correctly, but it has several limitations:
-
Strong trends can keep CCI in overbought or oversold conditions for long periods.
-
Short settings may create excessive false signals in choppy markets.
-
CCI relies on historical price movements and cannot predict unexpected events.
-
The standard calculation does not include volume or liquidity.
-
Divergence signals may appear long before a price reversal.
-
Different assets may require different settings and overbought oversold levels.
-
CCI signals can conflict across multiple timeframes.
The indicator should therefore be combined with price action, trend analysis, support and resistance, risk controls, and other indicators.
Conclusion
The CCI indicator measures how far an asset’s price has moved from its recent average price and normal average deviation. The Commodity Channel Index CCI can identify overbought and oversold conditions, confirm price trends, measure market momentum, and highlight bullish divergence, bearish divergence, and potential trend reversals.
Readings above +100 indicate strong upward momentum or overbought conditions, while values below -100 indicate strong downside momentum or oversold conditions. Extreme values beyond +200 or -200 can accompany exceptionally strong trends.
CCI works best when its signals match the broader market regime. In trending markets, extreme readings may confirm continuation. In ranging markets, the same readings may identify possible mean-reversion opportunities. Combining CCI with moving averages, trend strength indicators, price action, and other momentum indicators can help reduce false signals.
This content is provided for educational purposes and does not constitute financial advice. Cryptocurrency markets are volatile, and technical analysis cannot guarantee profitable outcomes.
FAQ
What is the standard CCI indicator setting?
The standard CCI setting is commonly 14 or 20 periods. A shorter setting responds more quickly but may create more false signals, while a longer setting produces smoother readings.
What does a CCI reading above +100 mean?
A CCI reading above +100 indicates strong bullish momentum or overbought conditions. In a strong uptrend, the reading may confirm continuation rather than signal an immediate price reversal.
What does a CCI reading below -100 mean?
A reading below -100 indicates strong selling pressure or oversold conditions. Confirmation from support, price action, and momentum shifts is needed before interpreting it as a reversal signal.
Is CCI better than RSI?
CCI is not universally better than RSI. CCI measures price deviation from an average, while the Relative Strength Index measures the strength of recent gains and losses.
Can CCI identify trend reversals?
CCI can identify potential trend reversals through extreme readings, zero-line crossovers, and divergence signals. These signals require confirmation because strong trends can remain extended.
Can CCI be used for cryptocurrencies?
Yes. The Commodity Channel Index is used across cryptocurrencies, stocks, forex, commodities, and other financial markets. Its settings should be adjusted according to the asset, timeframe, and volatility.







