The RSI indicator is useful for beginners learning technical analysis and for experienced traders adapting signals to their trading style. Its main value lies in showing whether recent buying or selling pressure is strengthening, weakening, or moving into unusually extreme territory.
TL;DR
-
The Relative Strength Index compares the average gain and average loss over a selected period.
-
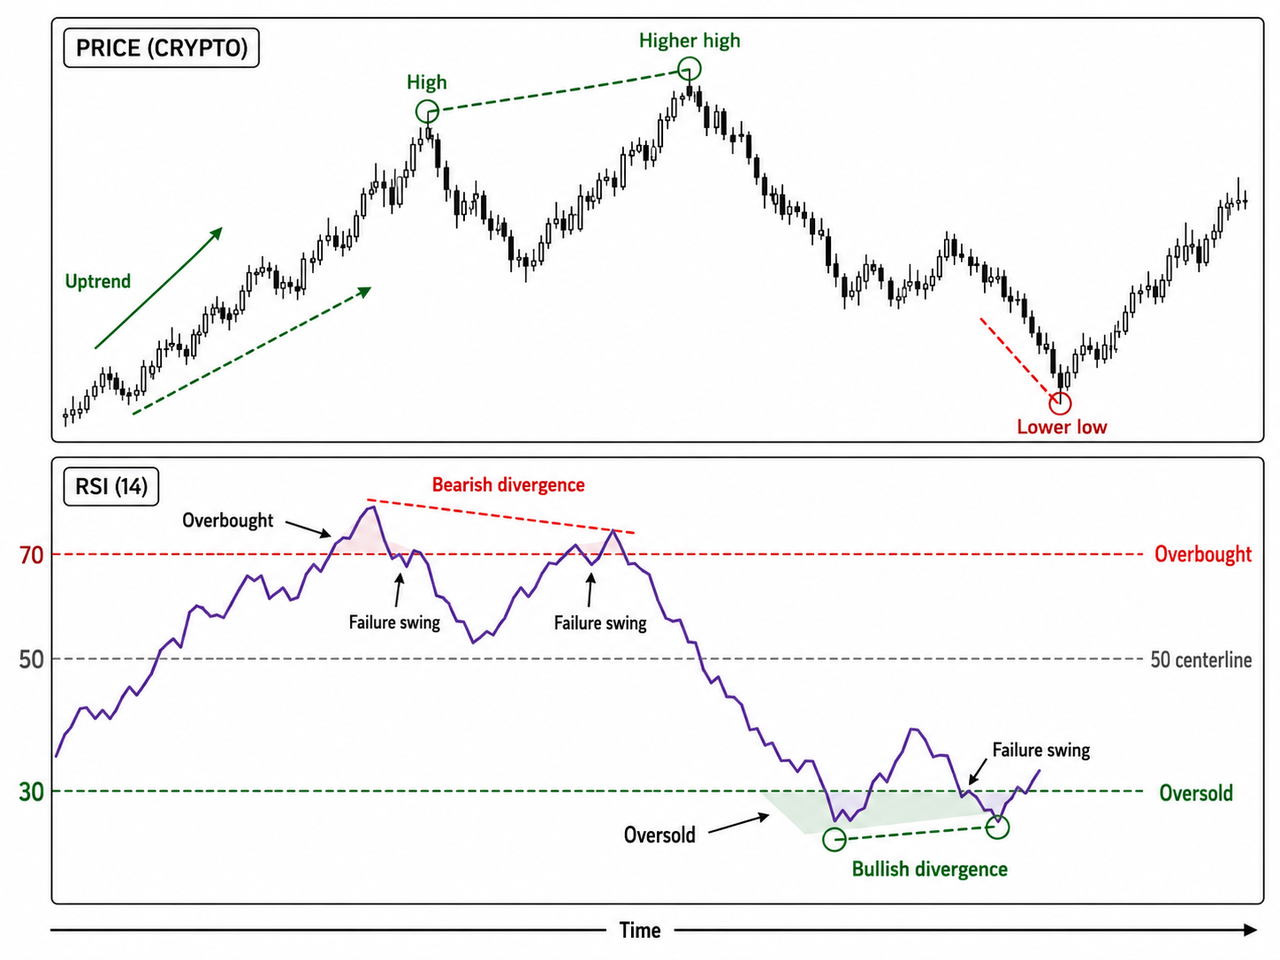
Standard RSI values above 70 indicate overbought territory, while values below 30 indicate oversold territory.
-
RSI divergence occurs when the indicator and the asset price move in different directions.
-
Bullish divergence and bearish divergence can warn of weakening momentum, but they may produce false signals during strong trends.
-
RSI works best when combined with price structure, volume analysis, and other technical indicators.
What Is the Relative Strength Index?
The Relative Strength Index is a bounded momentum indicator developed by J. Welles Wilder Jr. and introduced in his book New Concepts in Technical Trading Systems. RSI measures the relationship between positive and negative price changes, converting that relationship into a reading between 0 and 100.
The indicator does not compare one cryptocurrency with another. “Relative strength” refers to the relationship between an asset’s own gains and losses across a selected period.
A rising RSI indicates that recent gains are becoming stronger relative to recent price decreases. A falling RSI shows that losses are gaining influence and downside momentum may be increasing. Unlike the EMA 20 indicator and SMA indicator, RSI focuses on momentum rather than smoothing closing prices to identify trend direction.
How Does the RSI Calculation Work?
The standard RSI calculation uses a 14-period look-back, although the RSI setting can be changed for different timeframes and trading objectives.
The formula is:
RSI(n) = 100 − [100 ÷ (1 + U(n) ÷ D(n))]
In this formula:
-
U(n) represents the smoothed average gain over the selected period.
-
D(n) represents the smoothed average loss.
-
RS value equals average gain divided by average loss.
The first calculation separates positive and negative changes between consecutive closing prices. Gains and losses are averaged over the initial 14 periods. Subsequent RSI values use Wilder’s smoothing method, which gives the indicator a more stable progression than repeatedly calculating a simple average.
When gains become larger or more frequent, the RS value rises and RSI moves toward 100. When losses dominate, RSI moves toward zero. The RSI ranges remain fixed, but its meaning depends on the surrounding market conditions.
What Do Overbought and Oversold Levels Mean?
The standard overbought and oversold levels are 70 and 30, but they describe momentum extremes rather than automatic trading decisions.
| RSI range |
Common interpretation |
Practical meaning |
| Above 70 |
Considered overbought |
Buying momentum has been unusually strong |
| 50 to 70 |
Bullish momentum |
Average gains dominate average losses |
| Around 50 |
Neutral centerline |
Momentum is relatively balanced |
| 30 to 50 |
Bearish momentum |
Losses have greater influence |
| Below 30 |
Oversold reading |
Selling momentum has been unusually strong |
An RSI reading above 70 places the indicator in overbought territory, while a reading below 30 places it in one of the standard oversold zones. These overbought or oversold levels do not show whether an asset is fundamentally expensive or cheap.
In a strong uptrend, RSI can remain overbought for extended periods. In a strong downtrend, RSI can remain below the standard oversold levels while the downward trend continues. Overbought readings are therefore not automatically a sell signal, and oversold conditions are not automatically a buy signal.
Traders may consider adjusting RSI parameters for trending markets. In a bull market, the indicator may fluctuate mainly between 40 and 80. In a bear market, RSI may remain between 20 and 60. Cardwell’s trend interpretation uses the 40-to-80 range for an upward trend and the 20-to-60 range for a bearish trend.
How Does RSI Divergence Work?
RSI divergence occurs when the direction of the indicator disagrees with the direction of price. The difference may show that price momentum is no longer confirming the latest high or low.
Bullish divergence occurs when price makes a lower low while RSI forms a higher low. This pattern suggests that selling pressure is weakening even though the asset price remains in a downward trend. A bullish divergence indicates improving bullish momentum, but confirmation is still required.
Bearish divergence occurs when price forms a higher high while RSI forms a lower high. The price advance continues, but the indicator suggests that buying momentum is weakening and a possible downside momentum shift is developing.
Both bearish and bullish divergences can precede reversals, but RSI divergence can be misleading during strong trends. Divergence is better treated as a warning than as a complete trading strategy.
The indicator can also form positive and negative reversals. A positive reversal appears when price forms a higher low while RSI forms a lower low, potentially supporting continued bullish movement. A negative reversal develops when price creates a lower high while RSI creates a higher high, potentially supporting bearish continuation.
What Are RSI Failure Swings?
Failure swings are RSI patterns that focus only on indicator behavior rather than direct comparison with price.
A bullish failure swing forms when RSI:
-
Moves into oversold territory below 30.
-
Recovers above 30.
-
Pulls back without returning below 30.
-
Breaks its previous RSI high.
A bearish failure swing forms when RSI moves above 70, falls, rebounds without returning to the previous high, and then breaks its prior low. These patterns may signal weakening momentum, but true reversal signals remain difficult to identify consistently.
How Can Traders Use RSI Signals?
RSI can support a trading strategy by confirming trend strength, identifying momentum extremes, and filtering entries produced by other technical indicators.
A trader might watch for:
-
RSI crosses above 50 during a bullish trend.
-
RSI crosses below 50 during a bearish trend.
-
RSI breaks a previous high or low after a failure swing.
-
Bullish divergence near established support.
-
Bearish divergence near resistance.
-
Overbought or oversold readings aligned with broader market structure.
Combining RSI with the MACD indicator provides both momentum and moving-average context. The differences between their signals are especially relevant when comparing MACD and RSI for swing trading.
Traders may also evaluate RSI conditions in the spot market or translate indicator rules into systematic workflows through indicator-based trading bots. Different trading styles may require different RSI parameters, timeframes, confirmation rules, and risk limits.
What Are the Limitations of RSI?
RSI interpretation becomes less reliable when volatile news events create sudden price changes. The indicator does not account for trading volume, order flow, liquidity, or the cause of recent price movements.
RSI can remain overbought or oversold for extended periods and may generate false signals in trending markets. Short settings react quickly but increase noise, while longer settings respond more slowly. Most trading platforms use 14 periods by default, but no RSI parameters work equally well in every market.
RSI behavior should therefore be evaluated with trend direction, support and resistance, volatility, and position sizing. The indicator is an analytical tool, not personalized investment advice, and no signal can guarantee a profitable result.
Conclusion
The RSI indicator measures the balance between recent gains and losses to identify momentum direction and potential overbought or oversold conditions. RSI readings, divergence, centerline crossings, reversals, and failure swings can reveal changes in market momentum, but reliable interpretation depends on trend context, confirmation, and disciplined risk management.
FAQ
What is the standard RSI setting?
The standard RSI setting is 14 periods. Shorter settings produce faster signals, while longer settings create smoother readings with fewer short-term fluctuations.
Is RSI above 70 always a sell signal?
No. RSI above 70 indicates unusually strong upward momentum, but price may continue rising during a sustained trend.
Is RSI below 30 always a buy signal?
No. RSI below 30 signals strong downward momentum rather than guaranteed undervaluation or an immediate recovery.
What does an RSI crossing 50 mean?
A move above 50 suggests average gains have become stronger than average losses. A move below 50 indicates that bearish momentum has gained greater influence.
Can RSI be used for cryptocurrency trading?
Yes. RSI can be applied to cryptocurrency charts across different timeframes, although high volatility can produce frequent extreme readings and false signals.
Is RSI a leading or lagging indicator?
RSI is based on historical price movements and therefore has lagging characteristics. Divergence may provide an early warning, but it cannot reliably predict when a reversal will occur.







