Because Stochastic RSI responds faster than the standard RSI indicator, it is frequently used in short-term trading strategies, including day trading, swing trading, and scalping. Its speed can reveal more trading opportunities, but it can also create more false signals and bad signals when market direction is unclear.
TL;DR
-
Stoch RSI applies the stochastics formula to RSI values rather than directly to price values.
-
StochRSI equals 0 when RSI reaches its lowest point during the selected look-back period and equals 1 when RSI reaches its highest point.
-
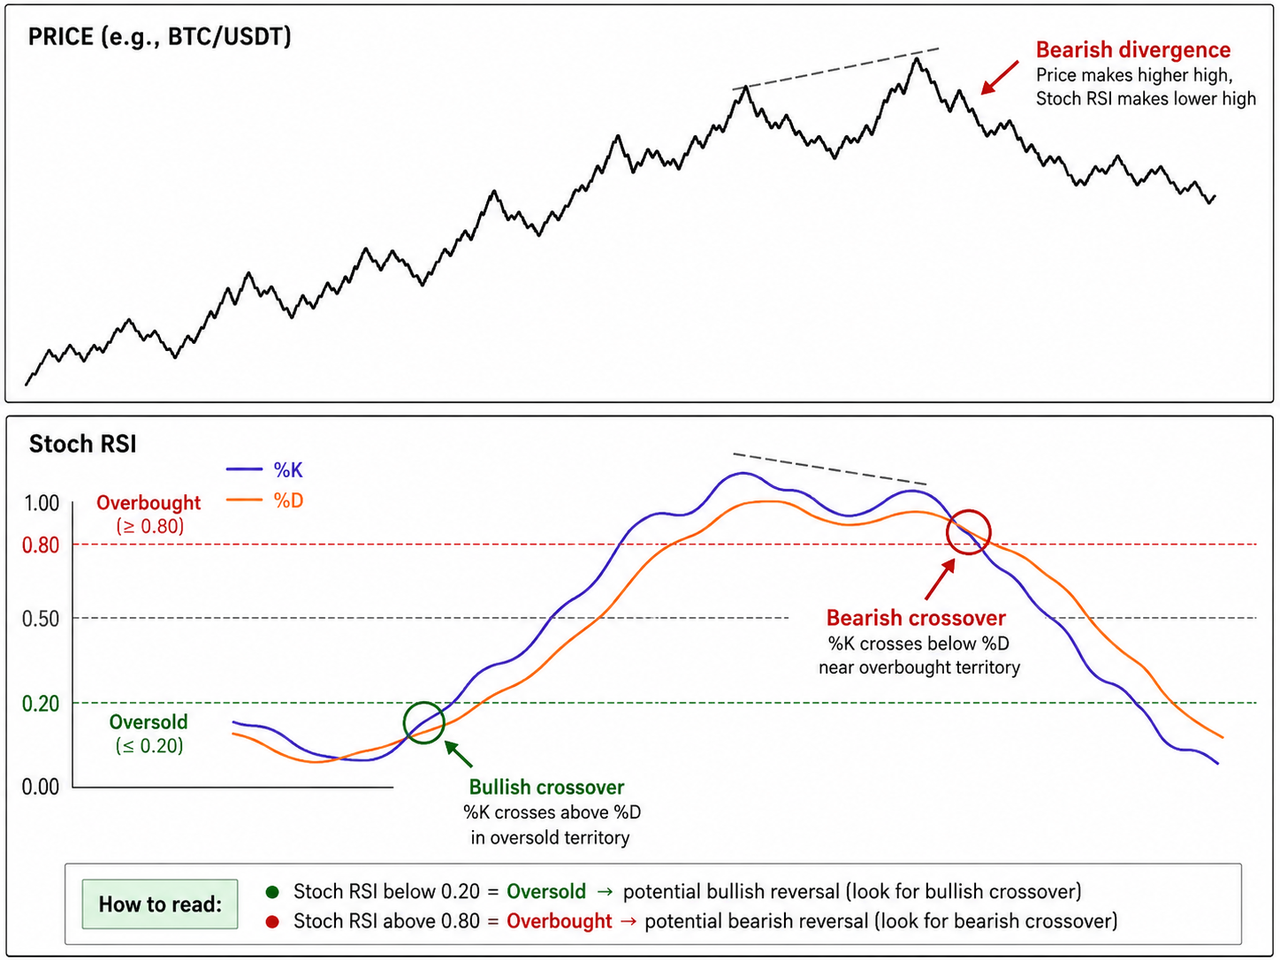
The commonly used overbought and oversold levels are 0.80 and 0.20, or 80 and 20 on charting platforms using a 0-to-100 scale.
-
Crossovers, divergence, trend lines, and price patterns can help confirm signals, but no overbought or oversold reading guarantees a reversal.
-
Stochastic RSI is highly responsive, making it useful for short-term timing but less reliable when used alone in trending markets.
What Is the Stochastic RSI Indicator?
The Stochastic RSI indicator, or StochRSI, is a momentum oscillator that measures how close the current RSI is to the highest or lowest low RSI recorded over a selected number of periods. It combines the logic of the stochastic oscillator with the Relative Strength Index.
Standard RSI measures the balance between average gains and losses. StochRSI measures RSI relative to its own recent range. This extra step makes the indicator more sensitive than RSI and causes it to reach extreme levels more frequently.
Tushar Chande and Stanley Kroll introduced StochRSI in The New Technical Trader in 1994. Chande and Kroll developed StochRSI because conventional RSI could remain between its traditional thresholds for long periods without generating frequent overbought and oversold signals.
StochRSI should not be confused with the traditional stochastic indicator. The stochastic oscillator compares a closing price with the recent high-low range of the underlying security. StochRSI compares the current RSI with the recent range of RSI values.
How Is Stochastic RSI Calculated?
The stochastic calculation determines where RSI sits between its highest and lowest values over a specified period.
The Stochastic oscillator formula applied to RSI is:
StochRSI = [Current RSI − Minimum RSI] ÷ [Maximum RSI − Minimum RSI]
A common configuration uses:
-
An RSI length of 14 periods
-
A StochRSI look-back of 14 periods
-
Three-period smoothing for %K
-
Three-period smoothing for %D
StochRSI equals 0 when the current RSI is at the lowest point in the selected period. It equals 1 when RSI reaches the highest point. Most charting platforms display the result from 0 to 1, although some charting platforms multiply it by 100.
Suppose the current RSI is 55, the minimum RSI is 35, and the maximum RSI is 60:
StochRSI = (55 − 35) ÷ (60 − 35) = 0.80
The result indicates that RSI is near the top of its recent range. It does not mean the actual price rose by 80% or that an immediate sell signal has appeared.
What Do Overbought and Oversold Levels Mean?
The standard overbought levels and oversold levels are 0.80 and 0.20. These limits are often clearer than the RSI Relative Strength Index thresholds of 70 and 30 because StochRSI regularly moves across its full range.
| StochRSI range |
Interpretation |
Momentum condition |
| Above 0.80 |
Overbought |
RSI is near its recent maximum |
| 0.50 to 0.80 |
Bullish |
Relative momentum is strengthening |
| Around 0.50 |
Neutral |
RSI sits near the middle of its range |
| 0.20 to 0.50 |
Bearish |
Relative momentum is weakening |
| Below 0.20 |
Oversold |
RSI is near its recent minimum |
An overbought or oversold reading describes the RSI position within its recent range, not whether the asset is fundamentally expensive or cheap. An overbought reading may remain elevated for extended periods during a strong uptrend, while an oversold reading can persist during a sustained decline.
For that reason, identifying overbought or oversold conditions does not automatically reveal buying or selling opportunities. StochRSI can remain overbought or oversold in trending markets, and extreme readings may support continuation rather than reversal.
What Are the %K and %D Lines?
The %K line is the faster component, while %D is usually a short moving average of %K. Their crossovers generate many of the indicator’s overbought and oversold signals.
A bullish crossover develops when %K rises above %D, particularly when both lines leave oversold territory. A bearish crossover appears when %K falls below %D near overbought territory.
Crossovers near 0.50 generally carry less information because neither momentum extreme is present. A bearish crossover above 0.80 is not automatically a sell signal, and a bullish crossover below 0.20 does not guarantee that selling pressure has ended.
How Does StochRSI Identify Potential Reversals?
StochRSI measures short-term changes in RSI momentum, allowing it to turn before slower technical indicators respond.
Common signals include:
-
Oversold crossover: %K moves above %D below 0.20.
-
Overbought crossover: %K moves below %D above 0.80.
-
Centerline recovery: StochRSI moves above 0.50 after an oversold reading.
-
Centerline rejection: StochRSI fails near 0.50 and falls again.
-
Divergence: The indicator and price action form opposing patterns.
Bullish divergence occurs when price forms a lower low while StochRSI forms a higher low. Bearish divergence occurs when price forms a higher high while the indicator forms a lower high. Bullish divergence and bearish divergence can warn of potential trend reversals, but they may fail during strong directional moves.
Trend lines and chart patterns can improve interpretation. If a chart shows bullish divergence near established support, the signal may carry more weight than an isolated oscillator crossover.
Stochastic RSI vs. RSI and Other Indicators
Stochastic RSI produces quicker signals than RSI but also reacts to smaller fluctuations.
| Feature |
Stochastic RSI |
Standard RSI |
| Input |
Relative Strength Index values |
Price gains and losses |
| Speed |
Faster |
Slower |
| Extreme signals |
More frequent |
Less frequent |
| Primary use |
Reversal timing |
Broader momentum analysis |
| Main weakness |
Noise and false signals |
Delayed response |
Combining StochRSI with the MACD indicator can provide wider momentum context. A rising EMA 20 indicator may confirm trend direction, while the ADX indicator can show whether the market is strongly trending.
Volume-based tools such as the accumulation distribution line may also reveal whether buying or selling pressure supports the price move. Like many oscillators, StochRSI is more dependable when other indicators and price action confirm signals.
How Can Traders Use Stochastic RSI?
Stochastic RSI is often used in short-term trading strategies because it reacts quickly to momentum changes. Scalpers and day traders may use it to identify rapid shifts, while swing trading strategies may apply it to time pullbacks within a broader trend.
A strategy might require a bullish crossover below 0.20 while price remains above a rising moving average. Another approach may accept oversold signals only when the SuperTrend indicator remains bullish.
Similar rules can be evaluated in the spot market or incorporated into indicator-based trading bots. Every approach still requires risk limits, position sizing, and confirmation from chart patterns.
What Are the Limitations of Stochastic RSI?
StochRSI can produce bad signals because it calculates an oscillator from another technical indicator rather than directly from price. This increases responsiveness but magnifies market noise.
The indicator does not measure volume, liquidity, volatility, or fundamental value. It can also move rapidly between overbought and oversold conditions during sideways markets. Shorter settings create more signals, while a longer number of periods reduces noise but delays entries.
No Stochastic RSI crossover, divergence, or extreme reading guarantees profitable results. The indicator supports technical analysis and does not constitute investment advice.
Conclusion
The Stochastic RSI indicator locates the current RSI within its recent high-low range to highlight overbought and oversold conditions, crossovers, and potential trend reversals. Its responsiveness can support short-term timing, but frequent false signals make confirmation from price patterns, trend direction, and other indicators essential.
FAQ
What is the standard Stochastic RSI setting?
A common setting is 14 periods for RSI, 14 periods for the StochRSI range, and three-period smoothing for both %K and %D. Settings vary by platform and trading timeframe.
Is Stochastic RSI better than RSI?
Neither indicator is universally better. Stochastic RSI reacts faster and produces more signals, while standard RSI provides a smoother view of momentum.
What does Stochastic RSI above 80 mean?
A reading above 80 means RSI is near the upper end of its recent range. It indicates strong relative momentum rather than a guaranteed price decline.
What does Stochastic RSI below 20 mean?
A reading below 20 places RSI near the bottom of its recent range. Price may remain weak, so an oversold reading alone does not confirm a recovery.
What is a bullish Stochastic RSI crossover?
A bullish crossover occurs when the faster %K line moves above the %D line. The signal may carry more weight when both lines are leaving the oversold zone.
Can Stochastic RSI be used for cryptocurrency trading?
Yes. Stochastic RSI can be applied across cryptocurrency markets and timeframes, but higher volatility may increase noise and false crossovers.







