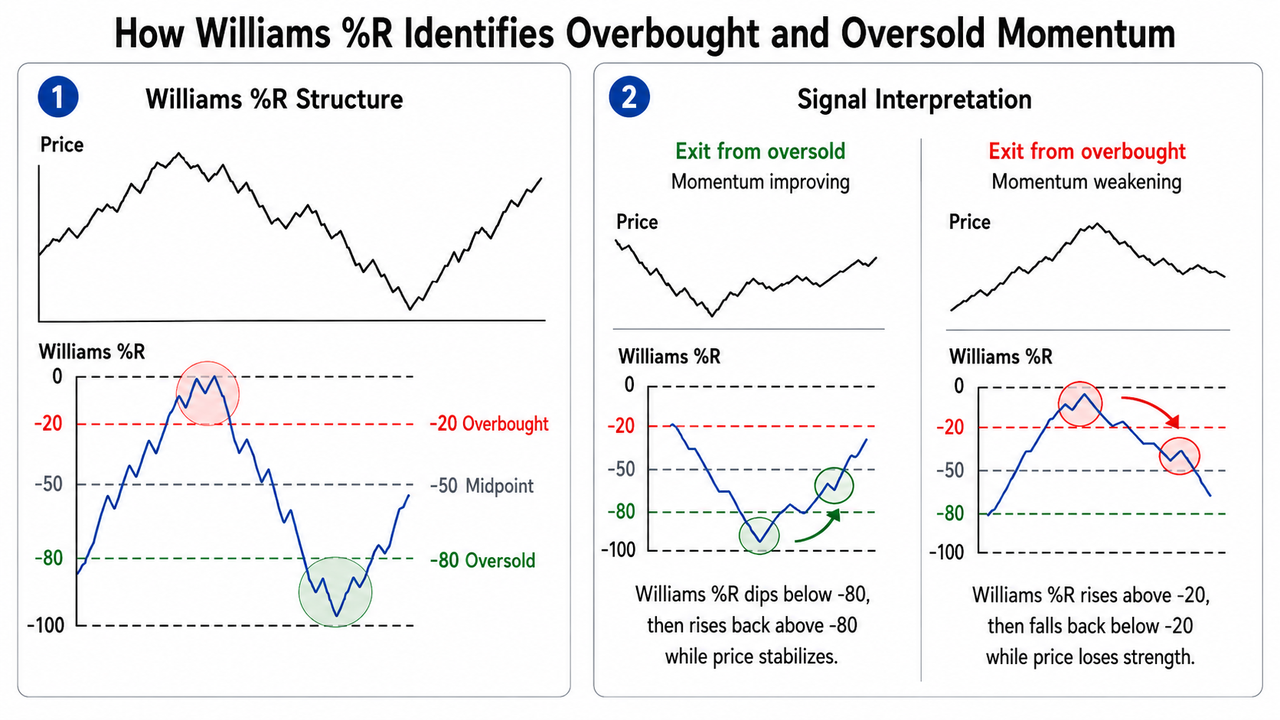
The Williams %R indicator is a momentum oscillator developed by Larry Williams that shows where the current closing price sits within the recent high-low range. It moves between 0 and -100, with readings above -20 commonly treated as overbought and readings below -80 as oversold. Its main value is timing: Williams %R can reveal when momentum is becoming stretched or shifting near potential reversal points.
For traders trying to identify overbought and oversold conditions, especially in crypto's fast-moving markets, Williams %R is straightforward but easy to misuse. An extreme reading isn't automatically a buy or sell signal. The useful part is understanding where the reading occurs within the broader market context, whether the indicator is leaving an extreme zone, and whether price action or other technical analysis tools confirm the momentum shift.
Key Takeaways
Williams %R measures the current close relative to the highest high and lowest low over a specified period, commonly 14 periods.
It oscillates from 0 to -100; above -20 indicates overbought conditions, while below -80 suggests oversold conditions.
Traders often pay more attention to Williams %R exiting an extreme zone than simply entering one.
A move above -50 places price in the upper half of its recent range, while a move below -50 places it in the lower half.
Strong trending markets can keep the indicator overbought or oversold for extended periods, so confirmation from trend analysis, price structure, or complementary indicators matters.
What Is the Williams %R Indicator?
Williams %R, also called the Williams Percent Range indicator, belongs to the family of momentum oscillators. Instead of measuring how far price itself has moved, it asks a different question: Where did the market close relative to its recent trading range?
Suppose Bitcoin's highest price during the look-back period is $70,000 and its lowest is $60,000. A closing price near $70,000 pushes Williams %R toward 0, indicating that buyers are closing price near the top of the range. A close near $60,000 pushes the reading toward -100.
That makes Williams %R particularly useful for identifying momentum extremes. Gate Learn's broader overview of momentum oscillators groups Williams %R with technical indicators designed to assess the strength and position of recent price movements rather than simply identify the current trend.
It is also closely related to the Stochastic Oscillator. Both compare the current closing price with a recent high-low range, although they express that relationship on different scales.
How Is Williams %R Calculated in Technical Analysis?
The standard Williams %R calculation is:
Williams %R = -100 × (Highest High − Current Close) / (Highest High − Lowest Low)
Where:
Highest High is the highest price reached during the look-back period.
Lowest Low is the lowest price reached during that period.
Current Close is the latest closing price.
A 14-period look-back is the conventional default, although traders can change the setting depending on their trading style and timeframe.
Imagine an asset has a 14-period high of $120, a low of $100, and a current closing price of $116:
Williams %R = -100 × (120 − 116) / (120 − 100)
= -20
The current price is therefore very close to the upper end of its recent range and has reached the conventional overbought threshold.
The calculation also explains why the scale can initially look unusual. Unlike the Relative Strength Index, which runs from 0 to 100, Williams %R uses a negative scale from 0 to -100. The basic interpretation becomes simple once that inversion is understood.
How Does Williams %R Identify Overbought and Oversold Conditions?
Three zones matter most:
Williams %R Reading
Common Interpretation
0 to -20
Overbought territory
Around -50
Middle of recent range
-80 to -100
Oversold territory
A reading above -20 means the closing price sits near the top of the high-low range. That suggests strong recent price momentum, but it doesn't guarantee a price decline.
Likewise, Williams %R below -80 indicates that the market is closing near the bottom of its recent range. That is an oversold reading, not proof that price is about to rise.
The distinction matters most in trending markets. During a strong uptrend, Williams %R can remain in overbought territory through several candles while price continues higher. During a persistent price decline, it may remain oversold for an extended period.
This is why entering an extreme zone doesn't automatically generate a trading signal.
In practice, traders often watch for the indicator to leave that zone. A move upward through -80 after an oversold reading can suggest improving momentum. A move downward through -20 after an overbought reading can indicate that bullish momentum is weakening.
What Does the -50 Level Say About Market Conditions?
The -50 line provides useful information even though it receives less attention than the overbought and oversold levels.
A Williams %R reading above -50 means the current closing price is in the upper half of the selected high-low range. Below -50 means it is in the lower half.
Repeated movement above -50 during a rising market can support bullish trend confirmation. Repeated failures to remain above it can indicate weakening momentum.
That doesn't turn Williams %R into a full trend indicator. Tools designed specifically for trend identification, such as MACD, analyze market structure differently. Williams %R remains primarily a price-position and momentum indicator.
Williams %R Trading Signals: Extremes, Divergence, and Momentum Shifts
Leaving Overbought or Oversold Territory
One common approach waits for the oscillator to leave an extreme zone rather than trying to predict exactly when price will reverse.
For example, Williams %R might fall to -94 during a sell-off. Instead of assuming that -94 itself is a bullish signal, a trader may wait until the indicator climbs back above the -80 oversold threshold while price also begins forming higher lows.
The same logic applies in reverse when Williams %R falls below -20 after an extended overbought reading.
Bullish and Bearish Divergence
Divergence signals compare price movements with indicator momentum.
A bullish divergence can occur when price records a lower low but Williams %R forms a higher low. The price decline is continuing, yet downside momentum appears weaker.
A bearish divergence appears when price makes a higher high while Williams %R makes a lower high. That can point to weakening momentum behind the price advance.
Neither pattern guarantees potential trend reversals. Divergence can persist, especially in volatile markets.
Using Price Action for Confirmation
Williams %R becomes more useful when the signal agrees with market structure.
For example, a trader watching the BTC/USDT market on Gate.com might see Williams %R rise above -80 after an oversold reading. If BTC is simultaneously holding support and forming higher lows, the combination provides more context than the oscillator reading alone.
That doesn't remove trading risk. It simply avoids treating one technical indicator as a complete market analysis system.
Williams %R vs. RSI: Which Reacts Faster?
Williams %R and RSI both identify overbought and oversold conditions, but they measure momentum differently.
Williams %R calculates where the current close sits within a recent high-low range. RSI measures the magnitude of recent gains relative to recent losses and applies smoothing. As a result, Williams %R can react more sharply to changes in the closing price, while RSI often produces a smoother momentum reading.
The scales are also different:
Feature
Williams %R
RSI
Scale
0 to -100
0 to 100
Common overbought level
Above -20
Above 70
Common oversold level
Below -80
Below 30
Main focus
Close within recent price range
Strength of gains vs. losses
Typical behavior
More responsive
Smoother
The RSI and Stochastic RSI comparison also shows why responsiveness comes with a tradeoff: faster momentum tools can identify momentum shifts earlier but may generate more noise.
Using Williams %R with RSI can therefore provide complementary information, but two oscillators agreeing doesn't automatically confirm a trade. They may be reacting to the same underlying price movements.
When Does Williams %R Generate False Signals?
The biggest weakness of Williams %R appears in strong trending markets.
During a powerful rally, repeated overbought readings may look like exit signals even while the current trend remains intact. In a sustained decline, oversold signals can appear repeatedly as price continues lower.
Shorter look-back periods make the indicator more sensitive, which can increase false signals in choppy markets. Longer settings generally smooth some noise but may react more slowly to momentum shifts.
Range-bound markets can be better suited to conventional overbought and oversold trading strategies because price is already rotating between identifiable highs and lows. Even then, sudden breakouts can invalidate the previous range.
Using Williams %R alongside support and resistance, volume, trend indicators, or tools such as the ADX indicator can help traders distinguish a sideways market from a strong directional trend.
Conclusion
The Williams %R indicator measures where the current closing price sits within a recent high-low range, giving traders a simple way to assess price momentum and identify overbought and oversold conditions.
Its conventional 14-period setting produces readings between 0 and -100, with -20 and -80 serving as the main extreme levels. But an overbought reading doesn't mean price must fall, and an oversold reading doesn't mean it must rise. The more useful clues often appear when Williams %R exits an extreme zone, crosses the -50 midpoint, diverges from price, or confirms a change already visible in price action.
Williams %R can be valuable for reversal timing, particularly in range-bound markets, but strong trends can keep it at extreme levels far longer than expected. For that reason, traders generally get more context by combining it with trend identification, market structure, and other technical analysis tools rather than relying on Williams %R alone.
FAQ
What is the Williams %R indicator?
Williams %R is a momentum indicator developed by Larry Williams that measures the current closing price relative to the highest high and lowest low over a chosen look-back period. It oscillates between 0 and -100.
What is the best setting for Williams %R?
The traditional setting is 14 periods, and it remains a common default. Shorter settings respond faster but can produce more noise, while longer periods tend to be smoother and slower.
What does a Williams %R reading above -20 mean?
A reading above -20 indicates that the current closing price is near the top of its recent range and is conventionally classified as overbought. It isn't automatically a sell or exit signal.
What does Williams %R below -80 mean?
Williams %R below -80 indicates oversold territory, meaning price is closing near the bottom of the recent range. Traders may watch for the oscillator to move back above -80 and then assess whether price action supports a potential reversal.
Is Williams %R better than RSI?
Neither indicator is universally better. Williams %R tends to react more quickly to where price closes within its recent range, while RSI provides a smoother assessment of the strength of recent gains and losses. The better fit depends on market conditions, timeframe, trading strategy, and tolerance for false signals.
Can Williams %R remain overbought or oversold for a long time?
Yes. In strong trending markets, Williams %R can remain above -20 or below -80 for extended periods. That behavior is one reason traders usually confirm reversal signals with broader market context and other indicators.
Disclaimer:Technical indicators are based on historical price data and cannot predict future market movements with certainty. Williams %R signals should be interpreted within broader market conditions and an appropriate risk-management framework.
Author: Jared
Disclaimer
* The information is not intended to be and does not constitute financial advice or any other recommendation of any sort offered or endorsed by Gate.
* This article may not be reproduced, transmitted or copied without referencing Gate. Contravention is an infringement of Copyright Act and may be subject to legal action.
DEX aggregators integrate order data, price information, and liquidity pools from multiple decentralized exchanges, helping users find the optimal trading path in the shortest time. This article delves into 8 commonly used DEX aggregators, highlighting their unique features and routing algorithms.
The report shows that in Q1 2026, the crypto market will reach a stage of structural maturity, with Derivative trading making up more than 90% of total trading volume, exceeding $20 trillion. As Spot demand weakens, liquidity will become even more concentrated in top exchanges, reflecting a more cautious market sentiment and a shift toward leveraged and institutional trading.