The ROC indicator calculates momentum by comparing the current price with the price recorded “n” periods ago, while disregarding the price action that occurred between those two points. Positive readings reflect rising price momentum, whereas negative values point to falling momentum. Because the calculation relies on historical data, ROC has an inherent lagging nature. Applying an exponential moving average can reduce some of the noise by assigning greater weight to the current period and making changes in acceleration or weakening momentum easier to interpret.
TL;DR
-
The Rate of Change ROC indicator measures percentage price change over a given period.
-
ROC readings above the zero line indicate bullish momentum, while readings below zero indicate bearish momentum.
-
Rising ROC values suggest that a trend is gaining momentum, while falling values may indicate weakening momentum.
-
Extreme ROC values can help identify overbought and oversold conditions, but the indicator has no universal upper and lower bounds.
-
ROC can generate false signals in volatile, choppy, or range-bound markets, so traders often combine ROC with other technical analysis tools.
What Is the ROC Indicator?
The ROC indicator is a momentum indicator used in technical analysis to evaluate how quickly price movements are changing. It compares the current price with the price n periods ago and expresses the difference as a percentage.
Unlike the Relative Strength Index, which moves between fixed overbought and oversold levels, ROC has no predefined upper and lower bounds. Its values can rise or fall as far as market volatility allows.
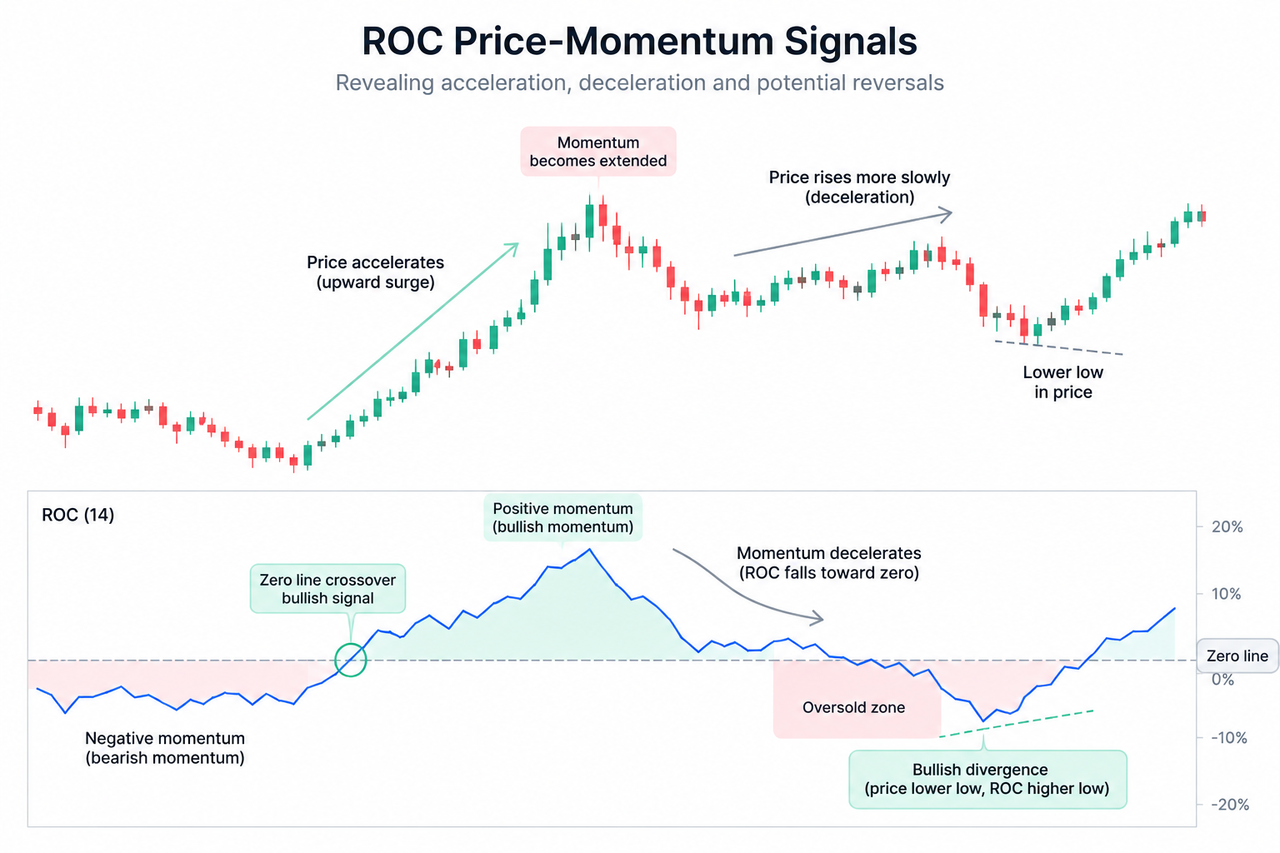
ROC values oscillate above and below a central zero line. A positive ROC shows that the current closing price is higher than the earlier comparison price. A negative ROC means the current price is lower.
Because ROC measures price velocity, it can reveal whether a bullish trend or bearish move is strengthening before the change becomes obvious on the price chart.
How the Rate of Change Indicator Measures Price Momentum
The ROC calculation compares the current closing price with the closing price recorded a specified number of periods ago:
ROC = [(Current Price − Price n Periods Ago) ÷ Price n Periods Ago] × 100
Suppose an asset trades at $108 after closing at $100 ten periods ago:
ROC = [($108 − $100) ÷ $100] × 100 = 8%
The positive ROC reading shows an 8% price change over the given period. If the current price were $92, the result would be −8%, placing ROC in negative territory.
A 10-day example in which price rises from $65 to $70 produces a ROC of approximately 7.69%:
ROC = [($70 − $65) ÷ $65] × 100 = 7.69%
The default lookback period is often 12 or 14 periods, although charting platforms may use different settings. Traders adjust the period to match their trading strategies. Shorter settings react faster but appear noisier, while longer settings provide smoother trend confirmation but have a greater lagging nature.
How ROC Signals Bullish Momentum and Bearish Momentum
ROC readings above zero indicate that price has risen during the selected period. When ROC moves higher in positive territory, bullish momentum is accelerating. A sharp price advance or upward surge usually produces a steep rise in ROC.
Readings below zero indicate falling prices. When negative ROC values move farther below the zero line, bearish momentum is increasing and the decline accelerates. A steep price decline or downward plunge can therefore create extreme negative readings.
Direction matters as much as position:
-
A rising positive ROC suggests strong momentum.
-
A falling positive ROC may signal a weakening trend.
-
A declining negative ROC indicates increasing bearish momentum.
-
A rising negative ROC suggests that selling pressure is weakening.
ROC indicates trend strength by showing whether momentum is accelerating or decelerating. However, it does not measure trend direction as smoothly as moving averages, which are designed to filter short-term price fluctuations.
Can Zero Line Crossovers Signal Trend Reversals?
Zero line crossovers can signal potential trend reversals, although they require confirmation.
When ROC moves above zero, the current price has exceeded its value from the selected lookback period. This can indicate a potential buy opportunity or the beginning of bullish momentum. When ROC moves below zero, the price has fallen below its earlier level, which may indicate bearish momentum.
These signals generated around the zero line work best when they align with broader price trends. A crossover above zero during an established bullish trend may be more reliable than one that appears in a sideways market.
Traders can apply several lookback settings to a BTC/USDT spot chart and compare how zero line crossovers behaved during earlier trends, consolidations, and reversals.
Identifying Overbought and Oversold Conditions with ROC
ROC can help identify overbought and oversold conditions through extreme values, but it does not have fixed thresholds.
Some traders treat ROC values above +10% as a possible overbought condition and values below −10% as a possible oversold condition. These levels are examples rather than universal rules. Different assets have unique overbought and oversold thresholds because their normal price movements and market volatility differ.
An asset with low volatility may rarely reach +10% or −10%. A highly volatile cryptocurrency may cross those levels frequently without producing trend reversals.
For identifying overbought conditions, traders should compare current ROC values with the asset’s historical price data. The same approach applies to oversold zones and any proposed oversold boundary.
ROC can also remain overbought or oversold during strongly trending markets. A high positive reading may reflect genuine trend strength rather than an immediate reversal, while an extreme negative reading may persist as a steep decline continues.
How ROC Divergence May Reveal Weakening Momentum
Divergence between price movement and ROC may indicate a weakening trend.
A bullish divergence occurs when price forms a lower low while ROC forms a higher low. This divergence signal suggests that bearish momentum is fading even though price has continued downward.
A bearish divergence appears when price reaches a higher high while ROC forms a lower high. The new high is therefore supported by less price momentum, which may signal weakening momentum or a potential reversal.
Divergence does not confirm an immediate turning point. In strongly trending markets, price can continue moving in the same direction after divergence appears.
Comparing ROC with Other Momentum Indicators
Comparing ROC with other momentum indicators helps clarify what each technical tool measures.
| Indicator |
Main measurement |
Range |
Common use |
| ROC |
Percentage price change |
Unbounded |
Momentum acceleration |
| RSI |
Relative gains and losses |
0 to 100 |
Overbought and oversold |
| MACD |
Difference between moving averages |
Unbounded |
Trend and momentum shifts |
The Moving Average Convergence Divergence indicator uses moving averages to produce smoother momentum signals. ROC reacts directly to price change and may respond faster, but its lack of smoothing can make it noisy.
The RSI indicator provides fixed reference zones, while ROC requires asset-specific overbought and oversold levels. Traders comparing MACD vs. RSI for swing trading can use ROC as an additional measure of price velocity rather than as a replacement for either indicator.
Why the ROC Indicator Can Generate False Signals
ROC can generate false signals in volatile, sideways, and range-bound markets. Small fluctuations around the comparison price can cause repeated zero line crossovers, creating whipsaws without a lasting trend.
Its main limitations include:
-
No universal overbought and oversold thresholds
-
Sensitivity to sudden market volatility
-
Noise caused by the absence of built-in smoothing
-
Delayed reaction when longer lookback periods are used
-
Dependence on a single historical comparison price
-
Divergence signals that may appear too early
ROC is a lagging indicator because its calculation uses historical price data. Short settings reduce delay but generate more false signals, while long settings reduce noise but react more slowly to price changes.
Traders often combine ROC with trend, momentum, and volatility tools to confirm signals.
An EMA 20 indicator can show the short-term trend, while ROC indicates whether that trend is gaining momentum. The ADX indicator can help determine whether market trends are strong enough to support directional trading strategies.
Support and resistance, volume, price structure, and moving averages can also improve trend confirmation. No technical indicator can eliminate market risk, and ROC signals should not be treated as guaranteed trade instructions.
Conclusion
The ROC indicator measures the percentage change between the current price and the price recorded a chosen number of periods ago. Positive territory reflects bullish momentum, while negative territory reflects bearish momentum.
ROC can reveal acceleration, weakening momentum, divergence, zero line crossovers, and extreme price movements. Its signals are most useful when traders compare ROC with historical levels and confirm signals using other technical analysis tools.
FAQ
What does the ROC indicator measure?
The ROC indicator measures percentage price change over a specified period. It shows whether price momentum is positive, negative, accelerating, or weakening.
What is the usual ROC setting?
A 12-period or 14-period lookback is common, but traders adjust the setting according to timeframe, asset volatility, and trading style.
Does positive ROC indicate bullish momentum?
Yes. Positive ROC indicates that the current price is above the price recorded n periods ago. Rising positive values suggest that bullish momentum is strengthening.
Can ROC identify overbought and oversold conditions?
ROC can highlight overbought or oversold conditions through extreme values, but it has no fixed thresholds. Levels such as +10% and −10% must be evaluated against each asset’s historical volatility.
Why does ROC generate false signals?
ROC generates false signals because it reacts directly to price changes without built-in smoothing. Volatile, choppy, and sideways markets can produce repeated crossovers and whipsaws.







