Using a scale from 0 to 100, the ADX indicator evaluates the strength of a market trend without showing whether the trend is bullish or bearish. It serves as a trend-strength filter for swing traders and cryptocurrency traders, helping them screen potential trade setups, reduce exposure to choppy markets, and prioritize opportunities supported by stronger directional movement.
Abstract
-
The ADX indicator measures trend strength on a scale that normally ranges from 0 to 100.
-
A rising ADX suggests that the current trend is strengthening, whether price is moving upward or downward.
-
The +DI and -DI lines provide directional context that the main ADX line does not show.
-
ADX readings should be interpreted as zones rather than precise entry or exit commands.
-
Trend direction, price structure, volatility, and confirmation indicators remain necessary because ADX can lag or strengthen after much of a move has occurred.
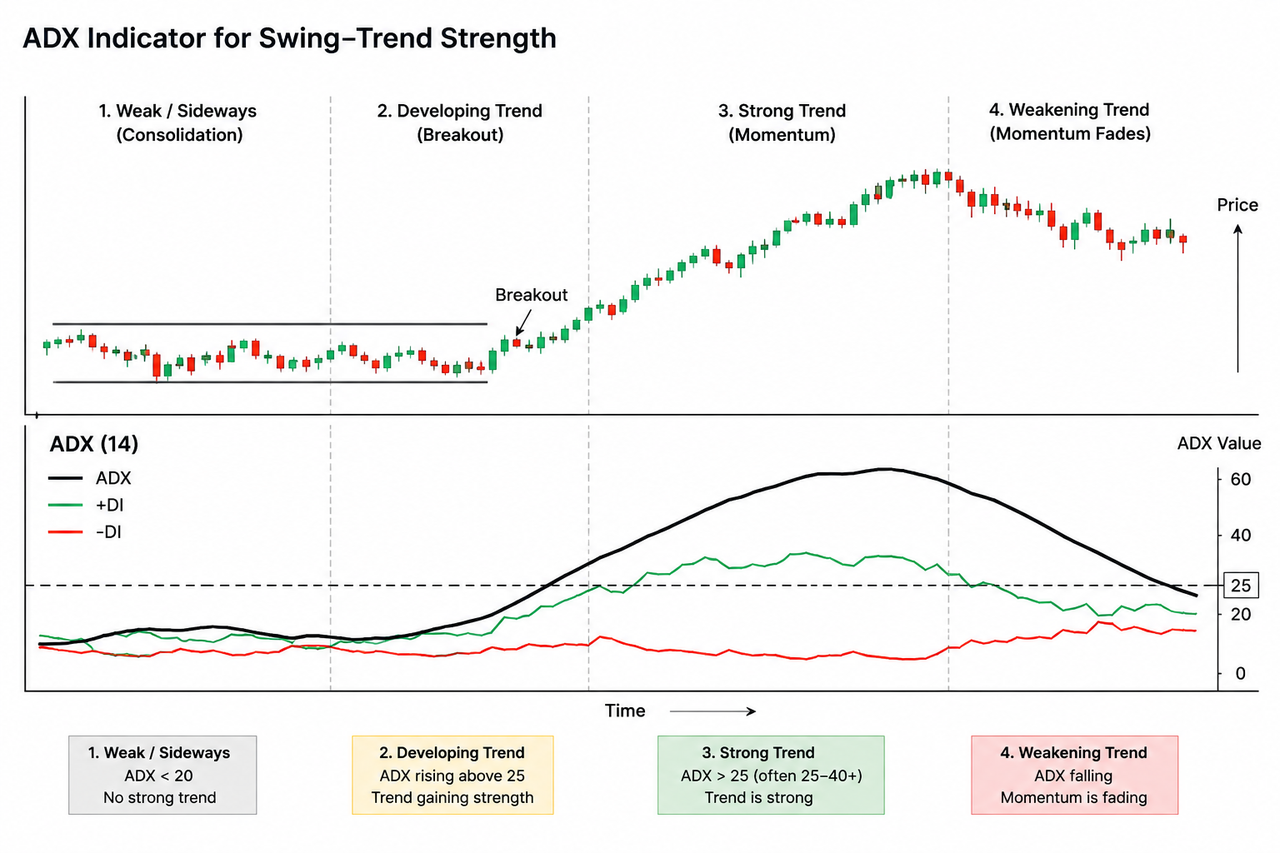
What Is the ADX Indicator?
The Average Directional Index (ADX), or average directional index adx, is a component of the Directional Movement Index developed to quantify how strongly price is moving in a consistent direction. The Average Directional Index is a technical indicator used in technical analysis by technical analysts to assess trend strength from price data. It belongs to the Directional Movement System, which normally contains three lines:
-
ADX: Measures the strength of the current trend.
-
Positive Directional Indicator (+DI): Represents positive directional movement.
-
Negative Directional Indicator (-DI): Represents negative directional movement.
Together, the +DI and -DI lines are also referred to as the directional movement indicator set.
The main ADX line does not identify direction. A high reading can appear during either a powerful rally or a sharp decline. Directional context comes from the relationship between +DI and -DI, as well as the price chart itself.
This distinction separates ADX from tools such as the EMA 20 indicator, which directly reflects the direction and changing average of recent prices. ADX instead answers a narrower question: is the market moving with enough directional strength to support a trend-following approach?
How Does the ADX Indicator Measure Trend Strength?
ADX calculation begins by comparing the current period’s high and low with those of the previous period. These comparisons produce positive and negative directional movement values.
The process can be summarized in four stages:
-
Measure directional movement. In directional movement DM, an increase in the current high may create plus directional movement, while a decrease in the current low may create negative directional movement.
-
Adjust for volatility. Directional movement is compared with the Average True Range so that the calculation accounts for the asset’s trading range.
-
Calculate +DI and -DI. The smoothed directional values are converted into positive and negative directional indicators, where +DI is calculated as (Smoothed +DM / ATR) * 100 and -DI is calculated as (Smoothed -DM / ATR) * 100.
-
Calculate ADX. DX is calculated as (|+DI - -DI| / |+DI + -DI|) * 100, and the ADX is the smoothed version of that value.
The first ADX value is the average of the first 14 DX values, and Wilder smoothing is then used for subsequent ADX values.
Many charting platforms use 14 periods as the default setting. On a daily chart, this generally means the latest 14 daily candles; on a four-hour chart, it refers to 14 four-hour candles.
Traders do not usually calculate the values calculated from price data manually. Understanding the structure still matters because it explains why ADX reacts to both directional consistency and volatility rather than to price direction alone.
How Should Swing Traders Read ADX Values?
ADX readings work best as broad strength zones rather than rigid boundaries. Different markets and timeframes can produce different normal ranges.
| ADX range |
Typical interpretation |
Practical meaning |
| Below 20 |
Weak or absent trend |
This often reflects a sideways market or a ranging market, so traders usually avoid new trend-following positions and consider range-bound strategies instead |
| 20 to 25 |
Trend may be developing |
Watch for confirmation from price structure and directional lines |
| 25 to 40 |
Established trend |
Readings above 25 can confirm a clear trend when DI crossover signals are aligned |
| Above 40 |
Strong or extended trend |
Momentum is powerful, but the move may already be mature |
The slope of ADX often matters more than a single number. A rise from 17 to 23 may show more useful improvement than a decline from 42 to 35. The first situation indicates ADX rising and a strengthening trend, while the second suggests that an established trend is losing intensity.
A falling ADX does not automatically mean that price will reverse. It means the existing directional movement is weakening, which points to weakening trend strength rather than reversal alone. Price could reverse, consolidate, or continue moving at a slower pace.
How Do +DI and -DI Show Trend Direction?
The directional lines add context to the ADX reading. When +DI is above -DI, positive directional movement has recently been stronger. When -DI is above +DI, negative directional movement has been stronger. These DI relationships become more actionable in trending conditions, but they can turn into misleading signals during low volatility consolidation.
A basic interpretation framework is:
-
+DI above -DI with rising ADX: This points to a strong uptrend when +DI holds above -DI and ADX is above 25.
-
-DI above +DI with rising ADX: This points to a strong downtrend when -DI holds above +DI and ADX is above 25.
-
Frequent DI crossovers with low ADX: Price is likely moving without a stable trend.
-
Wide DI separation with high ADX: Directional movement is strong, although the trend may already be extended.
These +DI/-DI changes are often called crossover signals, and a move by -DI above +DI can act as a sell signal when the broader trend is confirmed.
DI crossovers should not be treated as automatic trade signals. Crossovers can occur repeatedly during choppy conditions, particularly when ADX remains low. Price structure should first confirm whether the market is forming higher highs and higher lows, or lower highs and lower lows.
How Can Swing Traders Use ADX in Trading Strategies?
Swing traders can use ADX as a market-condition filter before evaluating entries, and this trading strategy framework can be adapted to different market conditions and trading styles across stocks, forex, and cryptocurrencies. The indicator is most useful when it improves trading decisions by showing whether conditions favor an ongoing trend or a non-trending environment, helping traders judge if a trend-following strategy suits the current setup.
Confirming a Breakout
A price breakout accompanied by rising ADX carries stronger evidence of expanding directional participation, but breakout traders often use other indicators to confirm ADX signals rather than relying on ADX alone. A breakout with flat or falling ADX may lack enough momentum to continue, so traders often check volume or similar tools to filter signals and reduce false starts.
ADX cannot confirm whether the breakout level itself is valid. Volume, candle closes, volatility, and nearby support or resistance still require evaluation, and traders should confirm ADX signals with other technical indicators before treating the breakout as valid.
Filtering Pullback Setups
During an established trend, a controlled pullback may offer a more structured setup than chasing price. ADX can help determine whether the broader trend retains strength while price temporarily retraces.
A rising moving average or orderly Moving Average Ribbon indicator can show direction and alignment, while ADX measures the strength supporting that structure. Another common companion is the relative strength index, which can help identify overbought territory during a strong move while ADX shows whether trend strength remains intact. Using ADX with these tools can reduce false signals and improve entry and exit points on pullbacks.
Avoiding Sideways Conditions
Low ADX readings can warn that trend-following entries face a difficult environment. During consolidation, moving-average crossovers, DI crossovers, and breakout attempts may produce repeated false signals. Low ADX often reflects a sideways market with no clear trend, so trend-following entries are usually lower quality. Many traders also avoid intraday trading breakouts here unless the market shifts out of the range.
The Aroon indicator provides a related but different perspective by measuring how recently price recorded a high or low within the chosen period. Combining the two can help distinguish an emerging directional structure from a market that remains range-bound. In that phase, range-bound tools are often more useful than ADX-driven trend entries until trending markets begin to reappear.
Managing an Existing Trend
A declining ADX can alert traders that directional momentum is fading. It can also warn of potential trend reversals or a loss of momentum, though not a confirmed reversal on its own. It does not provide an exact exit point, but it may justify tighter risk controls or closer attention to price structure, and some traders take partial profits as it weakens rather than fully exiting immediately.
Tools such as the Parabolic SAR indicator focus more directly on entry and exit signals and practical exit signals for trailing trend changes, while ADX remains a trend-strength confirmation tool. ADX instead shows whether the force behind the movement is expanding or contracting.
ADX Indicator vs MACD
ADX and MACD answer different technical questions. ADX measures the strength of directional movement, while MACD evaluates the relationship between moving averages to show trend direction and momentum changes. MACD can also produce a bullish crossover that suggests momentum is turning up, while ADX helps judge whether that move has enough strength behind it.
| Factor |
ADX |
MACD |
| Primary purpose |
Trend-strength measurement |
Trend and momentum analysis |
| Direction shown |
Not by the ADX line alone |
Yes, through line position and crossovers |
| Common supporting lines |
#NAME? |
MACD line, signal line, and histogram |
| Strongest use |
Filtering trending and sideways markets |
Tracking momentum shifts and trend changes |
| Main limitation |
Can lag and lacks standalone direction |
Can generate false crossovers in choppy markets |
The MACD indicator can provide directional and momentum context, while ADX helps assess whether the detected movement has meaningful trend strength. A moving average crossover or MACD signal is generally more useful when ADX confirms the market is already transitioning into a stronger trend. Agreement between the two does not guarantee continuation, but it reduces reliance on a single calculation.
What Are the Limitations of ADX and Potential False Signals?
ADX is a lagging indicator because it smooths historical directional movement. In other words, adx measures trend strength but not direction, so standalone adx signals can be incomplete. A trend may be well underway before ADX crosses a commonly watched threshold.
Other limitations include:
-
ADX may stay elevated after the strongest part of a move has passed.
-
Low readings do not predict the direction of the next breakout.
-
DI crossovers can become unreliable during consolidation, and choppy or volatile periods can create misleading signals.
-
Thresholds such as 20 or 25 do not fit every asset and timeframe.
-
Sudden volatility can temporarily increase directional measurements without creating a sustainable trend.
Combining ADX with price structure, support and resistance, volatility, and a directional tool such as the SuperTrend indicator creates a more complete framework. Used with other indicators, it can provide confirmation for entry and exit points and improve trading decisions. Traders should also define invalidation levels and position risk before entering a trade.
Technical indicators describe historical price behaviour. They do not guarantee future results or remove the risk of loss.
FAQs
Is a high ADX bullish or bearish?
A high ADX is neither inherently bullish nor bearish. It shows that directional movement is strong, while price structure and the +DI and -DI lines indicate whether buyers or sellers have greater directional control.
What ADX setting is commonly used?
A 14-period ADX is the common default on many charting platforms. Shorter settings react faster but may create more noise, while longer settings provide smoother readings with greater delay.
Is ADX above 25 always a strong trend?
ADX above 25 is commonly interpreted as an established trend, but it is more meaningful when it appears with adx crossovers in the directional lines rather than as an isolated reading. The asset, timeframe, volatility, ADX slope, and price structure should determine whether the reading is meaningful.
Can ADX identify a trend reversal?
ADX can show that an existing trend is gaining or losing strength, but it cannot confirm a reversal by itself. A reversal requires directional evidence from price structure, support or resistance breaks, and other confirming tools.
Is ADX useful for cryptocurrency swing trading?
ADX can help cryptocurrency swing traders separate directional markets from unstable or sideways conditions. Crypto volatility can produce rapid changes, so ADX should be combined with price confirmation, risk limits, and timeframe analysis rather than used as an isolated signal.







