The MACD indicator is a technical analysis tool that measures trend direction and momentum by comparing two exponential moving averages. Swing traders and cryptocurrency investors use the MACD indicator to spot momentum shifts, confirm developing trends, and judge whether a price move is strengthening or weakening.
The main focus here is on how the MACD indicator works, how to read its main signals like line crossovers, zero-line moves, histogram changes, and divergence also how it differs from the SMA indicator, and where its limits show up in real trading. If you want better timing and clearer trend confirmation, MACD is useful because it can highlight changes in momentum before they are obvious in price alone, though its signals can lag and become less reliable in sideways markets.
TL;DR
-
The MACD indicator compares a faster exponential moving average with a slower one.
-
The standard MACD settings are 12, 26, and 9 periods.
-
Line crossovers, zero-line movement, and histogram changes can reveal momentum shifts.
-
Swing traders should interpret MACD alongside price structure rather than as a standalone entry signal.
-
MACD may produce late or false signals during volatile and range-bound conditions.
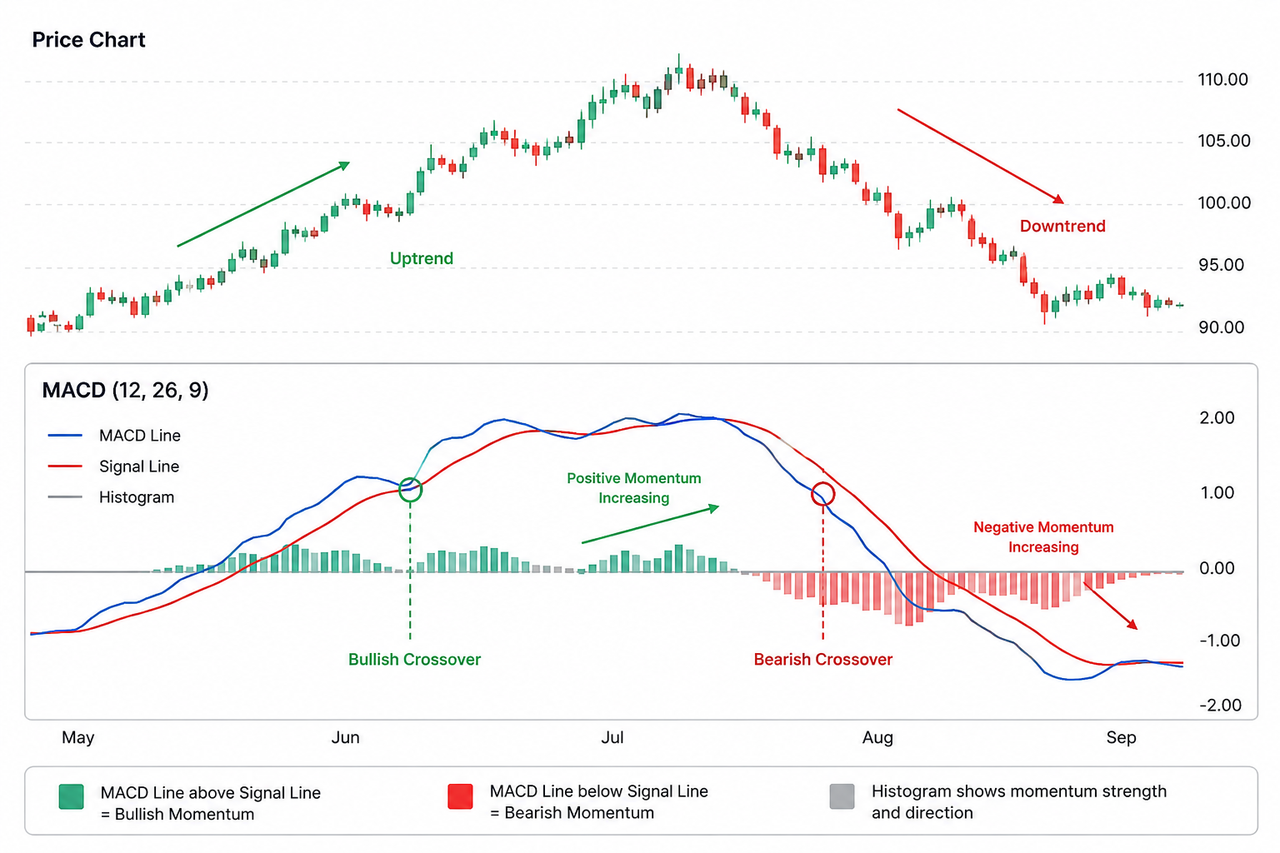
What Is the MACD Indicator?
MACD stands for Moving Average Convergence Divergence. Gerald Appel invented it in the 1970s. The average convergence divergence MACD indicator tracks the relationship between a short-term exponential moving average and a longer-term exponential moving average.
The standard MACD calculation uses:
-
A 12-period EMA as the faster average
-
A 26-period EMA as the slower average, or the longer moving average
-
A nine-period EMA of the MACD line as the period exponential moving average known as the macd signal line
The MACD line is calculated by subtracting the 26-period EMA from the 12-period EMA, and that subtraction produces the indicator’s value. The signal line smooths the MACD line, while the histogram displays the distance between the two lines, and both are plotted on the chart.
Because the calculation uses exponential moving averages, recent prices carry more weight than older prices. The underlying weighting method is examined more closely in the EMA 20 indicator, which focuses on short-term trend evaluation and pullbacks.
How Does the MACD Indicator Work?
The MACD indicator works across financial markets by showing whether short-term price momentum is moving faster or slower than the broader trend.
| MACD Component |
What It Shows |
| MACD line |
Difference between the fast and slow EMAs |
| Signal line |
Smoothed direction of the MACD line |
| Histogram |
Distance between the MACD and signal lines |
| Zero line |
Whether the fast EMA is above or below the slow EMA |
When the 12-period EMA rises above the 26-period EMA, the MACD line moves above zero. This generally indicates that shorter-term momentum is stronger than the longer-term trend. In practice, line crosses above the zero line can support a bullish interpretation, while moves below zero can support a bearish one. This helps traders interpret price movement more clearly. When the 12-period EMA falls below the 26-period EMA, the MACD line moves below zero and reflects weakening momentum.
The indicator does not directly measure how far price may rise or fall. It shows changes in the relationship between two moving averages derived from historical price data and price action.
How Do Swing Traders Read MACD Signals?
Swing traders commonly focus on crossovers, zero-line movement, histogram direction, and divergence across assets and timeframes. Traders apply MACD to stocks, forex, and cryptocurrencies on multiple timeframes.
MACD and Signal-Line Crossovers
A bullish signal line crossover occurs when the MACD line moves above the signal line. MACD line crosses above it can support a buy interpretation, while MACD crosses below it can support sell signals; on many charts, the blue line is the MACD and the red line is the signal line. A bearish crossover occurs when the MACD line falls below it, which may support a sell decision.
A crossover has more context when it agrees with the existing price structure. For example, a bullish crossover during an uptrend may support a continuation scenario if price remains above an important swing low. The same crossover inside a narrow trading range may have less significance.
Zero-Line Crossovers
A move above zero shows that the faster EMA has risen above the slower EMA. A move below zero shows that the faster EMA has fallen beneath the slower EMA.
Zero-line crossovers are usually slower than signal-line crossovers, but they may provide stronger trend confirmation because they reflect a broader change in moving-average alignment.
MACD Histogram Changes
The histogram is plotted as bars showing the distance between the MACD and signal lines. Growing bars indicate strengthening momentum, with rising positive bars suggesting stronger bullish pressure and expanding negative bars suggesting stronger bearish pressure.
Shrinking bars indicate weakening momentum. This does not automatically mean the trend will reverse. It may instead signal consolidation, a temporary pullback, or reduced directional strength. The MACD-Histogram is sometimes described as the fourth derivative of price.
MACD Divergence
MACD divergences occur when price and MACD move in different directions. A bearish divergence occurs when price records higher highs or a new high while MACD diverges and forms a lower high. A bullish divergence occurs when price makes a lower low while MACD fails to confirm with a new low.
Divergences can matter more near overbought or oversold conditions, especially around oversold conditions. Divergence can warn that momentum is weakening and signal a potential change in trend direction, but it does not identify an exact reversal point. Price may continue trending after divergence appears.
MACD vs SMA: What Is the Difference?
MACD evaluates the changing relationship between two exponential moving averages, while a simple moving average mainly shows the average price over a selected period.
| Factor |
MACD |
SMA |
| Main purpose |
Trend and momentum analysis |
Trend direction and smoothing |
| Calculation |
Difference between two EMAs |
Average of prices over a fixed period |
| Typical signal |
Crossovers, histogram shifts, divergence |
Price position, slope, and MA crossovers |
| Responsiveness |
More sensitive to recent changes |
Generally smoother and slower |
A long-period SMA indicator may help establish the broader trend, while MACD can show whether momentum is strengthening within that trend. The indicators serve different purposes and may be interpreted together without treating either one as confirmation by itself.
Limitations of the MACD Indicator
MACD is a lagging indicator because its calculations depend on historical prices. A crossover may appear only after a price move has already started. MACD can also generate repeated false crossovers when the market moves sideways or changes direction rapidly.
Its effectiveness depends on the selected timeframe, market structure, volatility, and settings. Shorter settings react faster but may create more noise. Longer settings produce smoother signals but respond later.
For this reason, swing traders commonly compare MACD with price structure, support and resistance, volume, broader market conditions, and other technical indicators such as the Relative Strength Index (RSI). Confirming signals this way can help assess a stock's momentum and reduce false signals. A signal should be treated as analytical evidence rather than a guaranteed trading outcome.
FAQ
Is MACD a trend or momentum indicator?
MACD is both a trend-following and momentum indicator. It evaluates trend direction through moving-average alignment and momentum through changes in the distance between its lines.
What are the standard MACD settings?
The standard MACD settings are 12, 26, and 9. These represent 12-period and 26-period exponential moving averages and a 9-period EMA of the MACD line. Traders may adjust them, but different settings change the indicator’s sensitivity.
Is a bullish MACD crossover a buy signal?
A bullish crossover shows improving momentum, but it is not automatically a buy signal. Its meaning depends on price structure, trend direction, volatility, and the trader’s risk framework.
Does MACD work in sideways markets?
MACD is generally less reliable in sideways markets. Frequent changes in direction can disrupt how closely the indicator tracks a stock's price, creating repeated crossovers that fail to develop into sustained trends, especially during fast price movement.
This content is provided for educational purposes only and does not constitute financial or investment advice. Technical indicators cannot predict market outcomes, and cryptocurrency trading involves substantial risk.







