For traders trying to distinguish ordinary price swings from unusually quiet or volatile market conditions, that difference can affect how risk is interpreted. ATR is especially useful when estimating volatility-adjusted stop distances, position size, or whether a move is large compared with recent price ranges. BBW is more useful for spotting volatility compression, a Bollinger Band squeeze, and subsequent volatility expansion. Understanding those roles helps avoid using one volatility indicator for a job it wasn’t designed to do, especially because neither ATR nor BBW predicts whether the next significant price move will be higher or lower.
It matters because ATR and BBW support different decisions. ATR helps with stop distance, position sizing, and risk, while BBW helps identify volatility compression and expansion. Knowing the difference reduces the risk of misreading volatility as a directional signal.
Key Takeaways
-
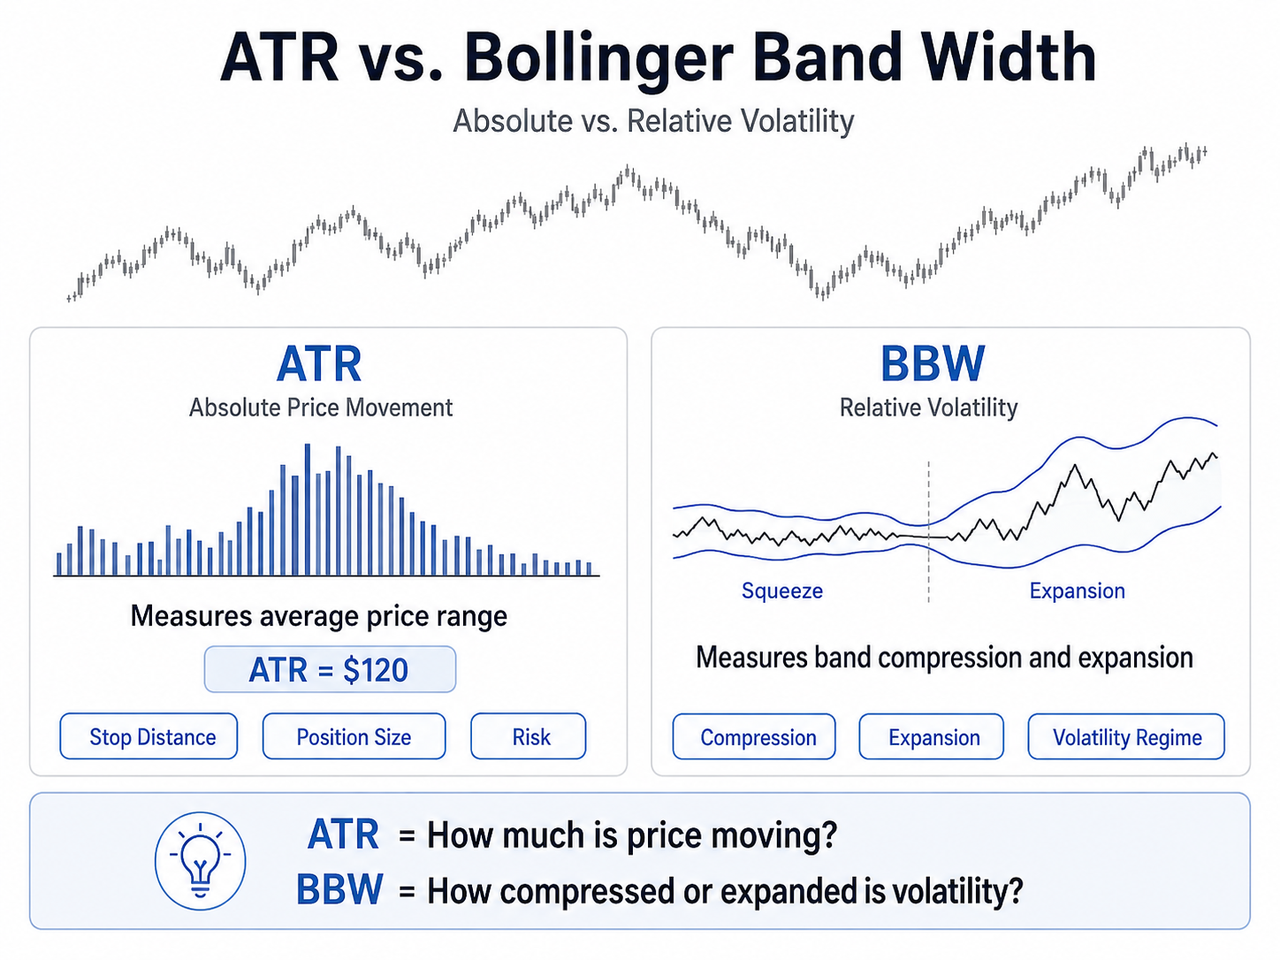
ATR measures actual price movement. Average True Range calculates the average true range over a selected lookback, commonly 14 periods, and reports volatility in the asset's price units.
-
Bollinger Band Width measures relative volatility. BBW compares the distance between the upper and lower Bollinger Bands with the middle band, making volatility easier to compare across differently priced assets.
-
ATR is generally more practical for risk management. Traders can use it to contextualize stop-loss distances, position size, price targets, and unusually large price swings.
-
BBW is particularly useful for volatility regimes. Contracting Bollinger Bands can reveal a squeeze, while rising BBW shows that volatility is expanding.
-
Neither high ATR nor widening bands provides future price direction. Trend, market structure, momentum, and trading volume still matter.
What Do Average True Range and Bollinger Bands Measure?
Average True Range (ATR), developed by J. Welles Wilder Jr., begins with the true range for each period. True range is the largest of three values: the current high minus the current low, the absolute difference between the current high and previous close, or the absolute difference between the current low and previous close.
ATR then smooths those true range values across a specified period. The commonly used 14-period setting therefore estimates the typical magnitude of recent price movement. The mechanics and interpretation are covered in more detail in the Average True Range ATR indicator.
On a daily BTC chart, for example, an ATR of $3,000 indicates that recent daily true ranges have averaged roughly $3,000. It doesn't mean Bitcoin will move exactly $3,000 tomorrow, and it says nothing about future price direction.
Bollinger Bands take a different route. Standard settings commonly use a 20-period simple moving average as the middle band, with an upper band two standard deviations above it and a lower band two standard deviations below it.
As recent price dispersion increases, the bands widen. When volatility falls, the bands contract.
Bollinger Band Width extracts that distance into a separate volatility measurement:
BBW = (Upper Band − Lower Band) / Middle Band
Some platforms show the result as a decimal, while others multiply it by 100 to produce a percentage. Because band distance is divided by the middle moving average, BBW is normalized instead of being expressed directly in dollars, euros, or token units.
The Bollinger Band Width indicator therefore isolates volatility expansion and contraction without requiring traders to judge band width visually.
ATR vs. Bollinger Bands: Absolute Range vs. Relative Dispersion
The simplest way to understand ATR vs. Bollinger Bands is to separate absolute movement from relative dispersion.
ATR measures an absolute value. If an asset has an ATR of $5, its recent true ranges average about $5. That figure can immediately feed into a volatility-adjusted stop or risk calculation.
The catch is that $5 means something very different for an asset priced at $20 and another priced at $2,000.
BBW solves much of that comparison problem by normalizing volatility to the middle band.
Suppose Asset A trades near $100 with upper and lower bands at $110 and $90:
BBW = ($110 − $90) / $100 = 20%
Asset B trades around $1,000 with bands at $1,100 and $900:
BBW = ($1,100 − $900) / $1,000 = 20%
Asset B's Bollinger Band spread is ten times larger in absolute price terms, yet both assets have the same 20% relative width.
That makes BBW useful when traders need to compare volatility across differently priced assets. Raw ATR readings are less suitable for that task unless ATR is normalized, such as by dividing ATR by current price to calculate ATR%.
This absolute-versus-relative distinction is also central to Bollinger Band Width vs. ATR volatility analysis: two indicators can both measure market volatility without measuring exactly the same property.
Average True Range ATR for Risk Management
ATR is strongest when a volatility measurement needs to become a concrete trading distance.
A trader might use a multiple of ATR to place a stop farther away than normal market noise. If ATR is $100, for example, a 1.5-ATR distance equals $150.
The multiplier isn't a universal rule. Suitable distances vary with timeframe, liquidity, market structure, strategy design, and acceptable risk. ATR simply provides an objective reference based on recent price ranges.
ATR can also help assess whether a price move is significant relative to recent market conditions. A candle moving several ATR units within a short period represents an unusually large move compared with the recent average.
That doesn't prove exhaustion. Strong trends can maintain a high ATR while price continues travelling in the same direction.
For a practical crypto example, a trader using the BTC/USDT market on Gate can compare current candle ranges with ATR while checking whether trading volume and surrounding support or resistance levels confirm that market conditions have changed.
ATR therefore tends to be the more direct volatility tool when the real question concerns how much price is moving and how much room a position may need.
Bollinger Band Width and the Bollinger Band Squeeze
BBW becomes more useful when the question shifts from price distance to volatility compression and expansion.
A Bollinger Band squeeze occurs when the upper and lower bands move closer together around the middle band, resulting in a relatively low BBW reading. The market is moving within a narrower range than before.
Traders watch narrowing bands because periods of unusually low volatility can eventually transition into higher volatility. The important word is can. A squeeze doesn't tell market participants exactly when expansion will begin, and it doesn't identify whether the significant price move will be bullish or bearish.
When the bands expand after a squeeze, BBW rises and confirms volatility expansion. Price may break above the upper Bollinger Band, below the lower Bollinger Band, or briefly break one side before reversing.
Trend direction, support and resistance levels, trading volume, momentum, and broader market structure can help separate those situations.
The related Bollinger %B indicator measures where price sits inside or outside the bands. BBW removes that directional position information and focuses specifically on the distance between the upper and lower bands.
That distinction prevents a common mistake: assuming BBW itself identifies overbought and oversold conditions.
High Volatility: How ATR and BBW Behave Differently
ATR and BBW often rise together during sharp market moves, but their calculations cause them to respond differently.
ATR uses the high, low, and previous close. A sudden wide-range candle can therefore push true range higher quickly.
BBW depends on the standard deviation around a moving average. Its movement reflects how widely recent prices are dispersing around the middle band.
During a sustained strong trend, Bollinger Bands can widen while price repeatedly trades near the upper band or lower band. That situation shouldn't automatically be interpreted as an overbought or oversold reversal signal. In strong trends, price can remain close to an outer band for an extended period.
A similar distinction appears when comparing Bollinger Bands vs. Keltner Channels. Bollinger Bands use standard deviation, while modern Keltner Channels commonly use ATR to determine channel distance, producing different responses to changes in price volatility.
Neither ATR nor BBW is identical to statistical historical volatility. Historical or realized volatility measures past variation in observed returns, often over a defined window and sometimes annualized.
Implied volatility is different again. It is derived from option prices and reflects volatility expectations embedded in the options market.
ATR, BBW, historical volatility, realized volatility, and implied volatility can therefore describe related aspects of market risk without being interchangeable measurements.
ATR vs. Bollinger Band Width: Which Is Better?
There isn't one universal winner. The better indicator depends on what the trader needs to measure.
| Question |
ATR |
Bollinger Band Width |
| Measure average price-movement size |
Best suited |
Indirect |
| Express volatility in price units |
Yes |
No |
| Compare differently priced assets |
Limited without normalization |
Better suited |
| Identify volatility compression |
Useful |
Strong use case |
| Identify a Bollinger Band squeeze |
No |
Yes |
| Set volatility-adjusted stops |
Common use |
Less direct |
| Inform position sizing |
Useful |
Less direct |
| Detect volatility expansion |
Yes |
Yes |
| Predict trend direction |
No |
No |
| Determine breakout direction |
No |
No |
Use ATR when the decision requires price units. It is generally clearer for volatility-adjusted risk distances, comparing a current candle with normal movement, adapting position size, or evaluating how much an asset typically moves during the chosen timeframe.
Use BBW when the decision concerns the volatility regime. It is generally better for identifying unusually tight Bollinger Bands, monitoring volatility compression, comparing relative volatility, and determining whether bands are expanding or contracting.
A useful division of labor is simple: BBW can flag when volatility conditions are changing; ATR can help translate those conditions into practical price and risk dimensions.
Can ATR and Bollinger Band Width Be Used Together?
Yes. Although ATR and BBW both measure volatility, they aren't calculated in the same way, so using both can provide complementary information.
Start with BBW to identify compression. If the bands are narrowing toward historically low levels, mark nearby support and resistance rather than guessing the future breakout direction.
If price eventually breaks the range and BBW begins rising, volatility dispersion is expanding.
ATR then answers another question: are actual price ranges increasing as well?
Suppose BBW reaches one of its lowest readings in several months while ATR is also falling. Both relative dispersion and absolute price movement are contracting. If BBW subsequently turns higher and ATR rises at the same time, the evidence for a transition toward higher volatility becomes stronger.
It still isn't directional confirmation.
A Donchian Channel can help frame recent price-range breakouts, while trend tools such as the EMA20 indicator or SuperTrend provide information that ATR and BBW deliberately leave out.
Momentum can fill another gap. The Relative Strength Index evaluates momentum on a bounded scale, whereas ATR measures movement magnitude. Keeping those functions separate reduces the temptation to make one indicator answer every market question.
Bollinger Bands Settings and Interpretation Risks
Default indicator settings are starting points, not fixed rules.
The widely used Bollinger Bands settings of a 20-period SMA and two standard deviations behave very differently on a five-minute crypto chart than on a daily chart. A 14-period ATR likewise represents 14 candles, meaning its real-world time span changes with the selected timeframe.
Both indicators are backward-looking. ATR summarizes recent true range values. BBW reflects recent standard deviation and its moving-average baseline.
A low-volatility environment can remain quiet much longer than expected. Likewise, volatility can increase rapidly and then collapse without producing a sustained trend.
Another risk is confusing volatility with direction.
High ATR means price ranges have become larger. It doesn't mean the market is bullish.
Widening Bollinger Bands mean price dispersion is increasing. They don't guarantee that a breakout will continue.
Low ATR and contracting Bollinger Bands indicate quieter market conditions, but neither predicts when volatility will return.
Liquidity deserves attention as well. Thinly traded crypto assets can experience abrupt price breaks, irregular ranges, and unstable spreads that cause volatility indicators to jump. Checking volume and market structure alongside the indicator can lead to more informed trading decisions than treating a single reading as sufficient evidence.
Conclusion
ATR is better for measuring volatility as an absolute trading range and translating that information into practical risk dimensions. Bollinger Band Width is better for measuring relative volatility compression and expansion, particularly when comparing volatility regimes or differently priced assets.
They answer related but different questions. ATR measures how much price has recently been moving. BBW measures how widely the upper and lower Bollinger Bands are separated relative to their moving-average center.
Neither predicts future price direction, and neither turns a high-volatility reading, upper-band break, or Bollinger Band squeeze into an automatic trading signal.
Used together, BBW can identify a changing volatility regime while ATR shows whether actual price ranges are expanding enough to affect stop distance, position size, and overall risk. For traders evaluating ATR vs. Bollinger Band Width, that division of labor is more useful than treating either volatility indicator as universally superior.
FAQ
Is ATR better than Bollinger Bands for measuring volatility?
ATR is generally better when volatility needs to be expressed as an actual price range. Bollinger Bands and BBW are more useful for seeing how volatility is expanding or contracting relative to a moving-average baseline. The better choice depends on whether the goal is risk measurement or volatility-regime analysis.
What does a high ATR mean?
A high or rising ATR means recent true price ranges have become larger. It indicates higher market volatility but doesn't reveal whether price is moving upward or downward.
What does a low Bollinger Band Width mean?
A low BBW means the upper and lower Bollinger Bands are relatively close together. This usually indicates volatility compression and may form part of a Bollinger Band squeeze, but low BBW doesn't guarantee that a breakout is imminent.
Is BBW better than ATR for comparing different assets?
Usually, yes. Because Bollinger Band Width divides band distance by the middle moving average, it produces a normalized value that is easier to compare across assets with very different prices. Raw ATR remains denominated in price units unless it is converted into a percentage.
Can ATR predict a breakout?
ATR can show that price ranges are becoming larger or smaller, but it cannot predict breakout direction. A rising ATR after a price break can confirm greater movement magnitude, while market structure, volume, and directional indicators are needed for additional context.
Can Bollinger Band Width predict whether price will rise or fall?
No. BBW measures the width of Bollinger Bands, not future price direction. A rising BBW indicates volatility expansion regardless of whether the underlying price move is bullish or bearish.
Disclaimer: This content is for educational and informational purposes only and does not constitute financial, investment, or trading advice. Technical indicators use historical market data and cannot guarantee future price movements or trading results.







