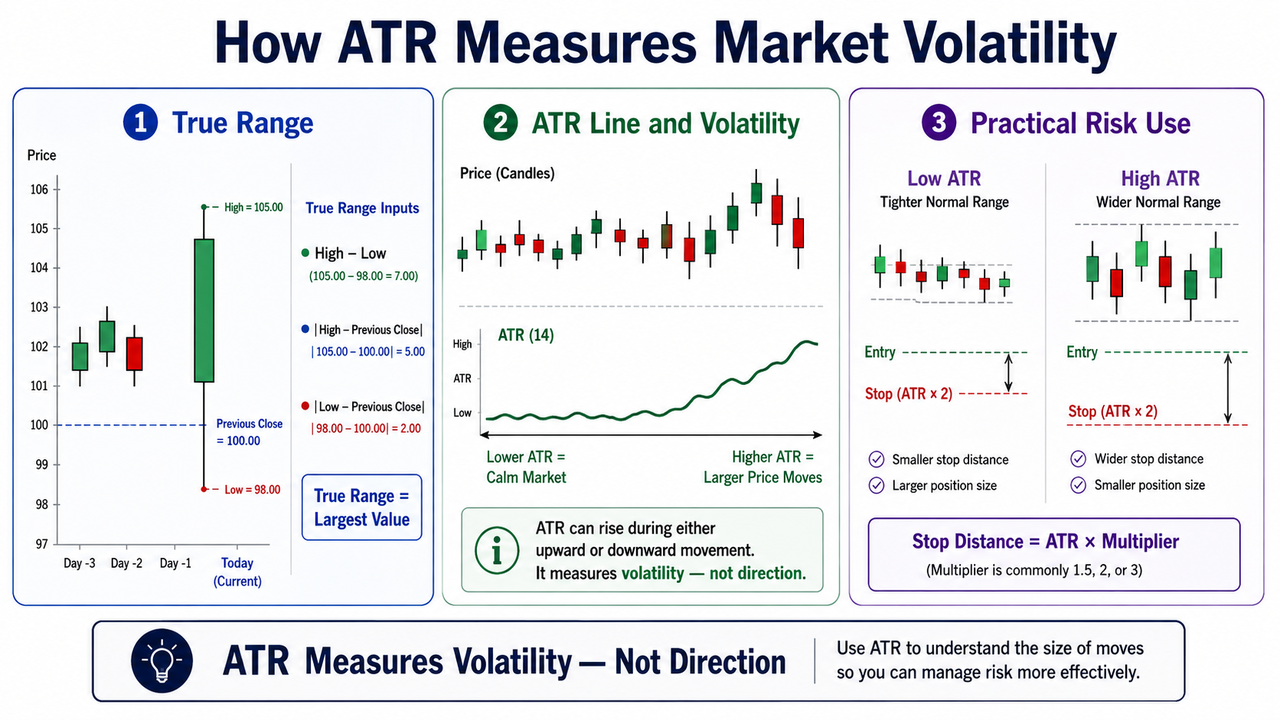
The ATR indicator, or Average True Range, measures market volatility by calculating how far an asset typically moves during a chosen period. A higher ATR means price movement has become wider and volatility has increased; a lower ATR means trading ranges have contracted. ATR doesn't tell traders whether price will rise or fall.
That distinction makes the Average True Range indicator particularly useful for traders trying to size positions, place volatility-adjusted stops, assess breakouts, or simply understand whether current price movement is unusually active. Instead of treating every $500 Bitcoin move or $50 stock move the same way, ATR puts the movement in the context of recent market conditions.
Developed by J. Welles Wilder Jr. and introduced in 1978, ATR has become a standard technical analysis tool across stocks, commodities, forex and cryptocurrency markets. Most charting systems use 14 periods by default, although the appropriate time period depends on the trading system and timeframe being analyzed.
Key Takeaways
Average True Range measures volatility, not price direction. Rising ATR values can occur during both rallies and sell-offs.
ATR normally uses 14 periods and incorporates the current high, current low and previous close when calculating True Range.
A higher ATR indicates wider recent price movement, while a lower ATR suggests calmer or more compressed market conditions.
Traders commonly use ATR for position sizing, stop-loss placement and assessing whether volatility is expanding around a breakout.
ATR is a lagging indicator based on historical price data, so it shouldn't be treated as a standalone entry, exit, buy or sell signal.
What Is the ATR Indicator?
The Average True Range (ATR) is a technical indicator that measures the average size of an asset's recent trading ranges. Its purpose is gauging market volatility in absolute price terms.
Suppose an asset normally moves about $20 per day but recently begins moving $60 to $80. Its ATR will generally rise as those larger true range values enter the calculation. If daily ranges later contract toward $10 to $15, ATR will gradually fall.
What ATR doesn't reveal is direction. A high ATR value could result from strong buying pressure pushing price upward, aggressive selling pressure driving it lower, or sharp movement in both directions. For directional analysis, traders normally need price structure or other technical indicators.
For example, the Relative Strength Index evaluates momentum on a bounded scale, while MACD tracks relationships between moving averages. ATR answers a different question: how much is price moving?
How Average True Range Measures Market Volatility
ATR starts with True Range (TR) rather than simply subtracting each period's low from its high. This matters because normal high-low range calculations can miss price gaps between one period's closing price and the next period's trading range.
For every candle, True Range is the greatest of these three values:
Current high minus current low
Absolute value of current high minus previous close
Absolute value of current low minus previous close
Using the absolute value prevents direction from affecting the measurement. A downward gap can therefore create just as large a True Range as an upward gap.
Imagine yesterday's closing price was $100. Today's market trades between $106 and $110. The ordinary high-low range is only $4, but the distance between today's high and the previous close is $10. True Range is therefore $10, preserving the volatility created by the price gap.
This treatment of previous close data is one reason ATR can describe sudden changes in trading conditions better than a simple average of daily high-low ranges.
ATR Calculation: How Is Average True Range Calculated?
Wilder's standard ATR calculation commonly uses 14 periods. On a daily chart, that means 14 trading periods; on an hourly chart, it means 14 hourly candles.
The first ATR is calculated as the average of the first 14 True Range values:
Initial ATR = Sum of first 14 TR values ÷ 14
Subsequent ATR values use Wilder's smoothing method:
ATR = (PreviousATR×(n−1))+CurrentTR ÷ n
where n is the selected number of periods.
For a 14-period ATR:
Current ATR = (PreviousATR×13)+CurrentTR ÷ 14
The smoothing prevents one unusually large candle from completely replacing the historical context. Still, sharp price moves can push the ATR line noticeably higher, especially when several large ranges occur close together.
Because calculating ATR relies entirely on historical data, it is inherently a lagging indicator. It describes recent volatility rather than predicting future price movements.
How to Read Higher ATR and Lower ATR Values
ATR values are most useful when interpreted relative to the same asset's recent history.
ATR behavior
Typical interpretation
Higher ATR
Larger price ranges and increased volatility
Rising ATR
Volatility or market activity is expanding
Lower ATR
Smaller price ranges and lower volatility
Falling ATR
Volatility is contracting
Sudden ATR spike
An unusually sharp price move has occurred
Persistently low ATR
Market may be consolidating
A $500 ATR, for instance, can be relatively small for a high-priced asset but enormous for an asset trading at $1,000. This is why raw ATR values aren't ideal for directly comparing volatility across assets with very different prices.
In practice, traders often watch how the current ATR compares with prior ATR readings rather than focusing on one fixed number. There is no universal ATR level that defines high volatility across all financial markets.
Using ATR for Position Sizing and Risk Management
Position sizing is one of ATR's most practical applications. Highly volatile markets naturally produce wider normal price fluctuations, so using exactly the same position size and stop distance in both calm and volatile conditions can create inconsistent risk.
A trader may instead determine the amount of capital they're prepared to risk and then adjust position size according to the ATR-based stop distance. Wider volatility generally results in a smaller position; lower volatility may permit a larger position for the same predefined risk amount.
This principle is particularly relevant in leveraged markets, where position size and leverage interact to determine exposure. Effective futures position management requires more than correctly forecasting price direction.
ATR doesn't decide how much risk a trader should accept. It simply gives the trading system a volatility measurement that can be incorporated into better risk management.
How Traders Use ATR for Stop-Loss Levels
Fixed stop distances can behave very differently as market volatility changes. A stop placed $100 from an entry price may be reasonably wide during low volatility but fall inside normal price fluctuations once ATR rises.
Multipliers around 1.5 to 3 ATR are often used as reference points, but they're conventions rather than guaranteed optimal settings. The appropriate distance depends on timeframe, strategy, liquidity and how much risk the trader accepts.
If BTC entered at $60,000 has a current ATR of $1,000, a 2× ATR volatility distance equals $2,000. That calculation doesn't mean $58,000 is automatically the correct stop. Support and resistance levels, market structure and position sizing still matter.
A trader applying the concept to a live market can inspect the BTC/USDT futures chart on Gate.com and compare the ATR line with actual candle ranges before deciding whether a proposed stop sits inside or outside ordinary volatility.
Can ATR Confirm Breakouts?
ATR can help assess whether volatility is expanding during a price break, but it doesn't confirm the breakout's direction or guarantee that the move will continue.
Suppose price has remained near resistance while ATR readings steadily decline. A later price break accompanied by a sharp rise in ATR shows that ranges have expanded. That can make the move more significant than a breakout occurring while volatility remains unusually subdued.
Direction still needs separate evidence. Price structure, volume, support and resistance levels, or a trend indicator may help establish whether buyers or sellers have control.
ADX, for example, focuses on trend strength, while SuperTrend combines volatility inputs with directional trend logic. ATR itself stays direction-neutral.
ATR vs. Moving Averages and Momentum Indicators
ATR fills a different role from many familiar technical analysis tools.
An SMA indicator averages price to smooth short-term fluctuations, while an EMA weights recent price data more heavily. Both can help traders evaluate trend direction.
Momentum oscillators answer another question. Williams %R measures where the closing price sits relative to its recent high-low range, and the PPO measures the percentage difference between moving averages.
ATR measures neither trend nor momentum. That makes it complementary rather than interchangeable with these indicators.
Limitations of the Average True Range Indicator
ATR's biggest limitation is also easy to misunderstand: increased volatility isn't inherently bullish or bearish. A rising ATR line cannot generate a reliable buy or sell signal on its own.
The indicator can also become temporarily elevated after sharp price moves. Because previous large ranges remain inside the calculation, ATR may continue showing high volatility even after immediate market conditions begin calming.
Parameter choice matters too. A shorter time period responds faster but can produce a noisier ATR line. A longer period creates smoother readings but responds more slowly to sudden changes.
Finally, ATR measures absolute price movement. Comparing raw ATR readings between assets with dramatically different prices can therefore be misleading.
Combining ATR with trend indicators, momentum tools, price structure and disciplined trade execution usually provides more context than relying on ATR alone.
Conclusion
The ATR indicator measures market volatility by tracking the average True Range of recent price periods, including gaps relative to the previous close. Higher ATR values indicate wider price movement; lower ATR values indicate quieter conditions. Neither predicts price direction.
Its strongest uses are practical: adapting position sizing, evaluating whether stop distances fit normal volatility, and identifying when market activity expands or contracts. ATR can also strengthen breakout analysis when a price break coincides with rising volatility.
The catch is that ATR looks backward. It doesn't predict future price movements or independently tell traders when to enter or exit trades. Used alongside directional indicators, price structure and risk controls, however, Average True Range can turn an otherwise vague idea of "high" or "low" volatility into a measurable part of a trading system.
FAQ
What is the ATR indicator in simple terms?
ATR, or Average True Range, measures how much an asset has typically moved per period over a recent window. A rising ATR indicates larger trading ranges, while a falling ATR indicates smaller ranges. It measures volatility rather than direction.
What does a high ATR value mean?
A high ATR value means the asset has recently experienced relatively large price movements. It doesn't mean price is necessarily rising; strong downward moves can produce equally high ATR readings.
What does a lower ATR indicate?
A lower ATR indicates that recent price ranges have become smaller. Persistently low ATR can occur during quieter markets or consolidation, although it doesn't predict when volatility will expand again.
What is the best ATR setting?
The traditional default is 14 periods, based on Wilder's original framework. Shorter settings react faster, while longer settings produce smoother ATR readings. The appropriate setting depends on the asset, timeframe and trading strategy.
Does ATR provide buy and sell signals?
No. ATR measures volatility and doesn't directly provide directional entry or exit signals. Traders commonly combine it with price action, trend indicators, momentum indicators, support and resistance, or other technical analysis tools.
Can ATR predict a breakout?
ATR cannot predict whether price will break upward or downward. A rise in ATR during or after a price break can show that volatility and market activity have expanded, but the breakout can still fail.
Disclaimer:This content is for educational and informational purposes only and does not constitute financial or investment advice. Technical indicators rely on historical market data and cannot guarantee future results. Cryptocurrency trading involves substantial risk, and market conditions can change rapidly.
Author: Jared
Disclaimer
* The information is not intended to be and does not constitute financial advice or any other recommendation of any sort offered or endorsed by Gate.
* This article may not be reproduced, transmitted or copied without referencing Gate. Contravention is an infringement of Copyright Act and may be subject to legal action.
DEX aggregators integrate order data, price information, and liquidity pools from multiple decentralized exchanges, helping users find the optimal trading path in the shortest time. This article delves into 8 commonly used DEX aggregators, highlighting their unique features and routing algorithms.
The report shows that in Q1 2026, the crypto market will reach a stage of structural maturity, with Derivative trading making up more than 90% of total trading volume, exceeding $20 trillion. As Spot demand weakens, liquidity will become even more concentrated in top exchanges, reflecting a more cautious market sentiment and a shift toward leveraged and institutional trading.