This guide focuses on what the SuperTrend indicator is, how it is calculated and interpreted, how swing traders apply it in crypto and other financial markets, where it differs from moving averages, what settings are commonly used, and where its limits matter most. If you want a quick answer to “what is supertrend indicator,” it is a volatility-based overlay that helps confirm trend direction on a chart rather than predict reversals before price moves.
You’ll see how the indicator is built from ATR, how to read bullish and bearish flips, when it works best in trend-following strategies, and why traders should treat it as a confirmation tool instead of a standalone signal. However, SuperTrend can lag and produce delayed or false signals in sideways markets, even though it is relatively easy to use and interpret.
TL;DR
-
The SuperTrend indicator combines Average True Range with a multiplier to create a volatility-adjusted trend line.
-
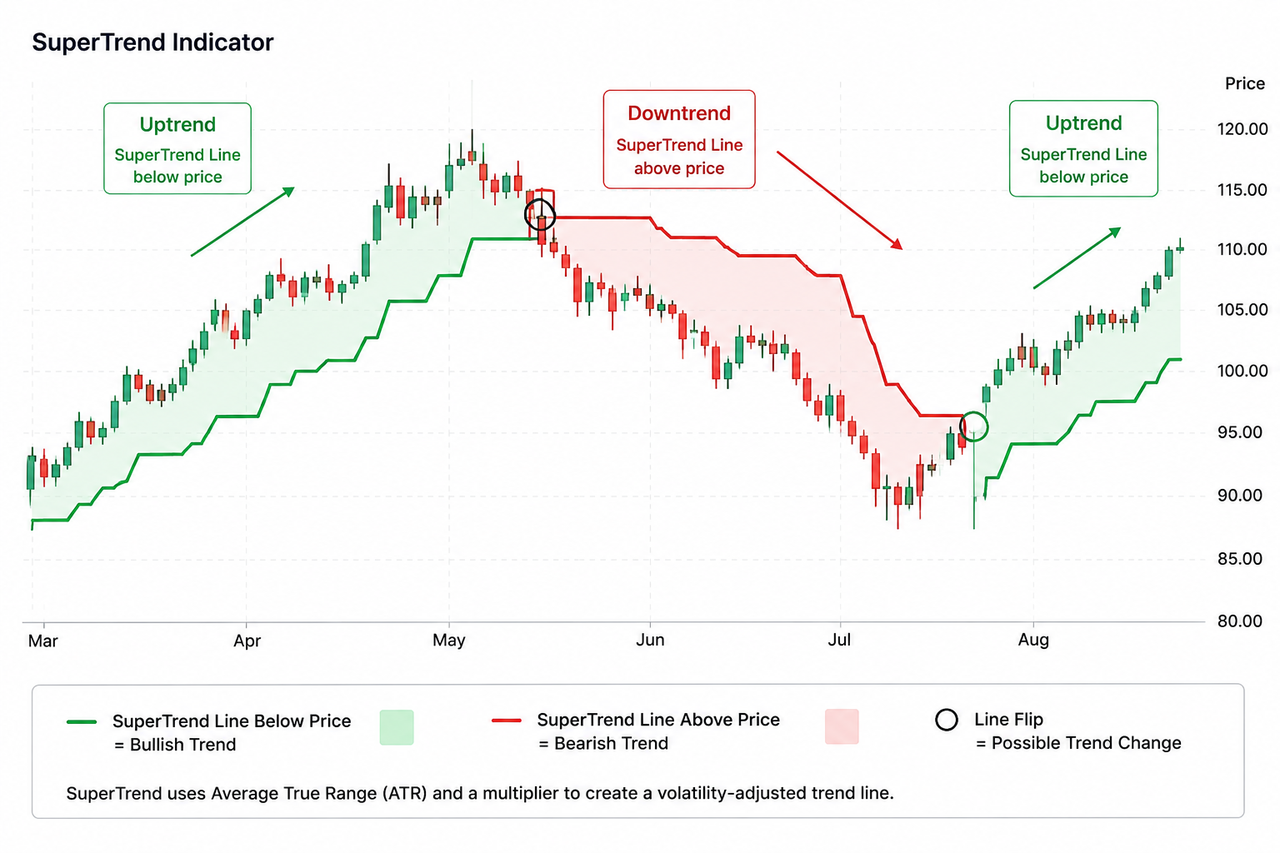
A line below price generally indicates an uptrend, while a line above price generally indicates a downtrend.
-
The ATR period and multiplier control how quickly the indicator responds to price changes.
-
Swing traders can use SuperTrend to confirm signals from moving averages, MACD, other momentum indicators, and price structure.
-
SuperTrend works best in trending markets and may generate repeated direction changes in market noise or sideways conditions.
What Is the SuperTrend Indicator?
The SuperTrend indicator is a trend-following technical indicator used in technical analysis and displayed directly on a price chart. Unlike an oscillator that moves in a separate panel, SuperTrend appears as a single line overlay that changes position when the calculated trend direction changes.
The indicator is based on Average True Range, which measures market volatility rather than direction. SuperTrend applies a multiplier to ATR and adds or subtracts the result from the midpoint of each price period. These calculations create upper and lower bands that adjust as volatility changes.
When the active SuperTrend line appears below price, the market is commonly interpreted as being in an uptrend, and many platforms show this as a green line; many traders read this as the point where the indicator turns green. When the line moves above price, the market is commonly interpreted as being in a downtrend, and many platforms display a red line; by contrast, when price is below the line, the indicator often appears red rather than a green line. Colours may differ between charting platforms, so traders should focus on the line’s position rather than assuming that every platform uses the same visual settings.
How Does the SuperTrend Indicator Work with Average True Range?
The SuperTrend indicator works as a volatility-based tool that tracks price movements through an active indicator line using two volatility-adjusted bands. Its basic calculations can be expressed as:
The price midpoint is normally calculated from the period’s high and low. The indicator then uses previous band values and the closing price to decide which band should remain active. TradingView describes SuperTrend as a trend-following indicator based on ATR, or average true range ATR, and allows users to adjust both the ATR length and multiplier, with the standard ATR period commonly set to 10 or 14. The SuperTrend indicator calculated from the high, low, average true range, and multiplier determines where the upper and lower bands sit relative to price.
| SuperTrend Element |
What It Controls |
| ATR period |
Number of periods used to measure volatility |
| Multiplier |
Distance between price and the SuperTrend bands |
| Line below price |
Bullish trend condition |
| Line above price |
Bearish trend condition |
| Position change |
Possible change in trend direction |
A smaller multiplier keeps the line closer to price and makes the indicator more sensitive. Shorter ATR periods also produce more signals by making it react faster to price moves. This can identify direction changes earlier but may also create more false reversals. A larger multiplier places the line farther from price, producing fewer but generally slower signals.
How Do Swing Traders Read SuperTrend Signals?
Swing traders mainly use SuperTrend for analyzing supertrend signals around entry, exit, and trend confirmation, not just to confirm direction.
A bullish condition begins when price closes above the relevant upper band and the active SuperTrend line moves below price. It generates buy signals when price closes above the indicator line, and a buy signal occurs when the SuperTrend line turns green. A bearish condition begins when price closes below the relevant lower band and the line switches above price. A sell signal occurs when the SuperTrend line turns red, creating sell signals based on a bearish shift and possible trend reversal. These changes may indicate that market direction has shifted, but they do not guarantee that a sustained trend will follow.
The indicator becomes more useful when its direction agrees with price structure. For example, a bullish SuperTrend condition has stronger context when price is also forming higher highs and higher lows. Traders also compare the indicator value with the closing price to judge whether the signal is holding or weakening. If the indicator turns bullish while price remains trapped inside a narrow range, the signal may be less reliable. In an uptrend, the SuperTrend line can act as dynamic support, and when price rises cleanly away from the line, traders may reassess stops or exits rather than treat the signal as permanent.
A rising EMA 20 indicator can help assess whether short-term price direction supports the SuperTrend reading. A longer-period SMA indicator can provide broader trend context, while the MACD indicator can show whether momentum is strengthening or weakening within the confirmed trend. Traders often use the supertrend indicator alongside other indicators to confirm trends and avoid false signals.
SuperTrend vs Moving Averages
SuperTrend responds to volatility, while moving averages smooth price over a fixed number of periods.
| Factor |
SuperTrend |
Moving Average |
| Main purpose |
Trend confirmation |
Trend direction and price smoothing |
| Main input |
Price and ATR |
Historical prices |
| Volatility adjustment |
Yes |
Not directly |
| Typical interpretation |
Line position and direction changes |
Price position, slope, and crossovers |
| Main weakness |
Whipsaws in ranging markets |
Delayed response to price changes |
The key difference is adaptability. SuperTrend moves farther from price when ATR rises and closer when ATR falls. A moving average does not directly adjust its distance from price according to volatility.
Limitations of the SuperTrend Indicator
SuperTrend is a lagging indicator because it depends on completed price periods and historical volatility, which affects trend detection because signals confirm moves only after they begin. By the time its direction changes, part of the new price move may already have occurred.
The indicator also struggles in range-bound markets, so whether the supertrend indicator reliable depends a lot on context. It is generally more effective in trending conditions, but when price repeatedly crosses its volatility bands without developing a trend, SuperTrend can switch direction several times and create whipsaw signals. TradingView similarly notes that the indicator may generate false signals and should not be treated as a complete trading system by itself.
Settings also affect interpretation. A configuration that works smoothly on one asset or timeframe may react differently on another because volatility and market structure vary, and it is not the best technical indicator on its own. Traders should therefore assess SuperTrend alongside support and resistance, volume, moving averages, momentum, and broader market conditions. In practice, traders often use a supertrend strategy with other technical indicators, such as the average directional index, for risk management to manage risk and avoid false signals.
FAQ
Is SuperTrend a trend or momentum indicator?
SuperTrend is primarily a trend-following and trend-confirmation indicator. It uses ATR to account for volatility, but it does not directly measure momentum in the way MACD does. It is not one of the momentum indicators, but traders often pair it with them to confirm price action and overall trend strength.
What are common SuperTrend settings?
A frequently used configuration is an ATR period of 10 and a multiplier of 3, although defaults vary between platforms. More specifically, supertrend indicator settings with lower ATR periods and a low 2 multiplier atr create a more sensitive line and more signals, while larger values reduce sensitivity; the right setup should vary by timeframe, asset classes, and use case such as intraday trading. Settings should be tested against the asset, timeframe, and market conditions rather than treated as universally optimal, because over-optimization can weaken a supertrend indicator strategy.
Is a bullish SuperTrend change an entry signal?
A bullish direction change indicates that price has moved above the relevant volatility band. It can be used as a buy signal for a long position when the green indicator line appears below price, but only with confirmation. Some traders also use that line as a stop reference for the trade and set profit targets separately.
Does SuperTrend work in sideways markets?
SuperTrend is generally less reliable in sideways markets. Repeated movement across its bands can cause frequent bullish and bearish switches without a sustained trend. It performs poorly when price breaks above and below the line repeatedly without a clear current trend. Even so, some traders use the super trend indicator within a broader trading strategy by combining it with fibonacci retracement levels or other confirmation tools to validate breakouts and spot stronger exit points after a move. In bearish conditions, the red indicator line may help manage a short position, but range-bound action still reduces reliability.
This content is provided for educational purposes only and does not constitute financial or investment advice. Technical indicators cannot predict market outcomes, and cryptocurrency trading involves substantial risk.







