Calculated across the latest 20 chart periods, the EMA 20 indicator gives greater weight to recent prices. Swing traders use its direction and slope to assess short-term trends, evaluate pullbacks, and track changes in momentum. Signals become more meaningful when the EMA 20 aligns with price structure and broader market conditions.
TL;DR
-
EMA 20 is a moving average that places greater weight on recent prices.
-
A rising EMA 20 commonly supports a bullish swing-trading bias, while a falling EMA 20 supports a bearish bias.
-
Swing traders often watch price pullbacks toward EMA 20 during established trends.
-
EMA 20 works best as a trend filter or area of interest rather than an exact entry signal.
-
Sideways markets, sudden volatility, and weak price structure can reduce its reliability.
What Does EMA 20 Mean?
EMA 20 means the 20-period exponential moving average. The number 20 refers to the latest 20 candles on the selected chart, not necessarily 20 calendar days.
On a daily chart, EMA 20 reflects approximately 20 daily candles. On a four-hour chart, it uses 20 four-hour candles. The indicator therefore covers different amounts of real time depending on the selected timeframe.
An exponential moving average differs from a simple moving average because it gives newer prices more influence. This makes EMA 20 more responsive to recent momentum than SMA 20, although the extra sensitivity can also produce more false reactions when price is unstable.
For swing traders, EMA 20 is generally used to answer three practical questions:
-
Is the short-term trend rising, falling, or moving sideways?
-
Is price pulling back within an established trend?
-
Is momentum weakening enough to question the current trend?
How Is the EMA 20 Calculated?
EMA 20 combines the latest price with the previously calculated EMA.
The smoothing multiplier is:
2 ÷ (20 + 1) = 0.0952
The current value is calculated as:
Current EMA = Current price × 0.0952 + Previous EMA × 0.9048
This formula gives the newest price more influence while retaining progressively smaller contributions from older prices. Trading platforms perform the calculation automatically, so traders mainly need to understand how the weighting affects the indicator’s behaviour.
Because EMA 20 responds relatively quickly, it follows short-term price movements more closely than a longer average such as EMA 50 or EMA 200.
How Do Swing Traders Read EMA 20?
Swing traders usually evaluate the EMA 20 through its slope, price position, and interaction with market structure.
| EMA 20 observation |
Common swing-trading interpretation |
What to verify |
| EMA 20 slopes upward and price stays above it |
Short-term bullish trend remains active |
Higher highs and higher lows |
| EMA 20 slopes downward and price stays below it |
Short-term bearish trend remains active |
Lower highs and lower lows |
| Price pulls back toward a rising or falling EMA 20 |
Possible trend-continuation area |
Candle reaction, volume and swing levels |
| EMA 20 becomes flat and price crosses repeatedly |
Trend strength is weak or the market is ranging |
Clear breakout or stronger directional structure |
The key point is that EMA direction matters more than a single crossover. Price moving above a flat EMA 20 is weaker evidence than price holding above a rising EMA while forming higher highs and higher lows.
Similarly, price moving below a rising EMA does not automatically confirm a bearish reversal. A temporary break may simply reflect volatility within the existing trend.
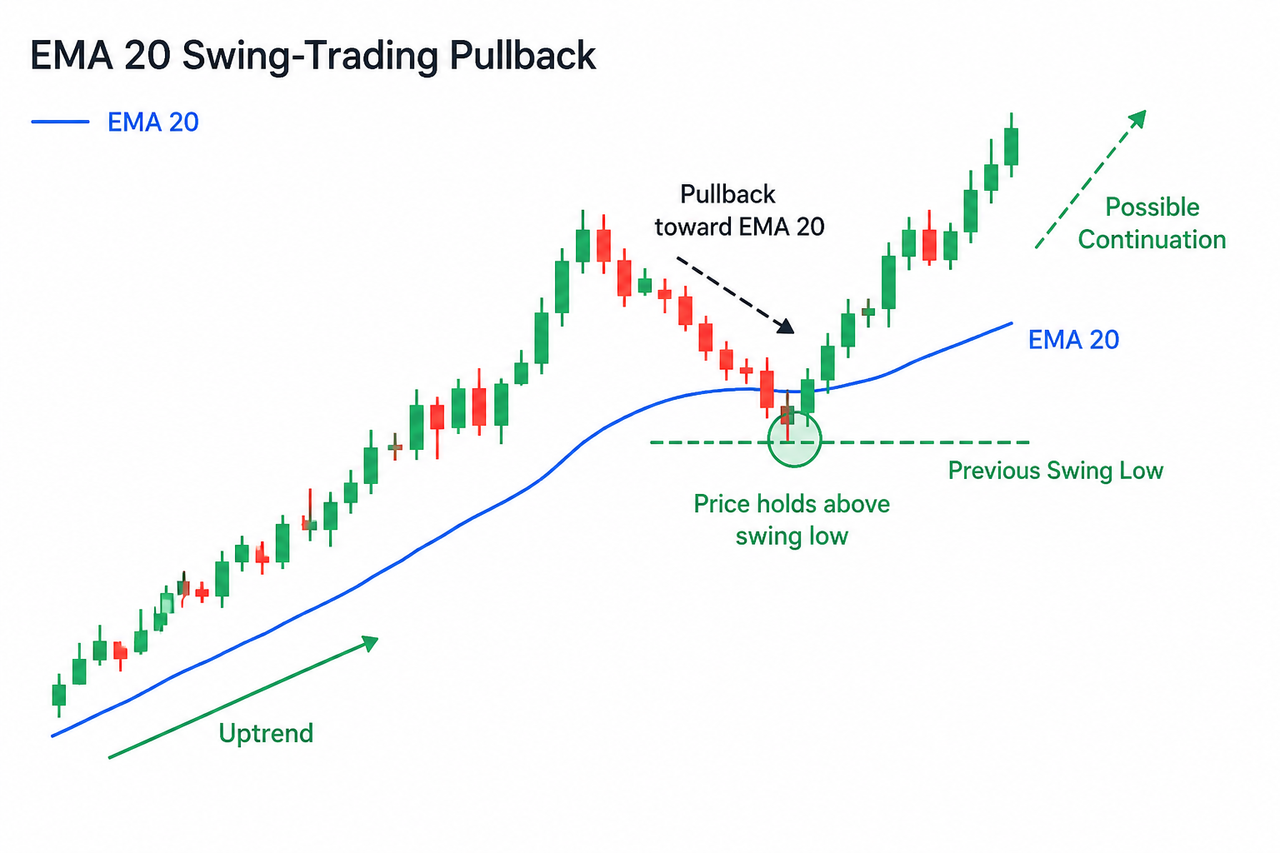
How Can EMA 20 Identify Swing-Trading Pullbacks?
EMA 20 can help traders locate areas where a trending market may pause before continuing.
In an uptrend, price may advance, retreat toward the rising EMA 20, and then resume upward. In a downtrend, price may rally toward a falling EMA 20 before sellers regain control.
Consider a hypothetical asset:
-
Price rises from $100 to $120.
-
EMA 20 rises from $103 to $111.
-
Price pulls back from $120 to $112.
-
The previous swing low remains intact.
-
Price forms a bullish reaction and closes near $115.
The reaction near EMA 20 may support a continuation setup because the average, price structure, and candle behaviour point in the same direction.
However, the EMA should be treated as a zone, not an exact price. Some pullbacks stop before reaching the line, while others briefly move through it before recovering. A trader relying on an exact EMA touch may therefore enter too early or ignore a valid setup that does not reach the line precisely.
EMA 20 vs SMA 20
EMA 20 and SMA 20 both measure average price over 20 periods, but they respond differently.
| Feature |
EMA 20 |
SMA 20 |
| Price weighting |
Recent prices receive more weight |
All 20 prices receive equal weight |
| Reaction speed |
Faster |
Slower |
| Typical swing use |
Momentum and pullback analysis |
Broader price smoothing |
| Main drawback |
More sensitive to market noise |
Slower to reflect momentum changes |
EMA 20 may suit traders who want a more responsive trend indicator. SMA 20 may suit traders who prefer a smoother line and fewer short-term fluctuations.
Neither average is universally better. The appropriate choice depends on the asset, timeframe, volatility, and trading method.
How Should EMA 20 Be Confirmed, and What Are Its Limitations?
EMA 20 becomes more useful when it agrees with independent evidence from the chart.
Useful confirmation may include:
-
Price structure: Higher highs and higher lows support a bullish reading, while lower highs and lower lows support a bearish reading.
-
Support and resistance: Previous swing levels can provide clearer invalidation points than the EMA itself.
-
Volume: Stronger activity may support a breakout or rebound, although volume interpretation depends on the market.
-
Longer moving averages: EMA 50 or EMA 200 can show whether the short-term signal agrees with the broader trend.
-
Momentum indicators: RSI or MACD may help identify weakening or strengthening momentum.
Traders should avoid counting closely related indicators as separate confirmation. MACD is calculated from exponential moving averages, so EMA 20 and MACD may respond to similar price information.
EMA 20 also performs poorly in some conditions. In sideways markets, price may cross the line repeatedly without developing a sustained trend. Sudden news, thin liquidity, liquidations, or sharp volatility can move price far away from the average. Different exchanges may also display slightly different EMA values because their price data is not identical.
EMA 20 does not measure an asset’s fundamental value, guarantee that support will hold, or determine an appropriate position size. Risk management, stop placement, liquidity conditions, and market context remain separate decisions.
More broadly, an explanation of trading indicators shows why technical indicators should support a structured analysis process rather than replace it.
Summary
The EMA 20 helps swing traders track short-term trend direction, evaluate pullbacks, and identify changes in momentum by giving greater weight to recent prices. Its signals are more reliable when the EMA slope aligns with price structure, support and resistance, volume, and broader market conditions.
Educational disclaimer: Technical indicators cannot guarantee trading outcomes. Digital assets are volatile, and traders should independently assess market, liquidity, leverage, and execution risks.
FAQs
Is EMA 20 good for swing trading?
EMA 20 can be useful for swing trading because it responds quickly enough to show short-term trend changes and pullbacks. Its effectiveness depends on the asset, timeframe, volatility, and supporting price structure.
Which timeframe is best for EMA 20?
There is no universally best timeframe. Swing traders commonly examine EMA 20 on daily, four-hour, or sometimes one-hour charts, depending on the intended holding period and level of market noise.
Is EMA 20 a support or resistance level?
EMA 20 may behave like dynamic support during an uptrend or dynamic resistance during a downtrend. It is not a fixed level, and price may stop before the EMA or temporarily move through it.
What does an EMA 20 crossover mean?
An EMA 20 crossover shows that price has moved from one side of its recent weighted average to the other. The signal becomes more meaningful when the EMA slope, price structure, volume, and broader trend support the same conclusion.