For traders trying to identify consolidation, breakout conditions, or changes in market risk, the useful distinction is between volatility and direction. This article explains how Bollinger Band Width is calculated, what normalized bandwidth means, how a Bollinger Band squeeze develops, how BBW behaves across different market conditions, and how price trend, volume, momentum, and other analysis techniques can help confirm signals. The indicator is generally more useful when combined with other indicators than when treated as a standalone trading signal.
Key Takeaways
-
Bollinger Band Width measures volatility rather than price direction. Low readings indicate contraction, while rising or high readings indicate volatility expansion.
-
Bollinger Bands consist of three lines: an SMA middle band, an upper band, and a lower band.
-
BBW commonly uses normalized bandwidth, calculated as the difference between the upper and lower bands divided by the middle band.
-
Very low BBW can identify a Bollinger Band squeeze. The tighter the squeeze, the more explosive the eventual breakout may be, although neither its timing nor direction is guaranteed.
-
BBW can help traders identify potential price movements, but price trend, chart structure, volume, momentum, and risk management are still needed to interpret the signal.
What Is Bollinger Band Width Indicator and How Does It Measure Volatility Expansion and Contraction?
Bollinger Band Width measures the percentage difference between the upper and lower Bollinger Bands relative to the middle band. It converts the changing width of Bollinger Bands into a separate numerical indicator, making volatility expansion and contraction easier to compare across time.
Bollinger Bands, developed by John Bollinger, consist of three lines:
-
Middle band: usually a simple moving average, commonly 20 periods
-
Upper Bollinger Band: the middle band plus a chosen number of standard deviations
-
Lower Bollinger Band: the middle band minus the same multiple of standard deviations
In the standard configuration, the upper and lower bands are commonly positioned two standard deviations above and below the SMA. Both outer bands therefore use the same multiple of standard deviation.
Bollinger Bands are based on a moving average and the standard deviation of historical price data. As recent price movements become larger, standard deviation generally increases and the bands widen. When price movements become smaller, the bands contract.
BBW isolates that change. A trader doesn't have to estimate visually whether bands look slightly wider than last month; the bandwidth indicator provides a value that can be compared with earlier periods.
How Bollinger Band Width Is Calculated
A common normalized Bollinger Band Width formula is:
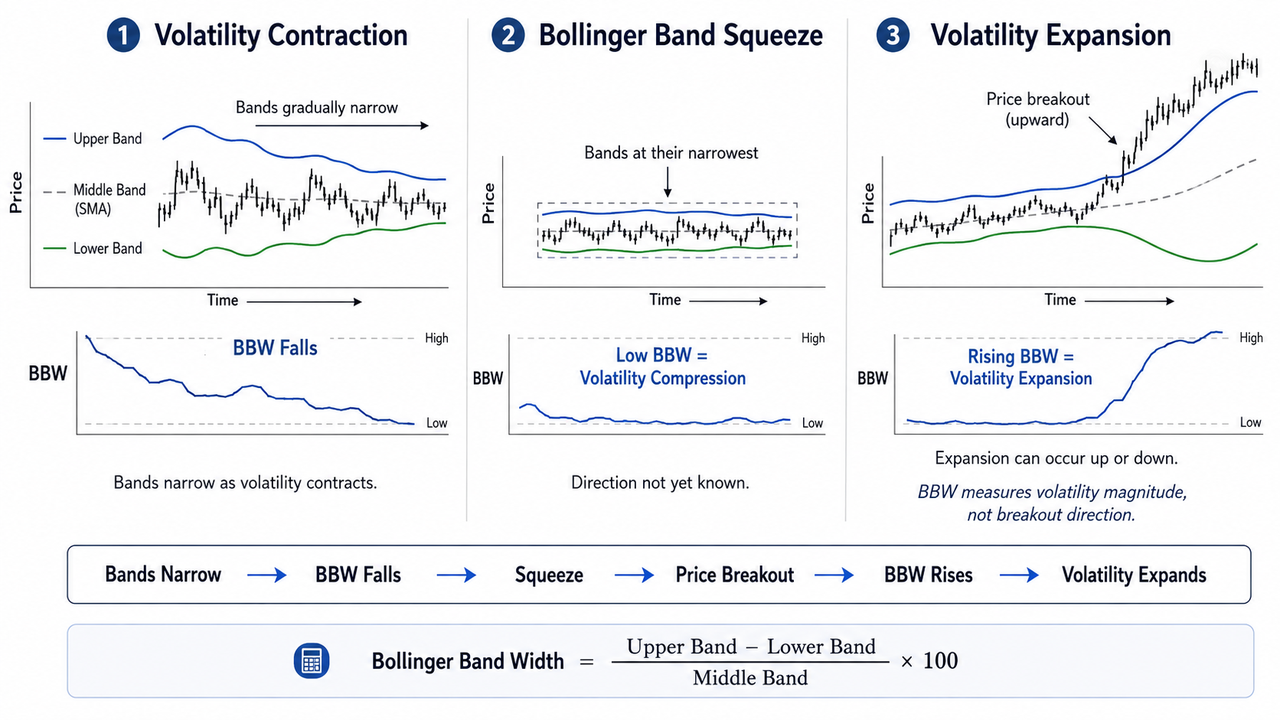
BBW = (Upper Band − Lower Band) / Middle Band × 100
Some charting platforms leave the result as a decimal rather than multiplying it by 100. The interpretation remains the same.
Suppose a stock's price is trading around $100 and its Bollinger Bands show:
-
Middle band: $100
-
Upper band: $106
-
Lower band: $94
The distance between the upper and lower bands is $12.
BBW = ($106 − $94) / $100 × 100 = 12%
If the bands later narrow to $103 and $97 while the middle band remains near $100, the normalized bandwidth falls to 6%.
That tells the trader that price volatility has contracted.
Normalization is useful because price relative to band width matters. A $10 gap between the bands means something very different for a stock's price of $50 than for an asset trading at $1,000. Dividing by the middle band makes comparisons more meaningful.
The moving average period also affects BBW. A shorter moving average period responds more quickly to recent price data, while a longer period generally smooths short-term changes. Default settings can therefore behave differently depending on the asset, timeframe, and trading style.
How to Read Bollinger Band Width in Different Market Conditions
BBW is usually interpreted relative to its own historical range rather than against a universal threshold.
| BBW Behavior |
Market Condition |
Typical Interpretation |
| BBW falling |
Declining volatility |
Price movement is becoming quieter |
| BBW near historical lows |
Low volatility |
Possible squeeze or consolidation |
| BBW turns upward rapidly |
Volatility expansion |
Market activity is accelerating |
| BBW remains elevated |
High volatility |
Large price movements are continuing |
| BBW falls after an extreme |
Volatility cooling |
Expansion may be losing strength |
Low BBW Values
Low bandwidth values indicate that the upper and lower bands are close together. This often happens during periods of low volatility, when the market is consolidating inside a relatively narrow price range.
A low reading doesn't mean the price trend is bullish or bearish. Price might be moving sideways after a strong uptrend, pausing during a downward trend, or simply trading in a ranging market.
The indicator's value comes from showing that volatility has compressed relative to recent market conditions.
Rising BBW
A sudden increase in BBW indicates that market activity is accelerating. Wider bands mean recent price movements have grown larger, so volatility expansion is underway.
Direction still has to come from the chart.
If price breaks above resistance while BBW rises sharply, volatility is expanding during an upward move. If price falls below support and BBW increases, the same indicator behavior can accompany a strong downward trend.
That separation allows traders to assess market volatility without confusing volatility with directional bias.
High BBW Values
High bandwidth values indicate that the upper and lower bands are widely separated. This normally reflects high volatility and larger price movements.
An unusually high reading may also appear after a significant price move has already occurred. Under some conditions, extremely elevated BBW can suggest that the market has entered an overextended volatility phase. It does not, however, identify potential reversal points by itself.
A strong trend can remain volatile much longer than expected.
What Is a Bollinger Band Squeeze?
A Bollinger Band squeeze occurs when volatility contracts enough for the upper and lower Bollinger Bands to move unusually close together.
On BBW, this appears as a decline toward relatively low historical values.
The squeeze matters because periods of unusually low volatility can precede significant price moves. Markets often alternate between contraction and expansion, so a tight consolidation can eventually give way to a larger movement.
In practice:
Volatility contraction → tight bands → squeeze → breakout attempt → volatility expansion
The tighter the squeeze, the more explosive the breakout may be because a prolonged compression can leave price trading inside an unusually restricted range. That principle is useful for identifying potential breakout opportunities, but it isn't a guarantee. Some squeezes remain compressed for longer than expected, while others produce false breakouts.
Most importantly, a squeeze doesn't predict direction.
For example, suppose BTC trades inside a narrow range while BBW falls to one of its lowest readings in several months. Price eventually closes above resistance and BBW begins rising quickly. The low BBW identified the compression; price action identified the upward break; rising BBW showed that volatility was expanding.
If price had broken below support instead, BBW could have risen in exactly the same way.
Using Bollinger Band Width to Assess Market Volatility
A useful way to apply BBW is to view volatility as a cycle rather than searching for one fixed buy or sell level:
Contraction → Squeeze → Expansion → Elevated Volatility → Cooling → Contraction
Real markets won't always follow that sequence neatly, but it can organize market analysis.
During price consolidation, BBW often moves lower. If price later leaves the range and bandwidth increases rapidly, the trader can see that the breakout is occurring alongside volatility expansion.
For example, a trader monitoring Bitcoin price data on Gate.com can compare live price action with previous consolidation periods. If BTC breaks above resistance while BBW rises, that combination says more than either observation alone.
It still doesn't guarantee continuation.
Price structure, volume and momentum can help confirm signals. MACD can provide information about trend and momentum, while the RSI indicator helps show the strength of recent upward and downward price changes.
BBW answers a different question: How much is volatility changing?
Bollinger Band Width vs. Bollinger Bands
Bollinger Bands and Bollinger Band Width use the same underlying calculation but present different information.
Bollinger Bands show price relative to a moving average and volatility-adjusted upper and lower bands. BBW strips away much of that directional context and focuses on the distance between the bands.
When price touches the upper band, it is relatively high compared with the current Bollinger structure and may sometimes be described as potentially overbought. A touch of the lower band places price relatively low within the structure.
Those aren't automatic reversal signals.
During a strong uptrend, price can repeatedly move along the upper band. During a strong downward trend, it can stay close to the lower band. Buying every lower-band touch or selling every upper-band touch can therefore generate false signals.
BBW has a narrower purpose. It measures whether volatility is contracting or expanding rather than telling traders where price sits inside the bands.
Combining Bollinger Band Width With Other Indicators
BBW is often more effective with other indicators because volatility alone doesn't answer every trading question.
BBW and Moving Averages
Moving averages can provide directional context.
A rising SMA indicator may indicate an established upward price trend, while a declining average may support a bearish interpretation. The EMA20 indicator reacts more quickly to recent price changes than a same-period SMA.
If BBW rises while price breaks higher above a rising moving average, volatility expansion is occurring alongside bullish price structure. If BBW rises while price trades below a falling moving average, the expansion may instead be occurring during a downward trend.
BBW and Momentum Indicators
Momentum indicators can help determine whether volatility expansion has directional strength.
Williams %R evaluates the closing price relative to its recent high-low range, while the Percentage Price Oscillator measures the percentage difference between moving averages.
Using different types of indicators can reduce duplication. Two volatility indicators may tell a trader similar things, while combining volatility, trend, and momentum analysis techniques can provide a more complete view.
BBW and Volume
Volume is another useful confirmation tool.
Suppose a market exits a long squeeze. BBW rises, price breaks resistance, and volume also increases. Those observations jointly indicate expanding volatility, directional movement, and increased participation.
If BBW rises but price repeatedly fails to hold beyond the breakout level, the trader may treat the move more cautiously.
Historical Price Data and Normalized Bandwidth
There is no universal BBW number that defines a squeeze for every market.
The more useful approach is usually to compare current normalized bandwidth with historical price data for the same asset and timeframe.
A BBW value that looks extremely low for Bitcoin might be ordinary for another cryptocurrency. Even the same market can behave differently on five-minute, four-hour, and daily charts.
If BBW falls to a multi-month or multi-year low, it indicates that volatility has become unusually compressed relative to that historical period. Such conditions can precede significant price movement, but the timing remains uncertain.
Chart patterns can make the setup easier to interpret. A low BBW occurring while price forms a triangle, rectangle, or clearly defined support-and-resistance range provides visible boundaries for potential price movements.
BBW identifies the compression. The chart pattern helps define where the market would need to move to establish a breakout.
Can High BBW Indicate an Overextended Market?
Extremely high BBW can show that volatility has expanded far beyond its recent norm.
Sometimes this appears late in a strong trend after several large price movements. Traders may then monitor whether price momentum is weakening or whether BBW begins to decline.
Still, high BBW isn't a reversal signal.
A market can sustain elevated volatility during strong trends, liquidations, news events, or shifts in market sentiment. Treating an extreme bandwidth reading as proof that price must reverse creates unnecessary market risk.
Potential reversal points should instead be evaluated through price action, support and resistance, momentum divergence, volume behavior, or other independent evidence.
False Signals and Other Bollinger Band Width Limitations
Bollinger Band Width works best when its role is kept narrow.
BBW does not predict direction. A squeeze can break upward or downward.
A tight squeeze can persist. Low volatility can remain low for longer than expected.
Volatility expansion doesn't guarantee trend continuation. Price can break from a range, push BBW higher, and then reverse.
The moving average period changes sensitivity. Short settings respond quickly but may create more noise. Longer settings smooth price data but react more slowly.
Default Bollinger Band settings aren't universal. The commonly used 20-period SMA and two-standard-deviation bands can be adjusted for different market conditions and trading styles.
High bandwidth doesn't automatically mean a reversal is near. Strong trends can maintain elevated volatility.
There's also a statistical misconception worth avoiding. Because standard Bollinger Bands use roughly two standard deviations around the moving average, they're sometimes described as containing about 95% of price observations. The 95% figure comes from properties of an ideal normal distribution. Financial market returns and rolling price data don't consistently follow that distribution, so traders shouldn't treat it as a guarantee that 95% of future prices will remain inside the bands.
Bollinger Bands are based on historical data, which makes them reactive rather than predictive. BBW can show clearly that volatility has changed, but it can't guarantee what happens next.
Conclusion
Bollinger Band Width is a normalized volatility indicator that measures the distance between the upper and lower Bollinger Bands relative to their middle moving average. Falling BBW signals volatility contraction, while rising BBW shows volatility expansion.
Its strongest practical use is identifying changes in market conditions, particularly squeezes and the transition from price consolidation toward larger price movements. A very tight squeeze can precede an explosive breakout, but neither the breakout's direction nor its success is known in advance.
That limitation is why BBW is often more effective with other indicators. Price trend, moving averages, volume, momentum, support and resistance, and chart patterns can help determine direction and confirm signals, while BBW focuses on the size of the volatility shift.
FAQ
What does Bollinger Band Width measure?
Bollinger Band Width measures how far apart the upper and lower Bollinger Bands are relative to the middle band. Rising BBW indicates volatility expansion, while falling BBW indicates volatility contraction.
What is normalized Bollinger Band Width?
Normalized bandwidth divides the difference between the upper and lower bands by the middle moving average, often multiplying the result by 100. This makes volatility easier to compare when an asset's price changes substantially over time.
What does a low Bollinger Band Width mean?
A low BBW reading indicates that recent price volatility has contracted and the bands have narrowed. If the reading is unusually low compared with historical values, the market may be in a Bollinger Band squeeze.
Does a tighter Bollinger Band squeeze produce a bigger breakout?
A tighter squeeze can precede a more powerful volatility expansion because price has been compressed into a narrower range. However, the relationship isn't guaranteed, and a tight squeeze cannot determine either breakout direction or how far price will ultimately move.
Does touching the upper Bollinger Band mean a market is overbought?
Not necessarily. Price at the upper band is relatively high within the current Bollinger structure and may appear potentially overbought, but strong uptrends can remain near the upper band for extended periods. Price behavior and other indicators are needed before treating it as a reversal signal.
Should Bollinger Band Width be used alone?
Generally, no. BBW measures the magnitude of volatility but not direction, so it is often more effective with other indicators such as moving averages, momentum oscillators, volume tools, and price-action analysis.
Disclaimer: This content is for educational purposes only and does not constitute financial or investment advice. Technical indicators can generate false signals, and historical price behavior does not guarantee future results.







