For traders comparing Bollinger Band Width vs. ATR, the choice therefore depends less on which indicator is "better" and more on what needs to be measured. Someone watching for a volatility squeeze may prefer Bollinger Band Width. Someone deciding whether a normal hourly price swing is $200 or $600 may get more useful information from ATR.
The distinction matters in crypto because volatility can change quickly. A narrow trading range can suddenly expand, while a high ATR can remain elevated during both strong rallies and steep downward movement. Neither indicator predicts future price direction. Used together with market structure, trading volume and trend tools, however, they can give a clearer view of whether volatility is contracting, expanding or already high.
Key Takeaways
-
Bollinger Band Width measures relative volatility by comparing the distance between the upper and lower Bollinger Bands with their middle band.
-
Average True Range measures actual price movement by averaging true range values, commonly over 14 periods.
-
Contracting Bollinger Bands are particularly useful for identifying volatility squeezes and possible breakout conditions.
-
ATR is commonly more useful for volatility-adjusted stops, position sizing and assessing the normal size of price swings.
-
Neither ATR nor Bollinger Band Width predicts direction. A volatility expansion can accompany either an upward or downward move.
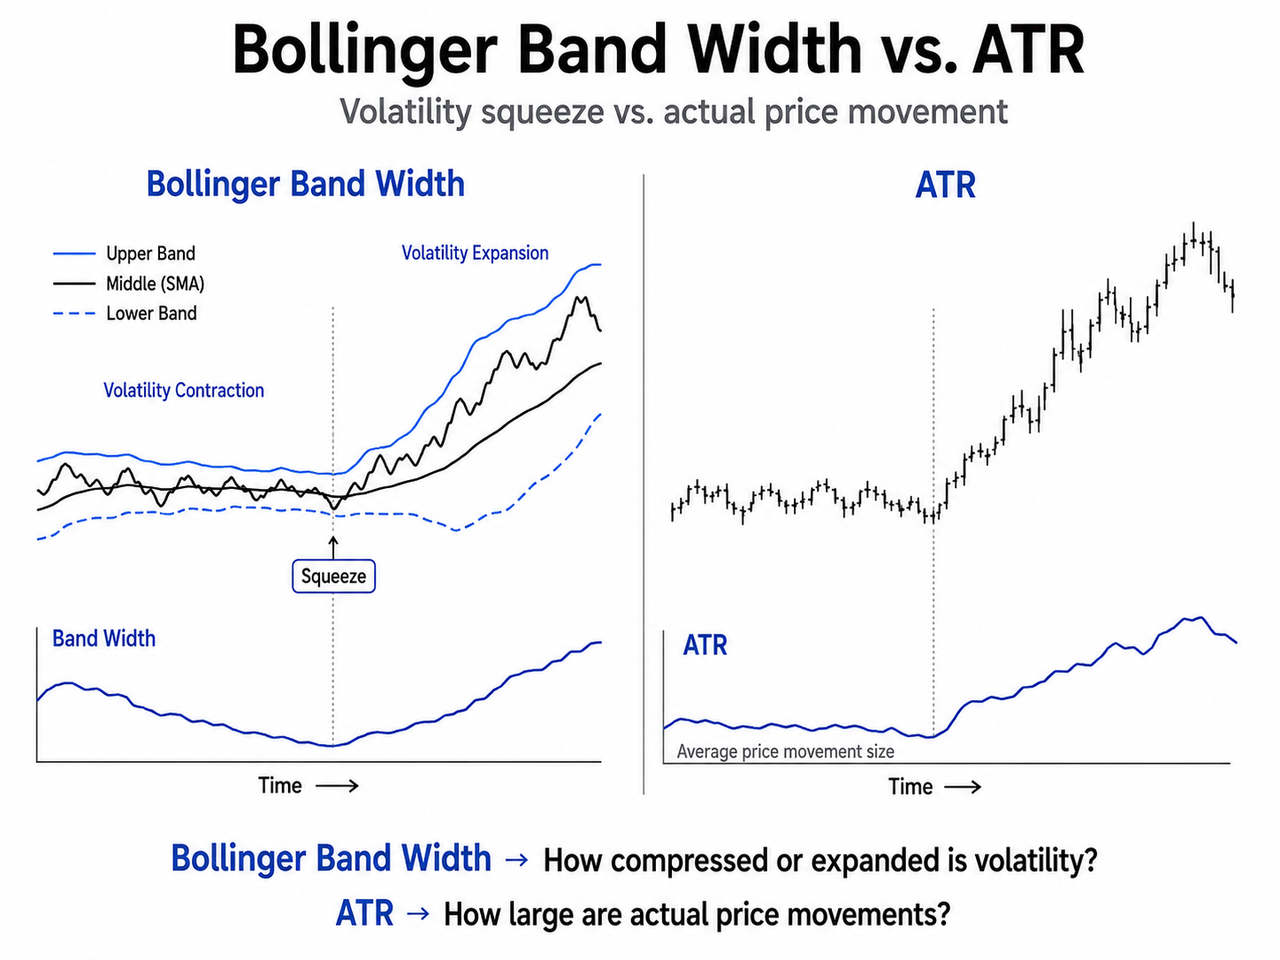
Bollinger Band Width vs. ATR: Which Is Better for Measuring Volatility?
For pure measurement of the magnitude of actual price movement, ATR has an advantage because it is based directly on each period's trading range and accounts for gaps relative to the previous closing price. For identifying whether volatility is unusually compressed or expanded relative to an asset's recent behavior, Bollinger Band Width is often more intuitive.
| Feature |
Bollinger Band Width |
Average True Range |
| Main purpose |
Relative volatility expansion/contraction |
Magnitude of price movement |
| Main inputs |
SMA and standard deviation |
High, low and previous close |
| Common setting |
20 periods, 2 standard deviations |
14 periods |
| Output |
Ratio or percentage |
Price units |
| Directional? |
No |
No |
| Strong use case |
Squeezes and breakout context |
Stops, sizing and range analysis |
| Reacts to gaps |
Indirectly through closing-price history |
Directly through true range |
| Rising value |
Bands are widening |
Price ranges are increasing |
| Falling value |
Bands are narrowing |
Price ranges are decreasing |
The indicators aren't competitors in the strict sense. They describe different aspects of volatility, which is why combining ATR and Bollinger Bands can often reveal more than using either as a single indicator.
How Bollinger Bands Measure Volatility
Bollinger Bands place an upper band and lower band around a moving average. A common configuration uses a 20-period simple moving average as the middle band, with the outer bands positioned two standard deviations above and below it.
In simplified form:
Middle Band = 20-period SMA
Upper Band = Middle Band + (2 × standard deviation)
Lower Band = Middle Band − (2 × standard deviation)
Standard deviation measures how dispersed recent closing prices are around their average. When that dispersion increases, the bands widen. When prices remain tightly clustered, the bands contract.
That's different from the ATR approach to volatility because Bollinger Bands measure the dispersion of historical price observations rather than averaging the actual high-low range of each candle.
The Bollinger Bands vs. Keltner Channels distinction makes this especially visible. Bollinger Bands use standard deviations, while modern Keltner Channels generally use ATR to determine the distance of their outer channel lines.
How Bollinger Band Width Is Calculated
Bollinger Band Width turns the visual distance between the upper and lower bands into a numerical volatility indicator:
Bollinger Band Width = (Upper Band − Lower Band) / Middle Band
Some platforms multiply the result by 100 to express it as a percentage. This normalization matters. A $1,000 band spread has a very different meaning for an asset trading at $10,000 than for one trading at $100,000.
Because the denominator adjusts for the underlying price level, Bollinger Band Width is particularly useful for comparing current volatility with historical volatility for the same market.
The related Bollinger %B indicator answers a different question. Band Width asks how wide the bands are, whereas %B measures where the current price sits between the lower Bollinger Band and upper band.
Contracting Bollinger Bands and the Volatility Squeeze
Bollinger Band Width becomes especially useful when it falls toward unusually low levels.
Suppose BTC has spent several sessions moving within progressively narrower ranges. Standard deviation declines, the upper and lower bands move closer together, and Band Width falls. Traders commonly describe this configuration as a Bollinger squeeze.
A squeeze doesn't predict direction. It indicates that volatility has contracted.
If Band Width then starts rising rapidly, the bands are expanding and a new volatility phase may be developing. Price might break upward, break downward or briefly move beyond the range before reversing. The indicator itself can't distinguish those outcomes.
That is why breakout context matters. Price structure, support and resistance, volume and directional technical indicators need to supply information that Band Width does not.
Donchian Channels, for example, define a range from recent highs and lows rather than standard deviations. A move beyond a Donchian boundary occurring alongside expanding Bollinger Band Width can give a trader a different view of the breakout than Band Width alone.
What Is Average True Range?
Average True Range, or ATR, is a non-directional volatility indicator developed by J. Welles Wilder. Rather than asking how dispersed closing prices are around a moving average, it estimates how much price has actually moved during recent periods.
For each candle, true range takes the largest of:
-
Current high minus current low
-
Absolute value of current high minus previous close
-
Absolute value of current low minus previous close
ATR then smooths those true range values. A 14-period setting is widely used, although charting platforms and trading strategies can use different lookback periods.
The Average True Range indicator therefore incorporates information that a simple high-low calculation could miss.
Imagine an asset closes at $100, opens the next period at $108 and trades between $107 and $110. Looking only at the $3 intraperiod range understates the move. True range can incorporate the distance from the previous $100 closing price.
This treatment of gaps is one reason ATR provides a more direct measure of actual price movement.
ATR vs. Bollinger Bands During High Volatility
When volatility increases sharply, both indicators will generally rise, but not necessarily at the same speed or for exactly the same reason.
Bollinger Band Width expands when recent closing prices become more dispersed around their moving average. ATR rises when true ranges become larger.
Consider a fast sell-off. Large candles and expanding intraperiod ranges could push ATR higher immediately. As closing prices also spread farther from their recent average, Bollinger Bands may widen substantially.
Neither signal means price must continue downward.
ATR simply says that average price movement is becoming larger. Bollinger Band Width says the statistical price envelope is expanding. Rising volatility is not trend direction.
The same readings can occur during an aggressive rally.
This is where directional tools such as the Relative Strength Index, MACD or price structure can add context. They don't eliminate false signals, but they answer questions the volatility indicators weren't designed to answer.
Why ATR Is Useful for Risk Management
ATR has a practical advantage when a trading strategy needs volatility expressed in price units.
Assume an asset is trading at $50 and ATR is $2. That tells the trader that recent true ranges have averaged roughly $2 over the chosen calculation period. If ATR increases to $4, typical movement has expanded substantially.
That information can affect stop placement.
A fixed $1 stop may sit comfortably outside ordinary market noise when ATR is $0.50 but be extremely tight when ATR is $4. ATR-based methods instead scale the distance with current market volatility, sometimes using multiples such as 1.5 ATR or 2 ATR depending on the strategy and risk tolerance.
Position sizing can use the same logic. Higher volatility generally means a given position can produce larger gains or losses for the same percentage move in capital exposure, so some risk frameworks reduce position size as ATR increases.
ATR doesn't determine the correct stop or position size on its own. Market structure, liquidity, leverage and maximum acceptable loss still matter.
Why Bollinger Band Width Is Better for Volatility Expansion and Contraction
Band Width has a different strength: regime detection.
A raw ATR value of 1,000 has little meaning without knowing whether the underlying asset trades at $10,000 or $100,000. Bollinger Band Width is normalized against its middle band, making changes easier to interpret in relative terms.
That makes sequences particularly useful:
Falling Band Width → volatility contraction
Historically low Band Width → unusually compressed conditions
Rising Band Width → volatility expansion
High Band Width → already elevated dispersion
There's no universal Band Width number that defines low volatility. Each asset and timeframe develops its own range. Traders therefore commonly compare the current reading with its own historical price data rather than applying one threshold across every financial market.
The catch is that Bollinger Band Width is based on Bollinger Bands settings and closing-price dispersion. Because ATR explicitly considers the previous close when calculating true range, it can represent gap-related movement more directly than a Band Width calculation based primarily on closing prices.
Using ATR and Bollinger Bands Together
Combining the two indicators can answer a more useful sequence of questions than asking ATR or Bollinger Bands to do everything.
Imagine an hourly BTC price chart.
Band Width has fallen for several sessions and is close to its recent lows. The Bollinger Bands contract tightly around the moving average. ATR is also declining.
Volatility is clearly compressed.
Price then breaks above the recent range. Band Width begins rising and ATR turns upward. Trading volume also expands.
Band Width tells the trader that the statistical envelope is widening. ATR confirms that actual price swings are getting larger. Price structure supplies direction, while volume can help assess market participation.
A trader using a live BTC/USDT perpetual market on Gate.com can apply the same process to current price charts rather than treating an old screenshot as representative of present market conditions.
There's still no guarantee the breakout will continue. A sharp move can generate expanding volatility indicators and then reverse.
Bollinger Bands Settings vs. ATR Settings
Parameter choices can materially change both indicators.
Standard Bollinger Bands commonly use 20 periods and two standard deviations. Shortening the lookback makes the bands react more quickly to recent price changes, while longer settings generally smooth the output. Adjusting the standard-deviation multiplier changes how far the upper and lower bands sit from the middle band.
ATR commonly uses 14 periods. Shorter lookbacks react faster to changes in true range; longer ones produce smoother readings.
Neither default is automatically optimal for every trading strategy.
An hourly chart, daily chart and highly volatile altcoin can behave very differently. Changing settings also changes the historical baseline, so comparing a 20-period Band Width reading with one generated using a different configuration can be misleading.
Limitations of Bollinger Band Width and ATR
Both volatility indicators are calculated from historical price data. They describe what price has been doing; they don't know what will happen next.
A volatility squeeze can persist much longer than expected. Bands can begin widening during a false breakout. ATR can spike after one unusually large candle and remain elevated even after the immediate move has passed.
Neither indicator identifies a price target.
Neither predicts direction.
And neither replaces market context.
Bollinger Bands themselves can sometimes be used to assess whether price is relatively high or low within its recent statistical envelope, but touching the upper band doesn't automatically mean overbought and touching the lower band doesn't automatically mean oversold. Momentum, trend direction and market structure can keep price close to one band for extended periods.
Using multiple technical analysis tools doesn't guarantee a better decision either. Adding several indicators that are derived from the same price data can simply duplicate information.
Bollinger Band Width vs. ATR: Which Should You Use?
Choose Bollinger Band Width when the main question is:
Is volatility contracting or expanding relative to recent conditions?
It is especially well suited to identifying contracting Bollinger Bands, volatility squeezes and transitions from quiet conditions into widening bands.
Choose ATR when the question is:
How large are recent price movements?
Its price-based output works naturally with stop-loss placement, position sizing and assessments of how much price typically moves during each period.
For broader volatility analysis, using both can be more informative. Bollinger Band Width describes the changing shape of price dispersion around a moving average; ATR measures the underlying size of true price ranges. Market structure and directional indicators then have to answer the question neither volatility tool can: which way is price actually moving?
Conclusion
There isn't a universal winner in Bollinger Band Width vs. ATR.
Bollinger Band Width is generally the stronger volatility tool for identifying compression, expansion and squeeze conditions because it measures how far the Bollinger Bands have spread relative to their middle band. ATR is more direct when the goal is to measure actual price movement and translate volatility into risk-management decisions.
Using them together separates two useful observations: whether volatility is changing and how large current price swings have become.
Neither should be treated as a prediction of future price direction. Volatility can expand upward or downward, and historical indicator behavior does not guarantee future market results.
FAQ
Is ATR better than Bollinger Bands for measuring volatility?
ATR is generally more direct for measuring the size of price movements because it averages true ranges and accounts for gaps relative to the previous close. Bollinger Bands and Band Width are more useful for viewing volatility as dispersion and identifying contraction or expansion around a moving average.
Does Bollinger Band Width predict a breakout?
No. Very low Bollinger Band Width identifies compressed volatility, which can precede a significant price move, but it does not guarantee that a breakout will occur or predict its direction. Price structure and other confirmation methods are still needed.
What happens when Bollinger Band Width and ATR both rise?
Both rising usually indicates increasing volatility. Band Width shows that the Bollinger Bands are expanding, while ATR shows that actual price ranges are becoming larger. The combination still doesn't reveal whether the market will rise or fall.
What is the normal ATR setting?
A 14-period ATR is commonly used. Traders may shorten or lengthen the calculation depending on the timeframe and how quickly they want the indicator to respond to changing market conditions.
Is Bollinger Band Width expressed as a percentage?
It can be. A common calculation divides the difference between the upper and lower Bollinger Bands by the middle band, producing a ratio that may then be multiplied by 100 and displayed as a percentage.
Can ATR and Bollinger Band Width be used together?
Yes. Bollinger Band Width can identify volatility compression and subsequent expansion, while ATR can confirm whether the actual magnitude of price movement is increasing. Combining them with market structure, volume and directional analysis provides more context than treating either as a standalone trading signal.
Disclaimer
This content is for educational and informational purposes only and does not constitute financial or investment advice. Technical indicators are derived from historical market data and may generate false or misleading signals. Cryptocurrency markets are volatile, and past indicator behavior does not guarantee future results.







