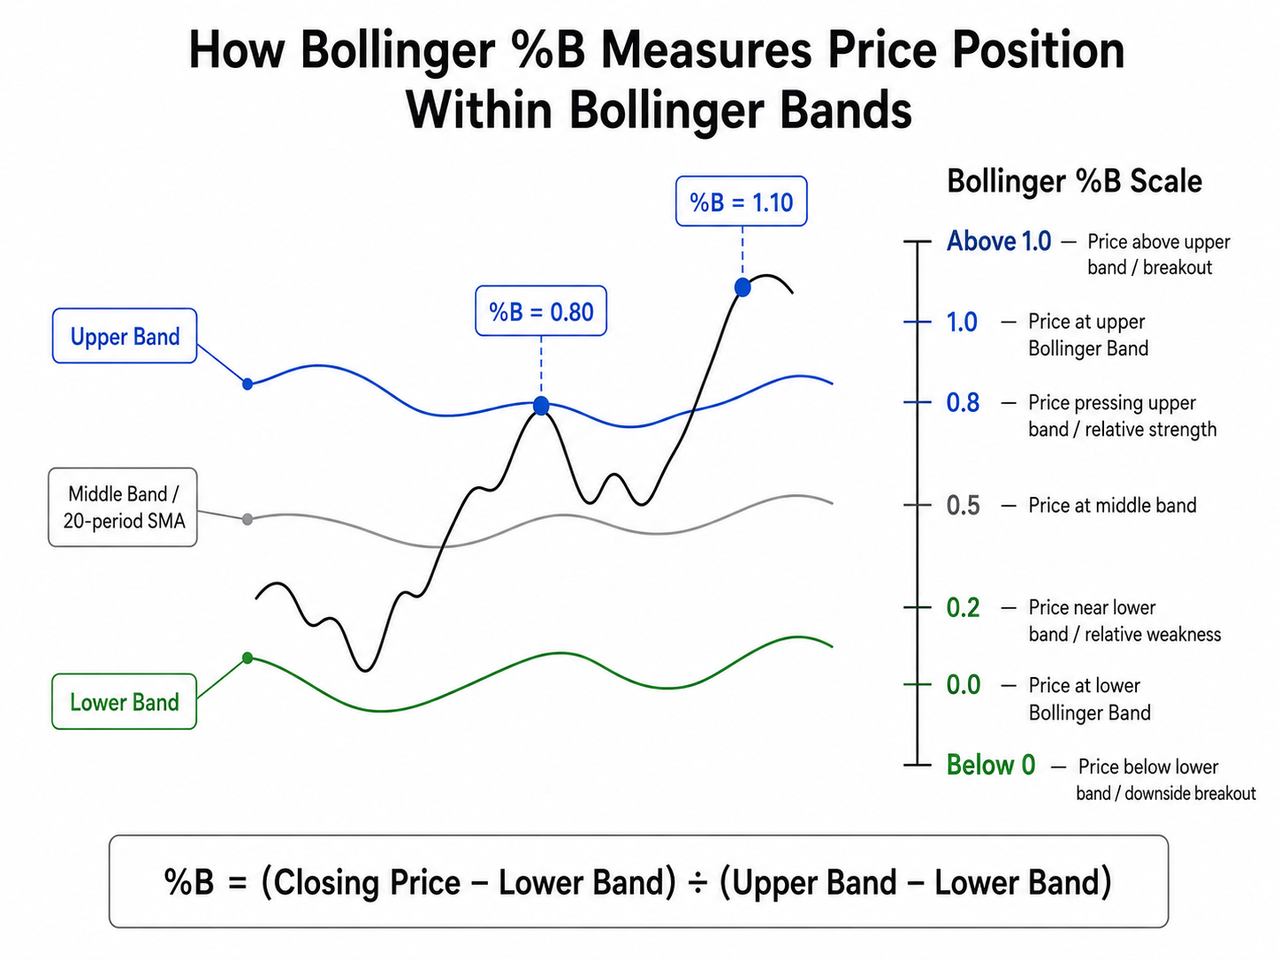
The Bollinger %B indicator measures exactly where an asset's closing price sits relative to its upper and lower Bollinger Bands. A reading of 1 means price is at the upper band, 0.5 places it at the middle band, and 0 means price is at the lower band. Values can also move above 1 or below 0 when price trades outside the bands.
That makes Bollinger %B useful for traders who already look at Bollinger Bands but want a cleaner way to quantify relative price position, extremes and possible breakouts. Instead of simply seeing that price is "near" a band, %B converts that relationship into a number that can be tracked over time, compared with price action and combined with momentum or volume indicators.
The catch is that a high %B reading doesn't automatically mean "sell," and a low reading doesn't automatically mean "buy." Strong trends can keep price near or beyond one band for extended periods. Understanding that distinction is important when using %B for entry points, exit points or broader market analysis.
Key Takeaways
Bollinger %B measures price relative to Bollinger Bands, with 1 representing the upper band, 0.5 the middle band and 0 the lower band.
Values above 1 show price above the upper Bollinger Band; readings below 0 show price below the lower Bollinger Band.
Readings around 0.80–1.00 can reflect upper-band strength, while readings around 0–0.20 show price pressing the lower Bollinger Bands.
Extreme readings may accompany overbought or oversold conditions, but they can also signal trend continuation rather than an immediate reversal.
%B works better as part of a trading strategy that includes trend, momentum, volume and risk management rather than as a standalone signal.
What Is Bollinger %B Indicator and How Does It Measure Price Position Within Bollinger Bands?
Bollinger %B, often written %B, is a technical indicator derived directly from Bollinger Bands. John Bollinger created %B to express the location of price within the bands numerically. His official Bollinger Band rules describe %B as a way of showing where price is in relation to the bands and highlight uses including divergences, pattern recognition and systematic trading.
Suppose the lower Bollinger Band is $90, the upper band is $110 and the closing price is $100:
%B = ($100 − $90) ÷ ($110 − $90) = 0.50
Price is therefore exactly halfway between the upper and lower bands.
If price rises to $110, %B becomes 1. If price reaches $114 while the bands remain at $90 and $110, %B becomes 1.20, showing that price has moved above the upper band.
This normalization is the main advantage of the B indicator. A trader doesn't need to compare several absolute price levels manually. The relative position is reduced to one value.
How Bollinger Bands Create the %B Indicator
To understand %B, it helps to understand the three lines underneath it. Bollinger Bands developed by John Bollinger typically consist of a middle moving average plus an upper and lower band positioned according to recent price volatility. John Bollinger's official material describes the tool as a way to determine whether prices are relatively high or low, rather than as fixed overbought and oversold boundaries.
A common configuration uses:
Middle Band = 20-period simple moving average
Upper Band = Middle Band + (2 × standard deviation)
Lower Band = Middle Band − (2 × standard deviation)
The simple moving average indicator smooths historical price data to represent the middle line, while standard deviation determines how far the upper and lower Bollinger Bands sit from it.
Gate Learn's overview of technical indicators for crypto price analysis similarly describes the common Bollinger Bands setup as a middle SMA with outer bands based on two standard deviations. When market volatility rises, the bands generally become wider; when volatility falls, they become narrower.
That changing width matters. Bollinger %B doesn't measure volatility directly. It measures price position inside a volatility-adjusted range. Bollinger BandWidth is the related tool designed specifically to quantify how wide the bands are.
How to Read Bollinger %B Values
%B becomes easier to use when its readings are treated as locations rather than automatic trading signals.
%B Reading
Price Position
Common Interpretation
Above 1.00
Above upper band
Breakout, unusually strong price move or extreme
1
At upper band
Upper Bollinger Band
0.80–1.00
Near upper band
Relative strength / upper-band pressure
0.5
At middle band
Price at moving average
0.20–0.50
Lower half of bands
Relative weakness
0–0.20
Near lower band
Lower-band pressure
0
At lower band
Lower Bollinger Band
Below 0
Below lower band
Downside breakout or extreme weakness
These levels describe where price is, not what price must do next.
A %B value above 1 indicates that the security's price has broken above the upper band. Below 0, price has dropped beneath the lower Bollinger Band. Because the calculation isn't mathematically restricted to a 0–1 range, strong price movements can produce much higher or lower readings.
Upper and Lower Bollinger Bands: Overbought, Oversold or Trend Strength?
One of the most common mistakes with Bollinger Bands is assuming that every touch of the upper band represents an overbought condition and every touch of the lower band represents an oversold condition.
Sometimes that interpretation works in ranging markets. It becomes far less reliable during strong trends.
If %B repeatedly stays around 0.80–1.00 while price makes higher highs, the market may be showing sustained buying strength. A price move above the upper band can become part of a strong uptrend rather than an immediate reversal signal. The same principle works in the opposite direction: sustained readings near 0 may accompany a strong downtrend.
John Bollinger's own rules caution against treating a tag of an upper or lower band as a signal by itself. Relative highs and lows become more useful when combined with other indicators for confirmation.
For example, RSI can add momentum context. If %B pushes above 1 while RSI and price structure remain strong, the move may be better interpreted as a breakout than as a simple overbought reversal. If price reaches a new high while momentum weakens, the setup deserves a different reading.
Using %B for Breakouts and Bollinger Band Squeezes
%B can become particularly useful after a period of low volatility.
When volatility decreases, Bollinger Bands contract and produce narrower bands. This condition is commonly called a Bollinger Band squeeze. Gate Learn notes that band contraction can indicate consolidation before volatility expands again, although the squeeze itself doesn't predict whether the eventual significant price move will be upward or downward.
%B helps make the next price move easier to quantify.
Imagine that price has spent several sessions around %B readings of 0.40–0.60 while Bollinger BandWidth contracts. A sudden move to %B 1.05 shows that price has crossed the upper Bollinger Band. If trading volume expands at the same time and the underlying trend is positive, traders may interpret the combination as stronger breakout confirmation.
A move below 0 after the same low-volatility setup would signal a downside break instead.
%B identifies price location. BandWidth describes volatility compression. Volume indicators, momentum oscillators and price structure can help judge whether the breakout has support.
Using Bollinger %B With Other Indicators for Confirmation Signals
Combining technical indicators works best when each tool answers a different question.
%B answers: Where is price relative to its volatility envelope?
RSI asks whether recent gains or losses dominate momentum. MACD focuses more on the relationship between moving averages and changing momentum, while ADX can help assess trend strength.
This separation reduces duplicated signals.
Consider a strong upward price trend where %B reaches 1.10. Selling solely because price is above the upper band could put a trader in the opposite direction of the prevailing move. If ADX points to a strong trend and MACD remains constructive, an upper-band breakout has different implications than the same reading in a flat, ranging market.
Momentum extremes can also be compared with Williams %R, which tracks the closing price within a recent high-low range rather than within volatility-adjusted Bollinger Bands.
In practice, a trader studying an actual market can open the BTC/USDT market on Gate.com, apply Bollinger Bands to the chart and compare %B-style price positioning with volume, momentum and the overall trend. Gate's official API documentation confirms BTC/USDT and ETH/USDT among its supported spot-market structures.
Bollinger %B Divergence and Market Analysis
%B can also highlight divergence between relative price position and the price trend.
Suppose Bitcoin makes a higher price high. On the first high, %B reaches 1.15. On the second, price is higher but %B peaks at only 0.92. Price has advanced, yet its position relative to the volatility envelope has weakened.
That doesn't confirm a reversal. It does show that the second move isn't stretching the bands as strongly as the first.
The opposite pattern can occur during downward movement. Price may form a lower low while %B forms a higher low, suggesting that downside pressure relative to the bands is decreasing.
This is conceptually similar to momentum divergence. The difference is that %B compares price against an adaptive volatility range rather than directly measuring momentum.
Historical Price Data, Market Conditions and False Signals
Bollinger %B is built entirely from historical price data, so its behavior changes with the moving average period, number of standard deviations and current volatility regime.
Parameter choices matter. Shorter settings react more quickly to price movements but may generate false signals more often. Longer settings generally produce smoother bands but can respond more slowly to significant price moves.
There's also an important statistical misconception. Two standard deviations are associated with roughly 95% coverage in a normal distribution, but that shouldn't be interpreted as a rule that 95% of market prices must stay inside Bollinger Bands. John Bollinger states that, in practice, the default bands typically contain closer to 90% rather than 95% of observations.
Crypto markets can also move sharply outside the bands during high volatility. An extreme %B value is therefore information about unusual relative price location, not proof that mean reversion must follow.
Risk Management When Trading With the B Indicator
%B can help identify potential entry or exit points, but it doesn't define risk tolerance, position size or invalidation levels.
A trader buying simply because %B falls below 0 may face continued losses if the market enters a strong downtrend. Likewise, automatically selling whenever %B exceeds 1 can repeatedly fight a powerful upward trend.
Price action, support and resistance, volume, the overall trend and other technical analysis tools can help confirm signals. Traders should also define where a trading idea becomes invalid before entering a position rather than relying on the indicator to provide every trading decision.
Past performance and historical indicator behavior don't guarantee future results.
Conclusion
Bollinger %B turns price position within Bollinger Bands into a simple numerical reading. A value of 1 places price at the upper band, 0.5 at the middle moving average and 0 at the lower band, while readings outside that range identify price moves beyond the bands.
Its strongest use isn't predicting reversals from every extreme. %B is more useful for distinguishing relative price strength and weakness, quantifying breakouts, identifying divergences and observing whether price repeatedly presses one side of the Bollinger Bands during strong trends.
Market conditions still determine the interpretation. In ranging markets, extremes may support mean-reversion analysis. During strong trends, sustained extreme readings can instead represent continuation. Combining %B with trend identification, momentum, volume, chart patterns and risk management provides more context than treating upper or lower band touches as standalone trading signals.
FAQ
What does Bollinger %B measure?
Bollinger %B measures a security's closing price relative to its upper and lower Bollinger Bands. It converts that position into a normalized value, making relative price location easier to compare over time.
What does a Bollinger %B reading of 0.5 mean?
A %B reading of 0.5 means price is at the middle Bollinger Band, which is commonly a 20-period simple moving average under default Bollinger Band settings.
What does Bollinger %B above 1 mean?
A reading above 1 means price has moved above the upper Bollinger Band. That can represent an extreme price move, but during a strong uptrend it may also indicate breakout strength or trend continuation rather than an immediate reversal.
Is Bollinger %B overbought above 0.80?
Readings above 0.80 show that price is pressing toward the upper portion of the bands, but they aren't automatically overbought sell signals. Trend strength, momentum and broader market conditions should be considered before interpreting an extreme.
What does Bollinger %B below 0 mean?
%B below 0 means price has moved beneath the lower Bollinger Band. It can signal unusually strong downward movement, a downside breakout or a potential oversold extreme, depending on market conditions.
Is Bollinger %B better than Bollinger BandWidth?
They measure different things. %B measures where price sits within the bands, while Bollinger BandWidth measures how wide the bands are and therefore focuses on volatility expansion or contraction. Using both can show where price is positioned and what the surrounding volatility regime looks like.
Disclaimer:This content is for educational purposes only and does not constitute financial or investment advice. Technical indicators can generate false signals, and historical price behavior does not guarantee future market performance.
Author: Jared
Disclaimer
* The information is not intended to be and does not constitute financial advice or any other recommendation of any sort offered or endorsed by Gate.
* This article may not be reproduced, transmitted or copied without referencing Gate. Contravention is an infringement of Copyright Act and may be subject to legal action.
DEX aggregators integrate order data, price information, and liquidity pools from multiple decentralized exchanges, helping users find the optimal trading path in the shortest time. This article delves into 8 commonly used DEX aggregators, highlighting their unique features and routing algorithms.
The report shows that in Q1 2026, the crypto market will reach a stage of structural maturity, with Derivative trading making up more than 90% of total trading volume, exceeding $20 trillion. As Spot demand weakens, liquidity will become even more concentrated in top exchanges, reflecting a more cautious market sentiment and a shift toward leveraged and institutional trading.