For traders comparing volatility indicators, the useful question isn't simply whether price touches a band. Keltner Channels can show whether volatility is expanding or contracting, whether price remains within its normal trend range, and whether movement beyond a channel could represent a breakout, an unusually extended market, or both.
That distinction matters to crypto traders, forex traders, commodity markets participants, and anyone studying technical analysis because high volatility can change the meaning of a price move. The sections below connect the calculation to breakouts, overbought and oversold readings, market risk, Bollinger Bands, broader volatility measures, and practical chart use. No indicator can forecast price patterns reliably on its own.
Key Takeaways
-
Keltner Channels normally combine a 20-period EMA with Average True Range to create dynamic upper and lower boundaries.
-
The modern EMA-and-ATR formulation was popularized by trader Linda Bradford Raschke, building on Chester Keltner's earlier channel concept.
-
Increasing ATR widens the bands, indicating greater market volatility; declining ATR produces narrower channels.
-
Closing above the upper channel is commonly interpreted as bullish strength, while closing below the lower channel can indicate bearish strength.
-
Outer-band moves can also identify potentially overbought and oversold levels, but strong trends can remain near or outside a band longer than expected.
What Is Keltner Channels Indicator?
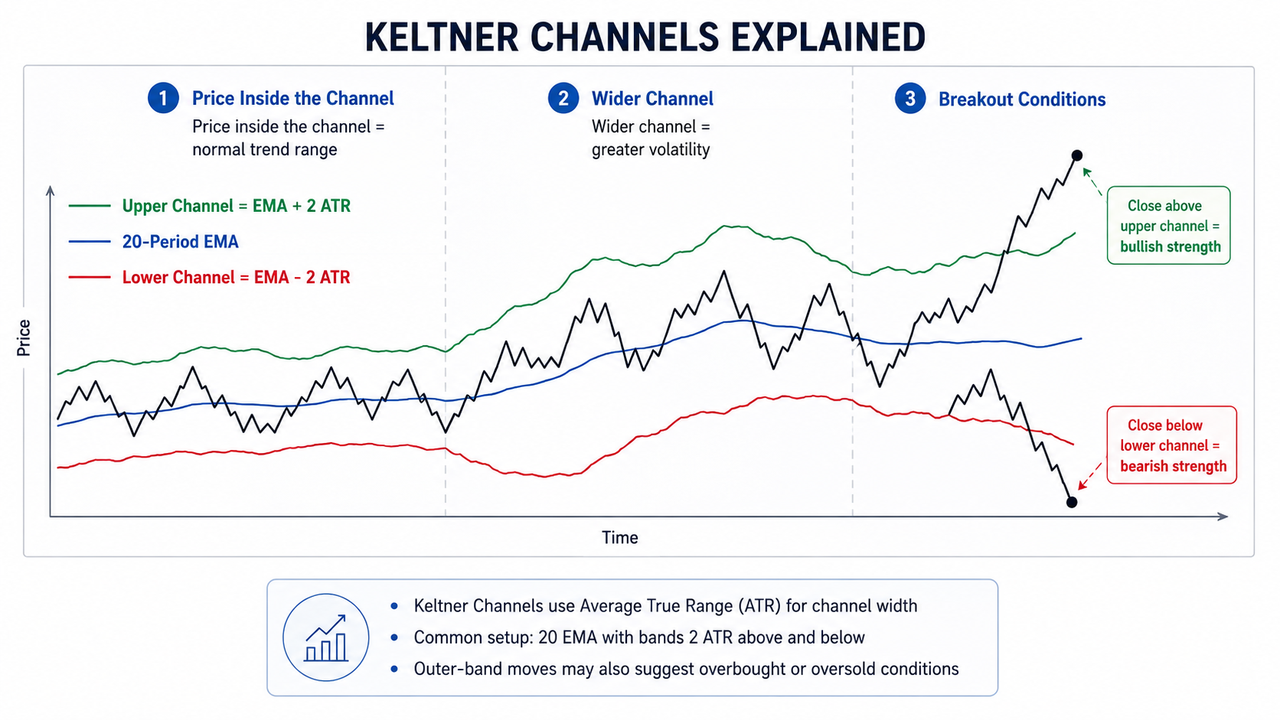
Keltner Channels combine a moving average with a volatility measure. The central line tracks the direction of price, while the outer bands adjust as the asset's recent trading range changes.
The original channel concept came from commodity trader Chester Keltner. Linda Bradford Raschke later popularized the version widely used today, with an exponential moving average at the center and ATR multiples forming the bands.
A typical calculation is:
Middle Line = 20-period EMA
Upper Channel Line = EMA + (2 × ATR)
Lower Channel Line = EMA − (2 × ATR)
The lower band is therefore placed below the middle line by the same ATR multiple used to position the upper band above it. Different trading software may allow traders to change both the EMA period and ATR multiplier.
For example, if the EMA is $100 and ATR is $4, a two-ATR setting places the upper band around $108 and the lower band around $92. If ATR increases to $6 while the EMA stays at $100, the channel expands to approximately $112 and $88.
That wider range represents greater market volatility, not a prediction about direction.
How the Average True Range Indicator Measures Price Movement
The Average True Range indicator is central to how Keltner Channels track volatility. ATR measures the size of price movement over time and accounts for gaps by using true range rather than simply subtracting each period's low from its high.
When ATR rises, recent price ranges have become larger. The Keltner bands move farther from the EMA, indicating greater market volatility. When ATR falls, the distance contracts and signals lower market volatility.
ATR itself doesn't indicate whether prices should rise or fall. It measures volatility. That's why the combination works: the EMA tracks market trends, while ATR determines how wide the expected trading range around that trend has recently been.
A period of steady high volatility can therefore produce consistently broad Keltner Channels. More steady high volatility doesn't automatically mean market risk has peaked, however. Volatility measures price behaviour, while market risk also depends on liquidity, leverage, position size, fundamental events, and other conditions.
How Volatility Indicators Traders Identify Volatility
Different volatility indicators measure different things, so the best volatility indicators depend on the question being asked.
Keltner Channels use historical volatility derived from price ranges. Bollinger Bands use standard deviation. The Chaikin Volatility indicator demonstrates another approach by examining changes in the high-low trading range, while tools such as Twiggs Volatility also belong to the range-based volatility family.
The Relative Volatility Index, meanwhile, applies an oscillator-style framework to volatility. None should automatically replace another.
Broader market indices require a different interpretation. The Chicago Board Options Exchange's VIX measures near-term market volatility expectations implied by S&P 500 option prices. It is designed around expected 30-day volatility rather than the historical range of an individual stock, cryptocurrency, or commodity.
A rising VIX can signal increased market risk or uncertainty, while a falling reading is often associated with calmer expectations. But falling market risk shouldn't automatically be treated as proof of reasonable economic growth, nor does a VIX market risk peak predict an exact stock-market bottom.
Keltner Channels are much narrower in purpose: they help measure price movement around an individual asset's existing trend.
Using Upper and Lower Keltner Channels for Breakouts
A price close above the upper channel line is commonly treated as evidence of bullish strength. A close below the lower channel may signal bearish pressure. Keltner's original methodology also used moves outside channel boundaries as directional signals.
The catch is that an outside close can mean different things under different market conditions.
Suppose Bitcoin has been trading above a rising EMA and repeatedly testing the upper channel. Another close above that boundary may indicate trend continuation rather than an immediate reversal. If price instead jumps above the channel after a long sideways period and quickly moves back inside, the breakout may have failed.
That is why volatility indicators traders often compare channel signals with support or resistance levels, volume, and tools for measuring market strength. ADX can help assess trend strength, while RSI provides a separate momentum reading.
For a live example, a trader can use the BTC/USDT market on Gate.com, apply Keltner Channels through the available trading tools, and compare channel behaviour with actual trading prices and volume rather than relying on a static chart example.
Can Keltner Channels Identify Overbought and Oversold Levels?
Yes, Keltner Channels are sometimes used to identify overbought and oversold levels, but the interpretation is conditional.
Price moving above the upper band can indicate that an asset is unusually extended relative to its recent ATR-based range. Price below the lower band can indicate the opposite. Gate Learn's existing Keltner material also describes these outer-band moves as possible overbought and oversold conditions.
Still, traders shouldn't automatically short an upper-band break or buy a lower-band break. During strong trends, price can remain near an outer channel for multiple periods.
Momentum indicators can add context. Williams %R compares the latest close with its recent high-low range, while MACD tracks trend and momentum through moving averages.
Keltner Channels vs. Bollinger Bands
Trading software often displays Keltner Channels and Bollinger Bands in a similar three-line format, but they calculate volatility differently.
| Feature |
Keltner Channels |
Bollinger Bands |
| Middle line |
Usually EMA |
Usually SMA |
| Band distance |
Average True Range |
Standard deviation |
| Volatility basis |
Trading range |
Price dispersion |
| Behaviour |
Generally smoother |
Often more responsive to sudden dispersion |
| Common use |
Trend range and breakouts |
Volatility extremes and squeezes |
Bollinger Bands conventionally place their bands around a simple moving average using standard deviation, whereas Keltner Channels use ATR. This tends to make Keltner Channels visually smoother when price volatility changes sharply.
Bollinger Band Width isolates band expansion and contraction, while Bollinger %B shows where a stock's price differs relative to the upper and lower Bollinger boundaries.
Neither channel system is universally superior. Volatility indicators traders pick should match the information they actually need.
Keltner Channels in Volatility Trading and Market Analysis
Keltner Channels can be applied to crypto, equities, forex, futures, and commodity markets where suitable historical price data exists. Gate Learn also notes their use across cryptocurrencies, stocks, futures, and forex.
They can be particularly useful when traders want to track volatility alongside direction instead of viewing a standalone ATR number. Expanding channels reveal how pronounced price changes have become; contracting channels reveal quieter conditions.
The indicator does not directly track market indices, implied volatility, or upcoming market-moving events. Traders exploring broader volatility trading may therefore compare individual-asset channels with market indices such as the VIX, while recognising that the two measure different things.
On a trading platform, Keltner Channels may sit among other charting or market-analysis trading tools. The exact menu structure varies, so a main menu or market analysis section shouldn't be treated as part of the indicator itself. Likewise, CFD trading platforms and retail investor accounts may expose users to leverage and product-specific risks that have nothing to do with whether the Keltner signal is technically valid.
A financial markets course may teach channel indicators alongside volatility, momentum, and trend systems, but practical use still requires understanding how the chosen platform calculates and displays the indicator.
Limitations and Market Risk
Keltner Channels use historical data. They cannot know about upcoming market-moving events, guarantee informed trading decisions, or reliably forecast price patterns.
Parameter selection also matters. Narrower ATR multiples create more channel breaks, while wider bands filter more movements. Low-volatility sideways markets can produce false signals, and sudden shocks may move trading prices before ATR has fully adjusted.
Short selling volatility or trading breakouts can introduce additional risk, especially when leverage is involved. Traders should review the relevant platform's risk disclosure notice, understand whether losses can exceed expected levels for the product being used, and avoid assuming that technical signals guarantee trading success.
Keltner Channels can support more informed trading decisions by organizing price, trend, and historical volatility into one visual framework. They don't remove market risk.
Conclusion
Keltner Channels track volatility and trend range by placing ATR-based boundaries around an exponential moving average. The EMA helps identify the existing market trend; the Average True Range determines how far the upper and lower bands sit from it.
Expanding bands indicate greater recent volatility, while contracting bands point to lower volatility. A close above the upper channel can signal bullish strength, and a close below the lower channel can signal bearish strength. The same boundaries may also highlight potentially overbought or oversold conditions.
Their strongest use is contextual. Keltner Channels help traders see whether a price move is ordinary relative to recent volatility or unusually pronounced, but momentum, trend strength, support and resistance, liquidity, and broader market conditions still matter.
FAQ
Who popularized the modern Keltner Channels calculation?
Linda Bradford Raschke popularized the modern approach that plots bands at ATR multiples around an exponential moving average. The original channel concept came from Chester Keltner.
What are the standard Keltner Channels settings?
A commonly used setup is a 20-period EMA with the upper channel two ATR values above the EMA and the lower channel two ATR values below it. Settings can be adjusted by timeframe, asset, and trading method.
Does a close above the upper Keltner Channel mean bullish?
It commonly indicates bullish price strength, especially when the EMA is rising and the broader trend supports the move. It does not guarantee that the breakout will continue.
Can Keltner Channels show overbought and oversold conditions?
Yes. Price beyond the upper or lower channel can be interpreted as an unusually extended condition, but strong trends can remain extended. The signal should therefore be interpreted alongside market structure and other indicators.
Are Keltner Channels smoother than Bollinger Bands?
Generally, yes. Keltner Channels use ATR for band width, whereas Bollinger Bands use standard deviation, which tends to react more strongly to sudden changes in price dispersion.
Do Keltner Channels measure implied volatility?
No. Their volatility input comes from historical price ranges through ATR. The VIX is different: it derives expected S&P 500 volatility from option prices.
Disclaimer: This content is for educational purposes only and does not constitute financial or investment advice. Technical indicators are based on historical market data and cannot guarantee future price movements or trading results.







