For traders focused on volatility, day trading, short-term trading, or systematic trend following, the appeal is straightforward: Donchian Channels turn raw price data into visible boundaries. A tight channel shows that price hasn't traveled far between its recent extremes; a wider channel reflects larger price movements.
The limitation matters just as much. Donchian Channels depict past price changes. They don't directly measure trend strength or momentum, and sideways markets can generate false breakouts. Choosing an appropriate time period and confirming signals with other technical indicators can therefore be as important as the breakout itself.
Key Takeaways
-
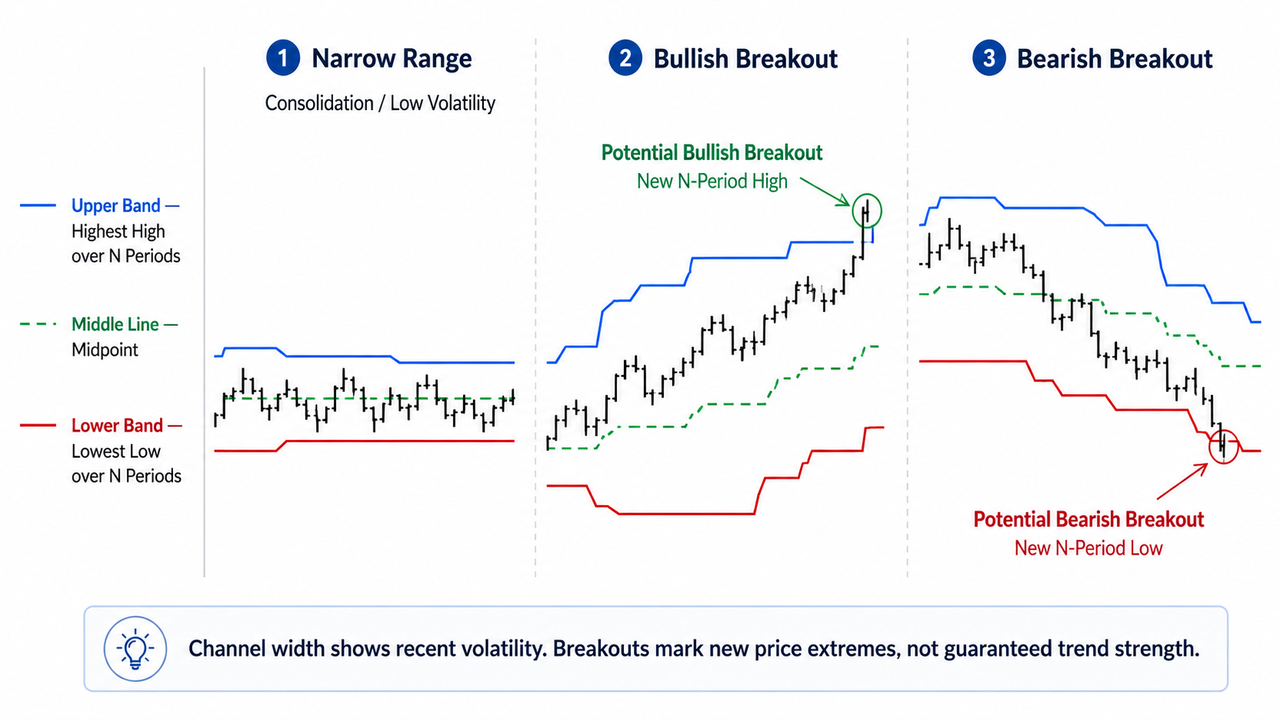
Donchian Channels consist of an upper band, lower band, and middle line based on recent price extremes.
-
The upper band tracks the highest price over N periods, while the lower band tracks the lowest price.
-
A narrow range generally signals lower recent volatility or consolidation; widening channels show expanding price movement.
-
Price breaks above or below the channel can identify potential breakouts, but they don't guarantee a new trend.
-
Sideways markets can create false signals, so Donchian Channels shouldn't be relied on alone.
Richard Donchian, Larry Williams and the Origins of Donchian Channels
The Donchian Channels indicator was created by American futures trader Richard Donchian, an early pioneer of rules-based trend following who became widely known as the “Father of Trend Following.” His work helped establish systematic approaches based on following sustained market trends rather than attempting to predict every turning point.
Donchian shouldn't be confused with Larry Williams, another influential technical trader whose work includes momentum and volatility-based trading methods. The Donchian Channel itself is attributed to Richard Donchian.
A 20-period setting is commonly used as the default. On a traditional daily chart, 20 trading days roughly represents a month of market activity, but there is nothing inherently optimal about that number for every asset or time frame.
How Donchian Channels Calculate the Upper Band, Lower Band and Middle Line
The calculation is deliberately simple:
Upper Band = Highest High over N Periods
Lower Band = Lowest Low over N Periods
Middle Line = (Upper Band + Lower Band) ÷ 2
Suppose an asset's highest price during the previous 20 periods is $70,000 and its lowest price is $62,000. The upper channel sits at $70,000, the lower channel at $62,000, and the middle line at $66,000.
As new price data enters the specified period, older data drops out. The channel changes whenever a new highest point or lowest point appears, or when an old extreme leaves the calculation window.
Unlike a simple moving average, which averages prices across a time period, Donchian Channels are determined by bullish and bearish extremes.
How Donchian Channels Measure Volatility and a Narrow Range
Channel width gives traders a visual measure of volatility.
When the highest price and lowest price move closer together, the upper and lower bands contract. A narrow range generally indicates that price has been consolidating or experiencing comparatively low volatility.
When the bands move farther apart, price has covered a larger range. Widening Donchian Channels therefore indicate increasing recent market volatility.
The catch is that volatility isn't direction. A tight range may eventually produce a large price move, but Donchian Channels can't predict whether that move will be bullish or bearish.
The Average True Range indicator approaches the same problem differently by measuring true-range movement rather than plotting price extremes. Bollinger Band Width converts changing Bollinger Band width into a separate volatility measurement.
Support and Resistance Levels: Reading the Upper and Lower Band
The upper channel can act as a dynamic resistance level because it represents the highest price recorded during the chosen period. The lower channel can provide a corresponding support level because it represents the lowest low.
Unlike manually drawn support and resistance levels, these boundaries update automatically as the lookback period changes.
The middle line can also be useful. Some traders treat it as a trend filter, take-profit reference, or indication of whether market price remains in the upper or lower half of its recent range.
None of these lines guarantees that price will reverse when it reaches them.
Trading Donchian Channels for Potential Breakouts
The classic Donchian trading strategy focuses on price breaking an established extreme.
When price closes above the previous upper band, it has reached a new N-period high. Traders may interpret that as a potential buy signal or evidence of an emerging bullish trend.
A close below the previous lower band creates a new N-period low. Depending on market conditions and risk tolerance, that can indicate bearish pressure or a potential sell position or short position where short selling is available.
In practice, price closing outside the channel can carry more information than briefly crossing it. A candle may trade above resistance during the period and fall back before closing, producing a false breakout.
For example, a trader can monitor the BTC/USDT market on Gate while applying a Donchian Channel to the same time frame. If BTC closes above its prior upper channel, the trader can then examine whether trend strength, momentum, volume, and broader price structure point in the same direction.
An indicator such as ADX can help assess trend strength, while Williams %R adds momentum and overbought/oversold context that Donchian Channels don't provide.
Number of Periods for Day Trading and Longer Time Frames
The effectiveness of Donchian Channels depends heavily on the number of periods selected.
Shorter settings react more quickly to price moves and may suit day trading or other short-term trading strategies. They also make it easier for relatively small moves to create new highs or lows, increasing the possibility of false signals.
Longer settings create broader, slower-moving channels. A more substantial move may therefore be required before price reaches an outer band.
A 20-period Donchian Channel on a five-minute chart measures a very different market window from a 20-period channel on a daily chart. The default setting should be treated as a starting convention, not a universal trading rule.
Donchian Channels vs. Bollinger Bands and Moving Average Channels
Donchian Channels and Bollinger Bands may look similar, but their calculations measure different aspects of price behavior.
Donchian Channels use the highest high and lowest low. Bollinger Bands use a moving average surrounded by bands calculated from standard deviation, so they measure price dispersion around an average rather than absolute N-period extremes.
The Bollinger %B indicator goes a step further by expressing where price sits relative to the Bollinger Bands.
Keltner Channels use a different channel-building method again, commonly combining a moving average with Average True Range-based boundaries.
For pure breakout identification, Donchian Channels have a useful simplicity: reaching an outer line means price has challenged a recent extreme.
Stop Loss, Opposite Band Exits and False Breakouts
Some trend-following approaches use an opposite band or shorter Donchian Channel as a trailing stop-loss mechanism. A long position entered after an upper-band breakout, for example, could remain open until price reaches a defined lower-channel exit.
There's a tradeoff. A wide stop can give a strong trend room to fluctuate, but it also increases the distance price can move against the position before an exit. Position size and individual risk tolerance still matter.
The biggest weakness appears in sideways markets. Price may repeatedly cross recent highs and lows without developing a strong trend, creating whipsaws and false breakouts. Because Donchian Channels are lagging technical indicators derived from historical price data, they can't determine whether enough momentum exists to sustain the next price move. Their simplicity makes them useful, but it can also lead to overreliance.
Conclusion
Donchian Channels are most useful as a volatility, price-range, and breakout framework based on recent market extremes. The upper band identifies the highest high, the lower band identifies the lowest low, and the middle line marks their midpoint.
Narrowing channels show that the market has moved into a tighter range; widening channels indicate expanding volatility. Breaking the upper or lower channel can flag an emerging trend, but it doesn't confirm trend strength or predict how long the move will last.
For traders using technical analysis tools systematically, Donchian Channels can make breakout and stop-loss rules easier to define. Trend strength, momentum, price structure, appropriate period selection, and risk management still need to do the work that the channel itself can't. Historical indicator signals don't guarantee future trading results.
FAQs
What is the best setting for Donchian Channels?
The 20-period setting is the most common default for Donchian Channels, but it isn't automatically the best setting for every market or trading strategy. Shorter periods respond faster and generate more signals, while longer periods produce wider, slower-moving channels that may filter some short-term market noise.
Are Donchian Channels good for day trading?
Donchian Channels can be used for day trading, particularly when traders want objective levels for identifying breakouts from a recent price range. Short intraday settings can react quickly, though the tradeoff is a higher risk of false breakouts when price moves sideways or liquidity is thin.
What does a narrow Donchian Channel mean?
A narrow Donchian Channel means the distance between the highest high and lowest low over the selected period has decreased. It generally reflects lower recent volatility or consolidation. Traders sometimes watch these tight ranges for potential breakouts, but narrowing alone doesn't indicate which direction price will move.
What happens when price breaks above the upper Donchian Channel?
A break above the upper band means price has exceeded the highest point recorded during the selected lookback period. Trend-following traders may interpret a confirmed close above that level as a potential bullish breakout or buy signal. It still needs context because price can quickly return inside the channel and create a false breakout.
What does a break below the lower band indicate?
When price breaks below the lower band, it has reached a new lowest low for the selected number of periods. That can indicate increasing bearish pressure and may be treated as a potential sell signal in some trading systems. Donchian Channels alone can't determine whether the bearish move will develop into a strong trend.
Do Donchian Channels measure momentum?
No. Donchian Channels measure price range and help visualize volatility by tracking recent price extremes; they don't directly measure momentum or trend strength. Momentum indicators such as RSI or Williams %R and trend-strength tools such as ADX can provide different information when traders want additional confirmation.
Disclaimer
This content is provided for educational and informational purposes only and does not constitute financial, investment, trading, or other professional advice. Technical indicators, including Donchian Channels, are based on historical price data and cannot predict future market movements with certainty. Cryptocurrency markets can be highly volatile, and traders should consider their own risk tolerance and conduct independent research before making trading decisions.







