#RobinhoodChainRevenueFallsFor5ConsecutiveDays
I’m watching this Robinhood Chain number closely — because at first glance, it looks much worse than the underlying activity actually is.
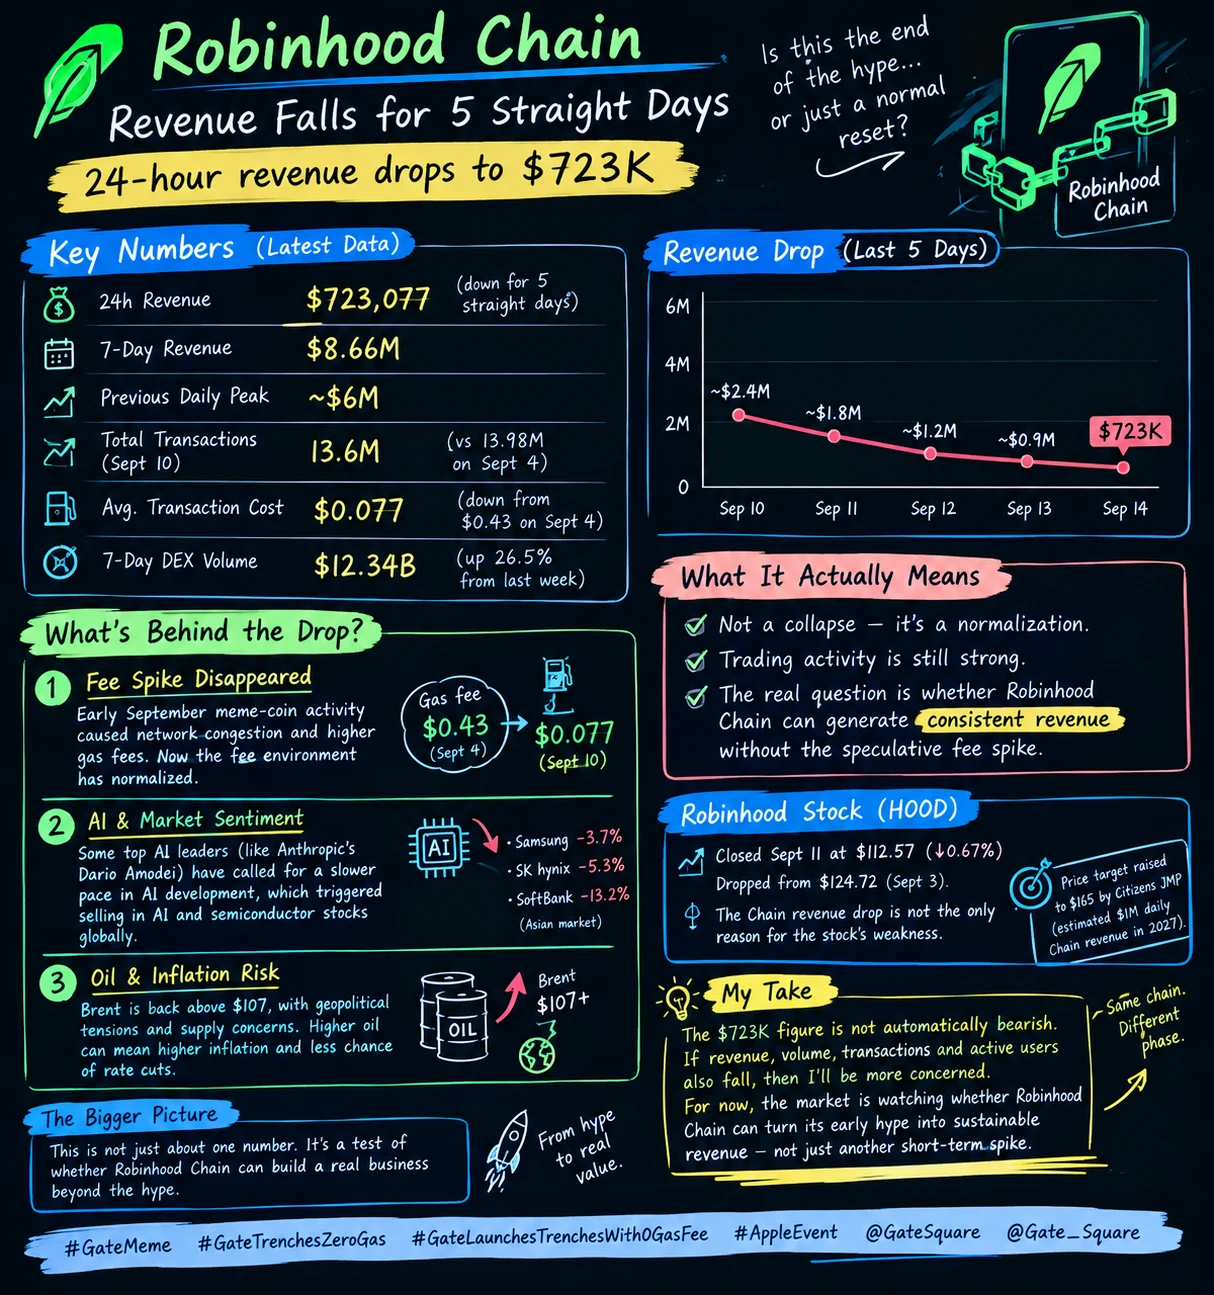
Robinhood Chain revenue has now fallen for five consecutive days, reaching just $723,077 over the latest 24-hour period. That puts revenue below $1 million for the fourth consecutive day. Over the last seven days, the chain generated about $8.66 million, while its previous daily peak was around $6 million.
That is a massive change from the beginning of September.
But here is the part I think traders should not miss:
Revenue is falling much faster than network activity.
Earlier data showed Robinhood Chain generating about $5.44 million in gas revenue on September 4. By September 10, that had fallen to $943,728 — an 82.6% decline from the peak. Yet the network processed roughly 13.6 million transactions on September 10 versus 13.98 million on September 4, only around a 3% difference.
So what actually happened?
The fee spike disappeared.
Robinhood Chain is an Ethereum Layer-2 network built using Arbitrum technology, and its revenue is strongly influenced by the amount users pay for blockspace.
During the early-September meme-coin activity, the network became much more congested and transaction costs increased dramatically.
The average transaction cost reached around $0.43 at the September 4 peak.
By September 10, it had dropped to approximately $0.077.
That means the chain can still process millions of transactions while generating considerably less revenue from each transaction.
And there is another number that makes the situation even more interesting.
Despite the revenue decline, seven-day DEX volume reached approximately $12.34 billion through September 10, up 26.5% from the previous week.
So I don't read the current data as:
“Nobody is using Robinhood Chain anymore.”
I read it as:
“The extraordinary fee environment has cooled down.”
That is a very different story.
But there is still a risk
Robinhood Chain launched its mainnet on July 1, and the network has attracted huge attention because of tokenized stocks, DeFi and meme-coin activity.
According to company operating data, Robinhood's broader crypto trading volume also increased 61% month-over-month in August to $17.5 billion, although that was still 38% below August 2025's $28.1 billion.
Robinhood's own August operating report also says Chain revenue is shared with launch partners, with Robinhood retaining 50% of sequencer revenue until approximately $50 million, then 70% until approximately $150 million, and 85% above that level.
That matters because the market is not just watching whether Robinhood Chain can generate huge headline revenue for a few days.
Investors ultimately want to know:
Can the network generate durable revenue when the speculative fee spike disappears?
What about Robinhood's stock price?
This is where I would be careful.
HOOD closed September 11 at $112.57, down 0.67% that day, after falling from $124.72 on September 3.
But I would not say the $723K Chain-revenue figure directly caused HOOD to fall.
There are too many moving parts in Robinhood's valuation.
In fact, the market has recently received positive news around the Chain as well. Citizens JMP raised its Robinhood price target to $165 from $155, estimating the Chain could eventually contribute around $1 million of net revenue per day in its 2027 forecasts.
So the current price weakness looks more complicated than one revenue number.
My opinion
Personally, I don't think the $723K figure is automatically bearish for Robinhood Chain.
What would concern me is something different:
If revenue keeps falling and DEX volume, transactions, active users and liquidity start falling together, then I would consider that a much stronger warning.
Right now, the data doesn't show that.
Revenue has collapsed from the September peak, but trading activity has remained surprisingly strong.
That tells me the first question is not:
“Why did Robinhood Chain revenue crash?”
It is:
“Can Robinhood Chain maintain meaningful economic activity after the fee market normalizes?”
That is the real test.
The September spike proved that the network can generate enormous revenue when activity and gas demand explode.
Now the market gets to see whether it can build something more important:
consistent revenue without needing another speculative frenzy.
For me, that's the metric worth watching next.
Volume can attract attention.
Transactions can create activity.
But sustainable revenue is what ultimately builds a business.
And Robinhood Chain is entering that test right now.
Market analysis only — not financial advice.
#GateMeme #GateTrenchesZeroGas #AppleEvent @GateSquare @Gate_Square
I’m watching this Robinhood Chain number closely — because at first glance, it looks much worse than the underlying activity actually is.
Robinhood Chain revenue has now fallen for five consecutive days, reaching just $723,077 over the latest 24-hour period. That puts revenue below $1 million for the fourth consecutive day. Over the last seven days, the chain generated about $8.66 million, while its previous daily peak was around $6 million.
That is a massive change from the beginning of September.
But here is the part I think traders should not miss:
Revenue is falling much faster than network activity.
Earlier data showed Robinhood Chain generating about $5.44 million in gas revenue on September 4. By September 10, that had fallen to $943,728 — an 82.6% decline from the peak. Yet the network processed roughly 13.6 million transactions on September 10 versus 13.98 million on September 4, only around a 3% difference.
So what actually happened?
The fee spike disappeared.
Robinhood Chain is an Ethereum Layer-2 network built using Arbitrum technology, and its revenue is strongly influenced by the amount users pay for blockspace.
During the early-September meme-coin activity, the network became much more congested and transaction costs increased dramatically.
The average transaction cost reached around $0.43 at the September 4 peak.
By September 10, it had dropped to approximately $0.077.
That means the chain can still process millions of transactions while generating considerably less revenue from each transaction.
And there is another number that makes the situation even more interesting.
Despite the revenue decline, seven-day DEX volume reached approximately $12.34 billion through September 10, up 26.5% from the previous week.
So I don't read the current data as:
“Nobody is using Robinhood Chain anymore.”
I read it as:
“The extraordinary fee environment has cooled down.”
That is a very different story.
But there is still a risk
Robinhood Chain launched its mainnet on July 1, and the network has attracted huge attention because of tokenized stocks, DeFi and meme-coin activity.
According to company operating data, Robinhood's broader crypto trading volume also increased 61% month-over-month in August to $17.5 billion, although that was still 38% below August 2025's $28.1 billion.
Robinhood's own August operating report also says Chain revenue is shared with launch partners, with Robinhood retaining 50% of sequencer revenue until approximately $50 million, then 70% until approximately $150 million, and 85% above that level.
That matters because the market is not just watching whether Robinhood Chain can generate huge headline revenue for a few days.
Investors ultimately want to know:
Can the network generate durable revenue when the speculative fee spike disappears?
What about Robinhood's stock price?
This is where I would be careful.
HOOD closed September 11 at $112.57, down 0.67% that day, after falling from $124.72 on September 3.
But I would not say the $723K Chain-revenue figure directly caused HOOD to fall.
There are too many moving parts in Robinhood's valuation.
In fact, the market has recently received positive news around the Chain as well. Citizens JMP raised its Robinhood price target to $165 from $155, estimating the Chain could eventually contribute around $1 million of net revenue per day in its 2027 forecasts.
So the current price weakness looks more complicated than one revenue number.
My opinion
Personally, I don't think the $723K figure is automatically bearish for Robinhood Chain.
What would concern me is something different:
If revenue keeps falling and DEX volume, transactions, active users and liquidity start falling together, then I would consider that a much stronger warning.
Right now, the data doesn't show that.
Revenue has collapsed from the September peak, but trading activity has remained surprisingly strong.
That tells me the first question is not:
“Why did Robinhood Chain revenue crash?”
It is:
“Can Robinhood Chain maintain meaningful economic activity after the fee market normalizes?”
That is the real test.
The September spike proved that the network can generate enormous revenue when activity and gas demand explode.
Now the market gets to see whether it can build something more important:
consistent revenue without needing another speculative frenzy.
For me, that's the metric worth watching next.
Volume can attract attention.
Transactions can create activity.
But sustainable revenue is what ultimately builds a business.
And Robinhood Chain is entering that test right now.
Market analysis only — not financial advice.
#GateMeme #GateTrenchesZeroGas #AppleEvent @GateSquare @Gate_Square