
#ShareYourUSStocksWinNvidia
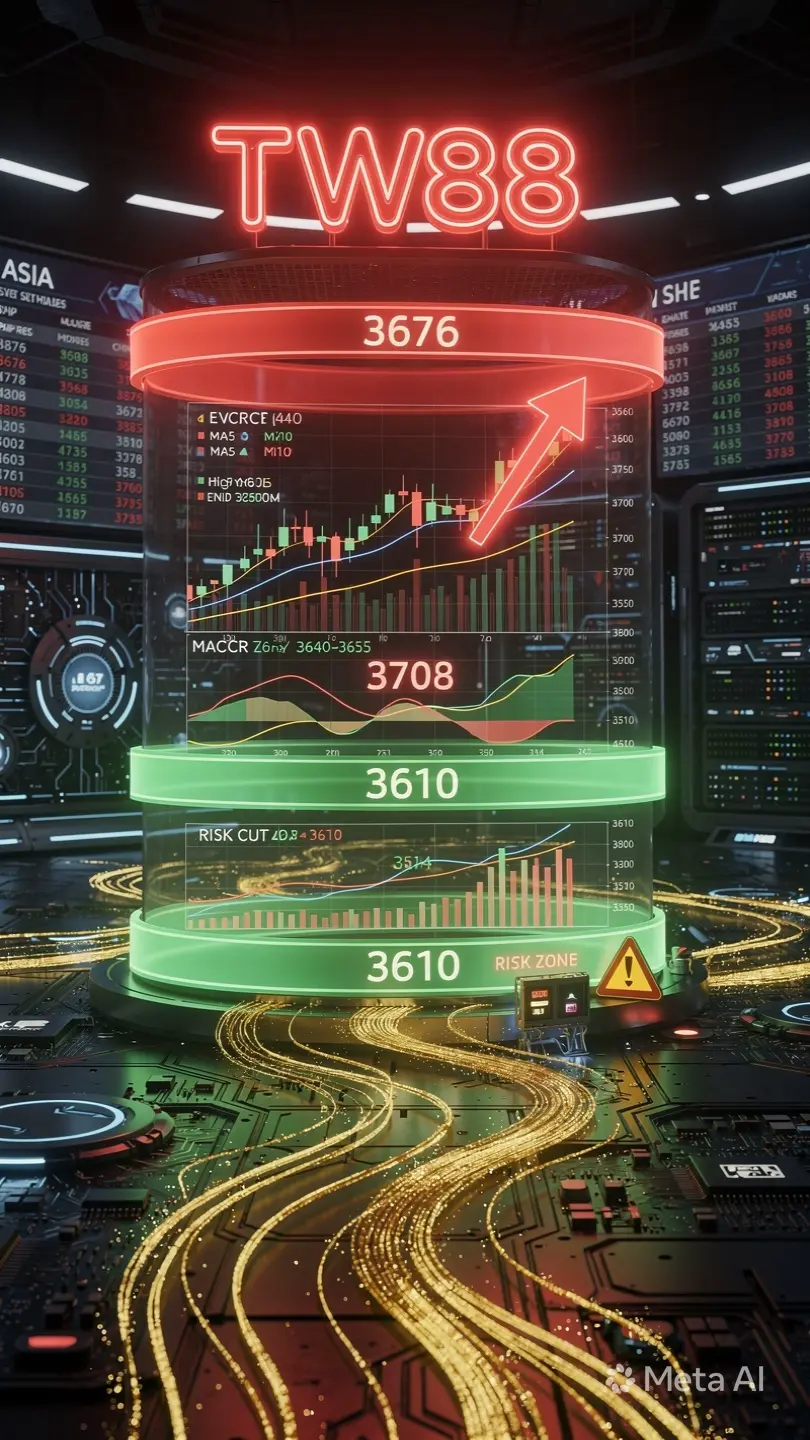
#TW88
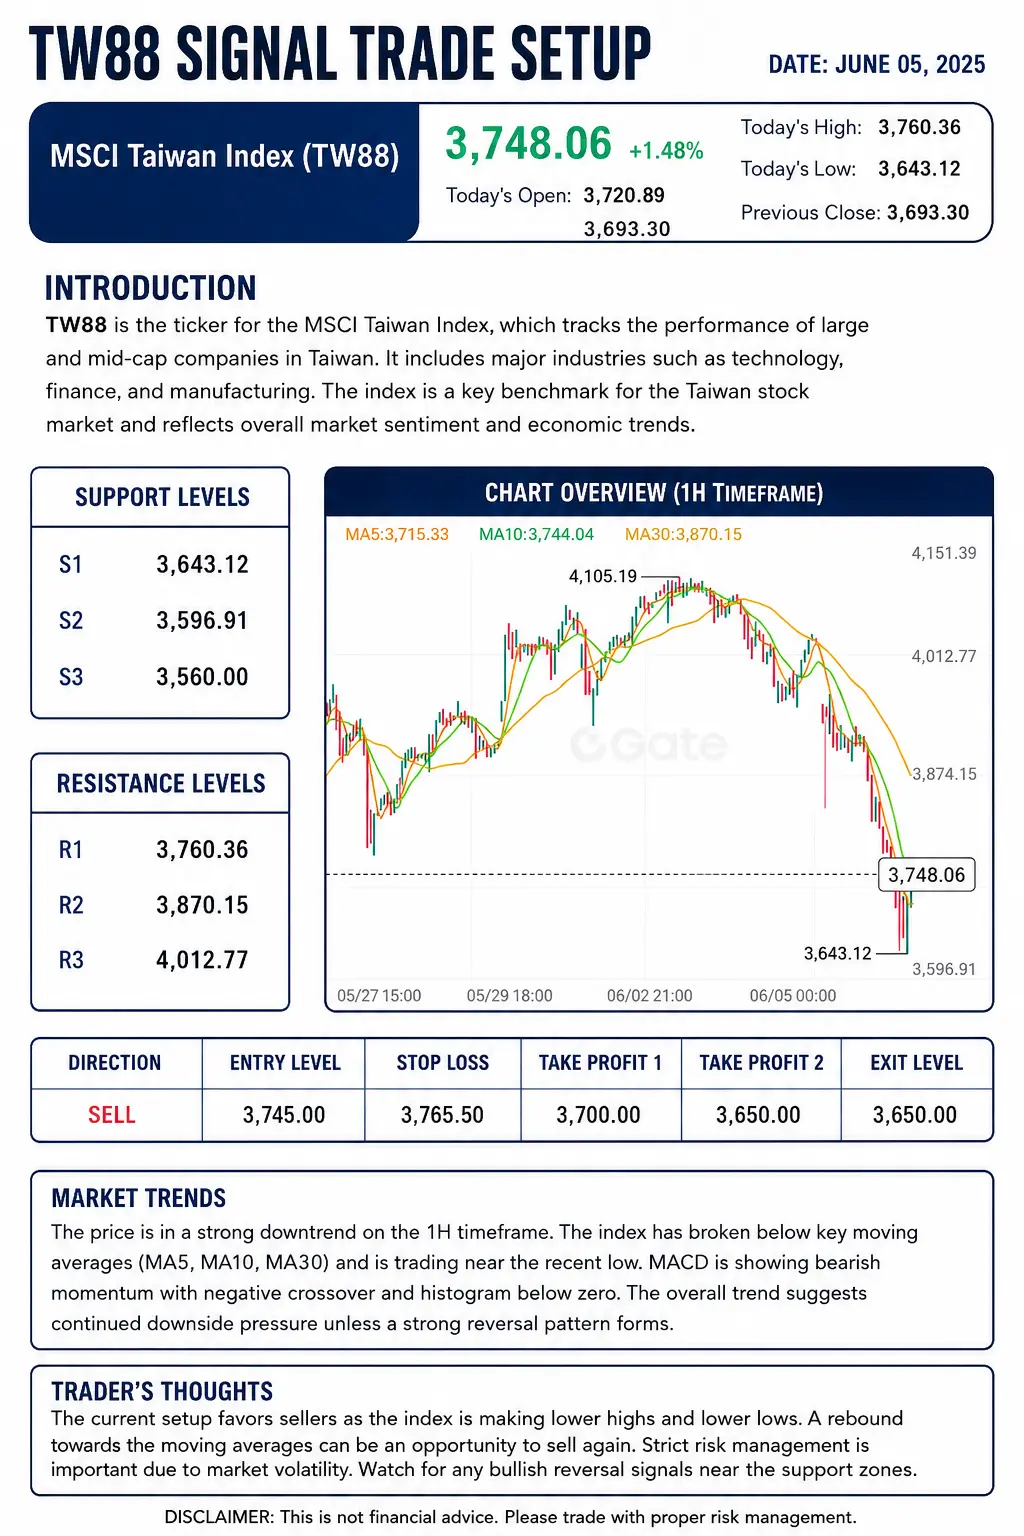
TW88 SIGNAL TRADE SETUP
INTRODUCTION
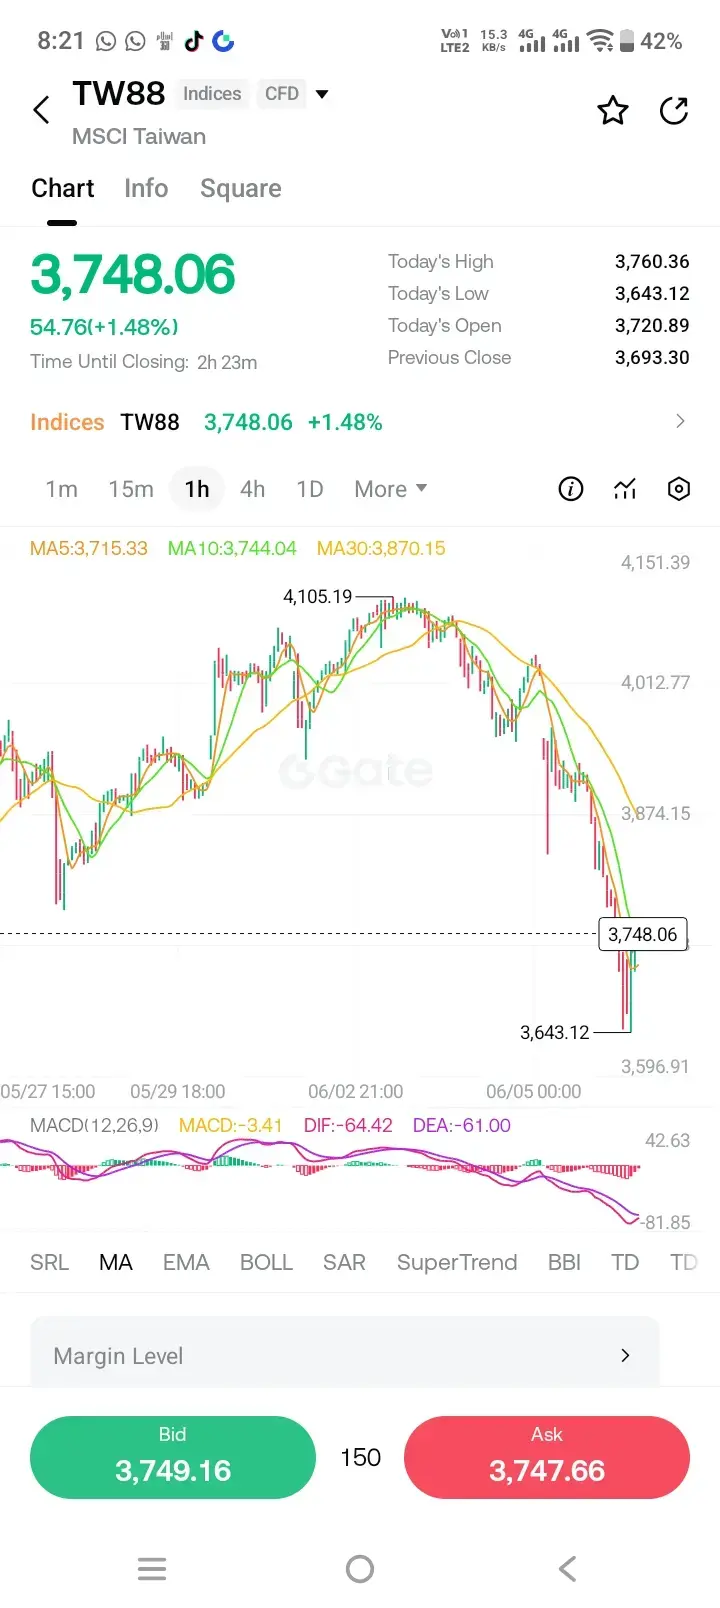
TW88 is the ticker for the MSCI Taiwan Index. It tracks the performance of large and mid cap companies listed in Taiwan across major sectors such as technology, finance and manufacturing. It is widely used as a benchmark for overall Taiwan equity market performance and reflects broader risk sentiment in Asian markets.
CURRENT_PRICE
3748.06
MARKET STRUCTURE
The index is currently showing mixed to slightly bearish pressure on the 1H timeframe. Price recently faced rejection from higher levels near 3760 and is now trading around MA10 at 3744. The structure shows weakening momentum after a previous rally, with price fluctuating between moving averages and showing signs of distribution.
SUPPORT_LEVELS
S1 3643.12
S2 3596.91
S3 3560.00
RESISTANCE_LEVELS
R1 3760.36
R2 3870.15
R3 4012.77
ENTRY_LEVEL
SELL ZONE 3745.00 TO 3755.00
STOP_LOSS
3765.50
TAKE_PROFIT
TP1 3700.00
TP2 3650.00
EXIT_LEVEL
3650.00
MARKET_TRENDS
The market is currently ranging with bearish bias after failing to sustain above short term resistance. MA5 and MA10 are flattening while MA30 remains higher, indicating overall pressure from broader trend but short term consolidation. MACD suggests weakening bullish momentum and potential continuation of downside if support breaks.
TRADERS_THOUGHTS
Traders are likely watching for rejection near resistance zones to continue short positions. However, caution is needed as price is near short term support areas and a false breakdown or reversal bounce can occur. Risk management is essential due to volatile intraday swings and mixed momentum conditions.
#TW88
TW88 SIGNAL TRADE SETUP
INTRODUCTION
TW88 is the ticker for the MSCI Taiwan Index. It tracks the performance of large and mid cap companies listed in Taiwan across major sectors such as technology, finance and manufacturing. It is widely used as a benchmark for overall Taiwan equity market performance and reflects broader risk sentiment in Asian markets.
CURRENT_PRICE
3748.06
MARKET STRUCTURE
The index is currently showing mixed to slightly bearish pressure on the 1H timeframe. Price recently faced rejection from higher levels near 3760 and is now trading around MA10 at 3744. The structure shows weakening momentum after a previous rally, with price fluctuating between moving averages and showing signs of distribution.
SUPPORT_LEVELS
S1 3643.12
S2 3596.91
S3 3560.00
RESISTANCE_LEVELS
R1 3760.36
R2 3870.15
R3 4012.77
ENTRY_LEVEL
SELL ZONE 3745.00 TO 3755.00
STOP_LOSS
3765.50
TAKE_PROFIT
TP1 3700.00
TP2 3650.00
EXIT_LEVEL
3650.00
MARKET_TRENDS
The market is currently ranging with bearish bias after failing to sustain above short term resistance. MA5 and MA10 are flattening while MA30 remains higher, indicating overall pressure from broader trend but short term consolidation. MACD suggests weakening bullish momentum and potential continuation of downside if support breaks.
TRADERS_THOUGHTS
Traders are likely watching for rejection near resistance zones to continue short positions. However, caution is needed as price is near short term support areas and a false breakdown or reversal bounce can occur. Risk management is essential due to volatile intraday swings and mixed momentum conditions.