Square
Following
Hot
News
Profile

CryptoPatel

vip
Active for: 3.3y
Peak Tier 0
No content yet
0
Following
415
Followers
1.8k
Liked
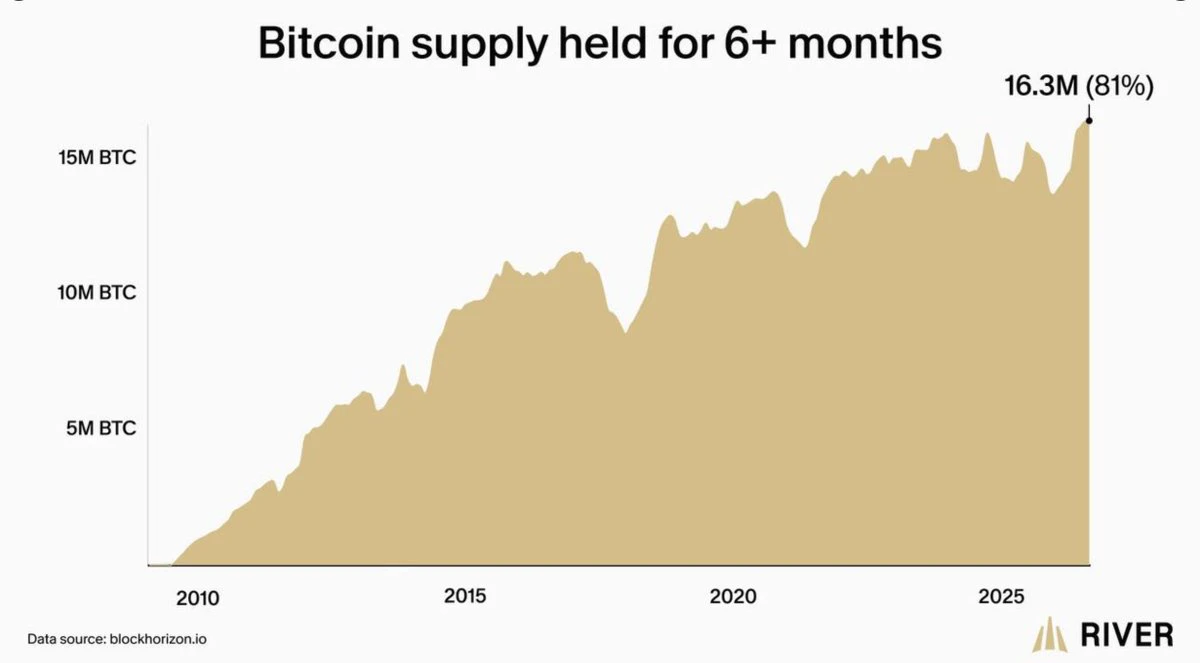
81% Of The Bitcoin Supply Around 16.3M $BTC Has Not Moved In More Than 6 Months.
Long-Term Holders Have Added 3M+ BTC Since 2020, While Only ~300K BTC Moved Out Of Older Wallets In H1 2026.
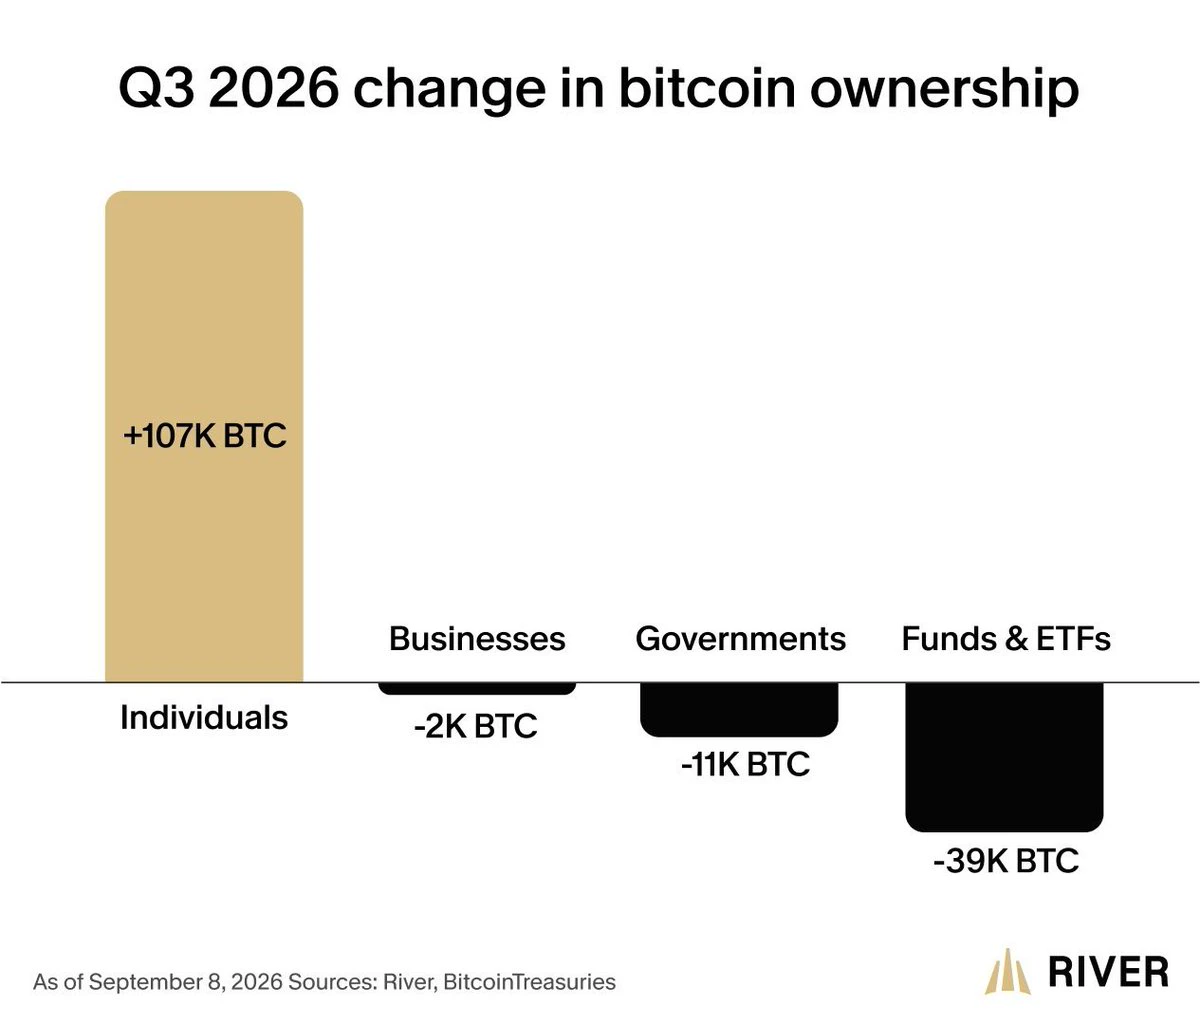
Retail Sold ~140K BTC In H1, Then Bought Back 107K+ BTC In Q3.
Less Liquid Supply + Strong Holder Accumulation = A Major $BTC Supply Squeeze To Watch.
post-image
BTC+0.07%
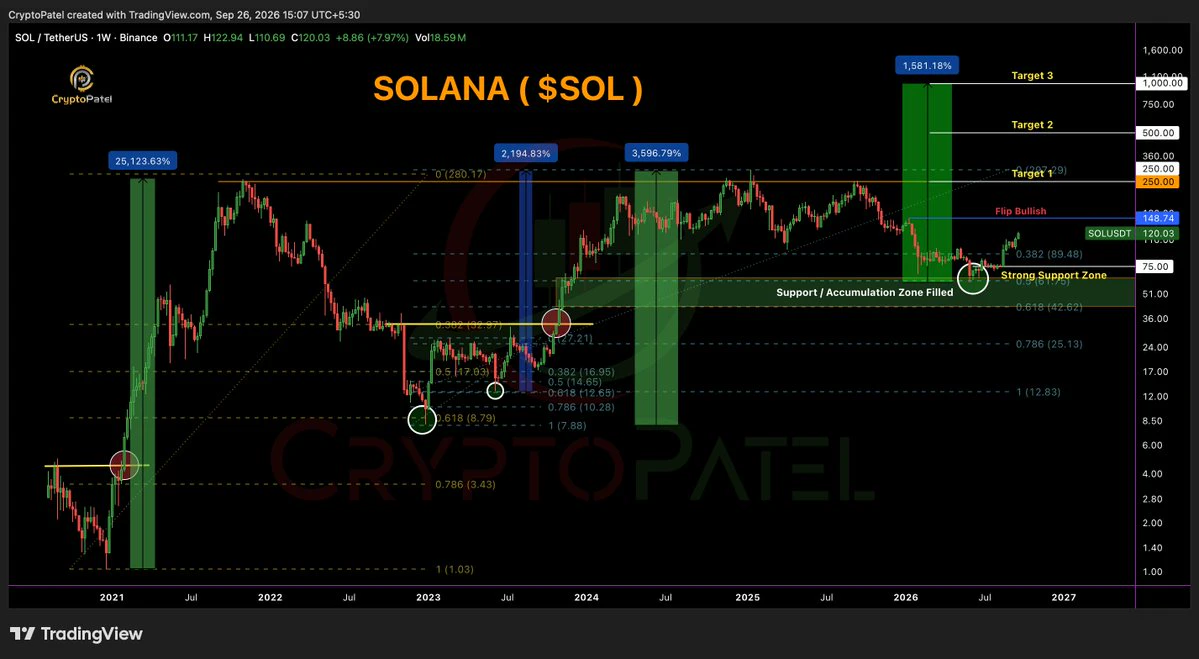
SOLANA PRICE PREDICTION: THE $150 BREAKOUT COULD SEND $SOL TOWARD $1,000
$SOL has finally reclaimed $120 After ~8 months, but the real HTF trend-flip level is $150.
A weekly close above $150 would confirm the bullish breakout and activate my upside targets.
Targets: $250 → $500 → $1,000
If SOL/USDT rejects $150, another correction toward $75 strong support remains possible, potentially creating a major re-entry opportunity.
Our primary $70–$60 entry zone is already filled.
$150 Resistance = THE KEY LEVEL FOR SOLANA’S NEXT MAJOR TREND CHANGE.
@solana
post-image
SOL+0.08%
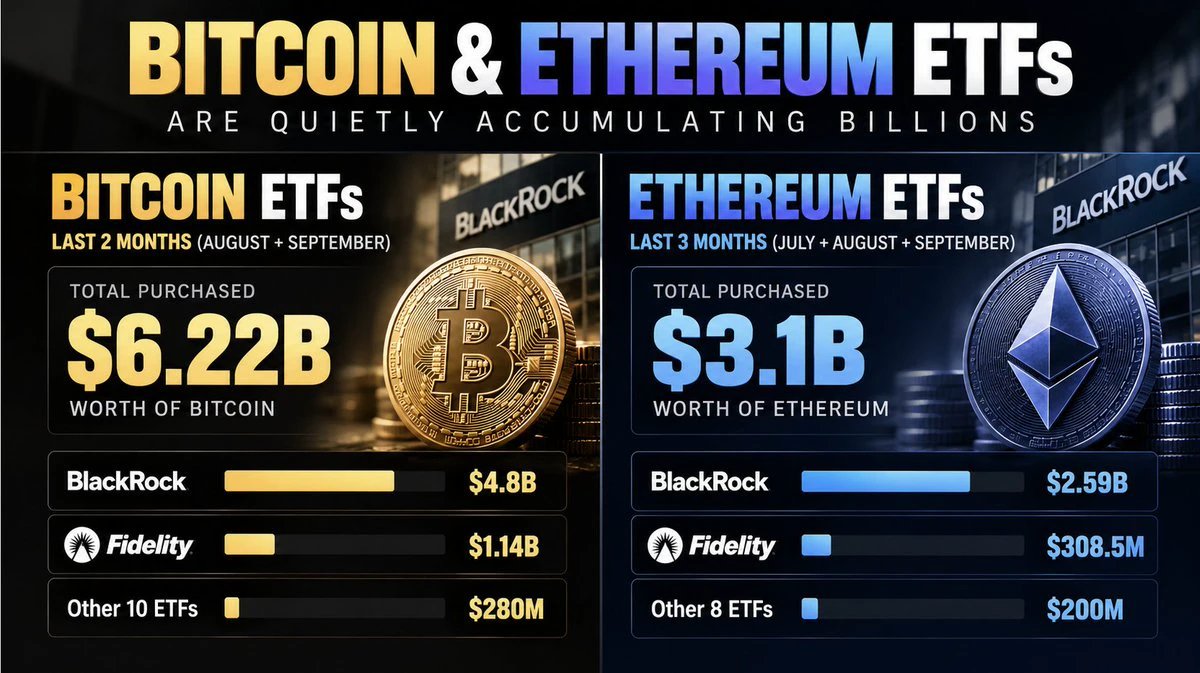
Bitcoin & Ethereum ETFs See $9.3B Inflows As BlackRock Leads Massive Institutional Accumulation
$BTC ETFs | Last 2 Months: $6.22B BTC Purchased
▶️ BlackRock: $4.8B
▶️ Fidelity: $1.14B
▶️ Other 10 ETFs: Only $280M
$ETH ETFs | Last 3 Months: $3.1B ETH Purchased
▶️ BlackRock: $2.59B
▶️ Fidelity: $308.5M
▶️ Other 8 ETFs: ~$200M
Institutional Capital Is Concentrating Into BTC & ETH While Supply Remains Limited.
How Much Higher Can This Demand Push Crypto?
post-image
BTC-0.40%
ETH-0.07%
BLK+1.32%
  • 1
COINMARKETCAP ACQUIRES COINGLASS: MAJOR CRYPTO DATA POWER MOVE
@CoinMarketCap has officially acquired @coinglass_com, bringing one of crypto’s leading derivatives-data platforms into its ecosystem.
CoinGlass provides key metrics including:
➡️ Open Interest
➡️ Funding Rates
➡️ Liquidations
➡️ Long/Short Positioning
➡️ Options & Heatmap Data
CoinGlass will retain its brand, team, API, free tools and existing pricing.
CoinMarketCap can now combine massive spot-market data with derivatives positioning, giving traders a more complete view of market liquidity and leverage.
post-image
SEQUANS COMPLETELY EXITS BITCOIN | 3,200+ BTC TREASURY GONE
French semiconductor company Sequans Communications has officially sold its final 314 $BTC , bringing its Bitcoin holdings to ZERO and ending its Bitcoin treasury strategy entirely.
The company once held 3,200+ BTC and even targeted 100,000 BTC by 2030.
But the strategy reversed:
🔻 3,234 BTC → 2,264 BTC
🔻 2,264 BTC → 658 BTC
🔻 658 BTC → 314 BTC
🔻 314 BTC → 0 BTC
Sequans previously used Bitcoin sales to help eliminate its convertible debt and has now shifted its focus back to its core IoT semiconductor and software-defined radio bus
post-image
BTC+0.07%
What If You Go On Vacation… And Come Back To This? 😳
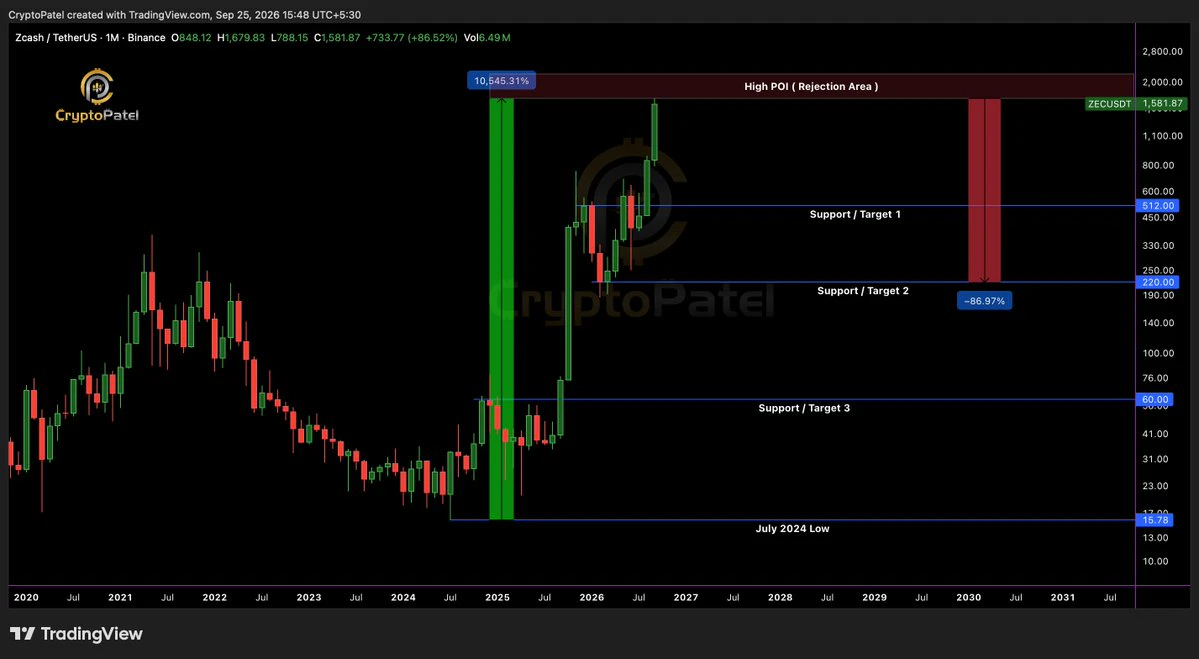
Imagine You’re On Vacation For A Month. You Come Back, Open Your Portfolio, And See Your $ZEC Bag Was Bought Around $1,670–$2,200, The High POI / Rejection Area.
Now Look At The Chart 👇
Support 1: $512
Support 2: $220
Support 3: $60
A Move From $1,670 → $220 Would Mean Roughly -87%. From $2,200 → $220, It’s About -90%.
My Honest View: I’m Not Saying ZEC WILL Dump There. These Are Structural Downside Levels I’m Watching If The Current High-POI Zone Fails.
With ZEC Currently Around $1,600, This Is Exactly Why Risk Management Matters After A
post-image
ZEC+0.01%
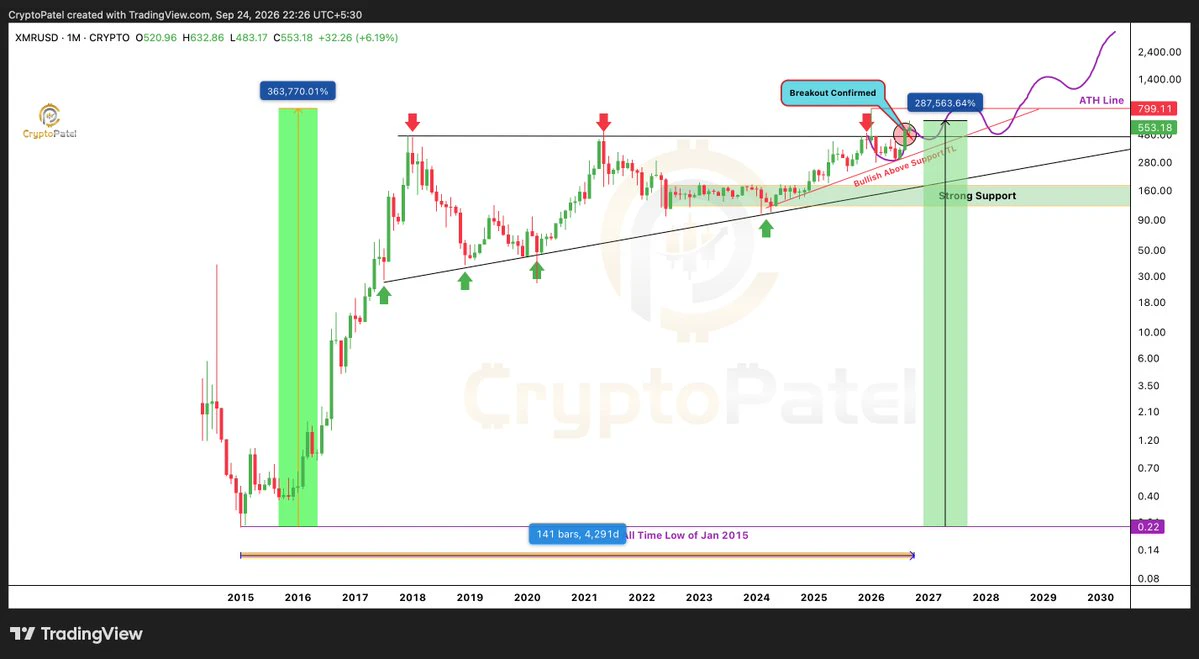
$100 → $287,663 🔥
$XMR : 287,563% UP SINCE LAUNCH!
Imagine You Invested Just $100 In #XMR In January 2015…
That $100 Would Be Worth Approximately $287,663 Today. 🤯
From A Tiny Early Investment To Nearly $288K, This Is The Kind Of Crypto Return That Shows Why Early Adoption In The Right Asset Can Change Everything.
@monero
post-image
XMR0.00%
Individuals Accumulate 107K+ Bitcoin In Q3 2026, Fastest $BTC Buying Pace In Years
post-image
BTC+0.07%
  • 1
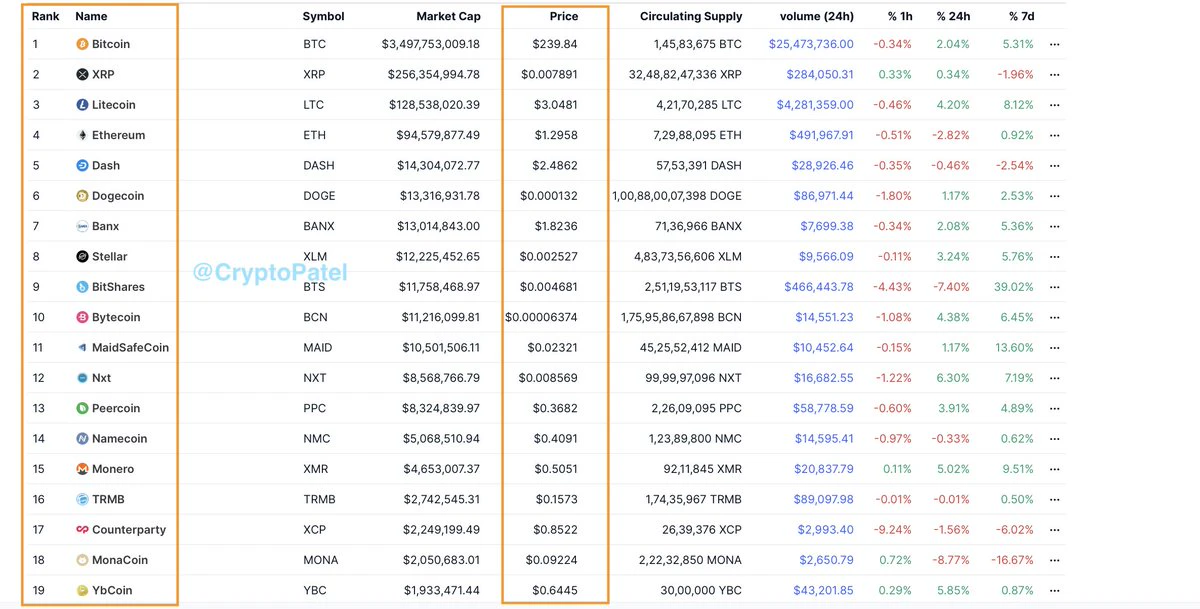
2015 TOP Crypto Currencies Prices List:
$BTC $239
$ETH $1.29
$LTC $3
$XRP $0.007
$DOGE $0.00013
Hope you didn’t forget those days.
post-image
BTC+0.07%
ETH-0.12%
LTC+4.15%
XRP-2.25%
DOGE+0.19%
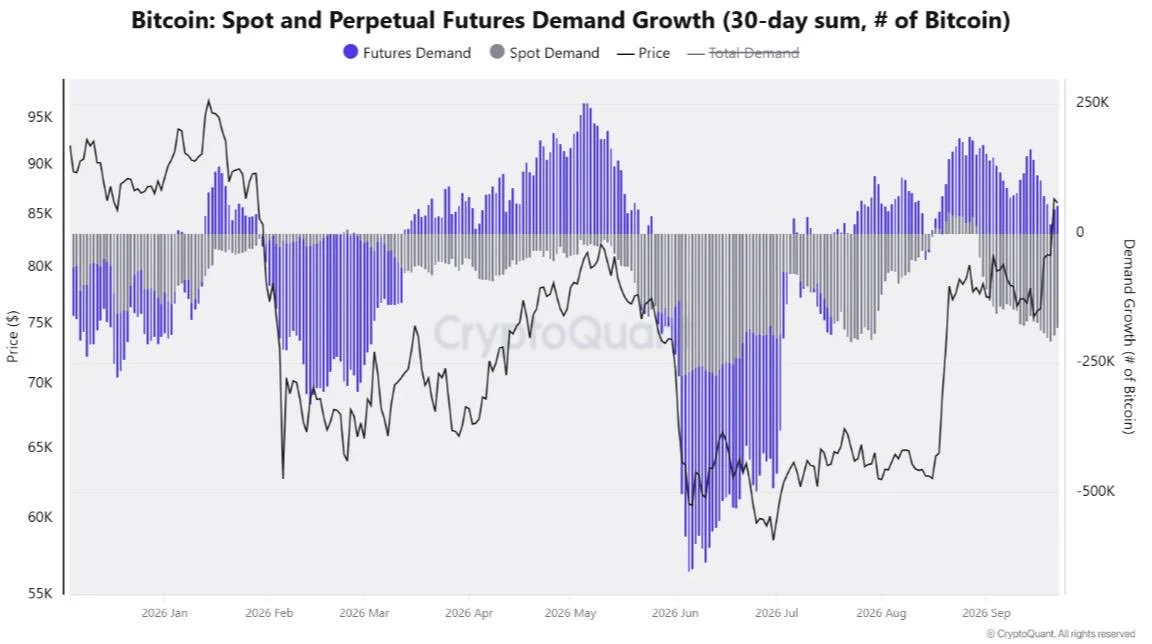
Bitcoin Demand Is Recovering
Bitcoin demand remains negative, but it is recovering from the bottom.
The trend is gradually shifting positive. If this momentum continues, spot demand could soon flip positive, A key signal to watch for Bitcoin’s next move.
post-image
BTC+0.07%
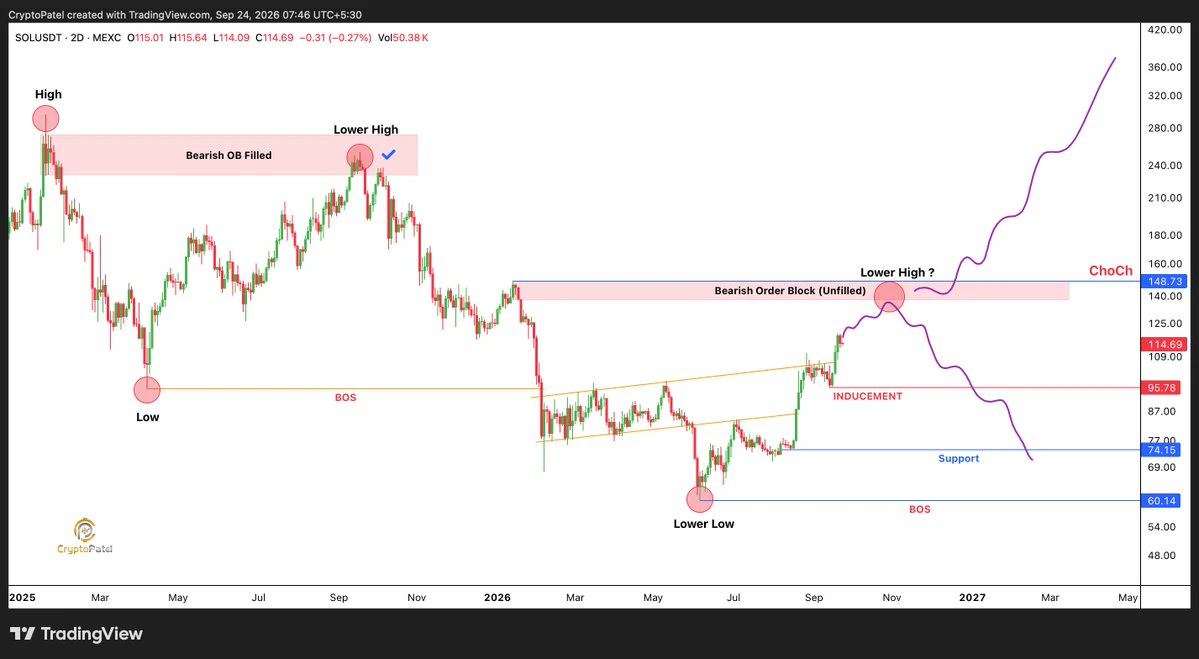
Solana SMC Analysis: Break Above $148.73 Could Confirm a Major CHoCH
On the HTF chart, $SOL is approaching a critical HTF supply zone at $138–$149, where a major Bearish Order Block remains unfilled.
The broader structure is still defined by a Lower High, but the recent recovery from the $60.14 macro low has significantly strengthened short-term market structure.
Key SMC Levels:
▪️ $138–$149 → HTF Bearish Order Block
▪️ $148.73 → Critical structural level / potential CHoCH
▪️ $95.78 → Major inducement & structural reference
▪️ $74.15 → Key support
▪️ $60.14 → Macro swing low
BULLISH SCENARIO:
post-image
SOL+0.08%
celo:native DOWN 99% FROM ATH: IS THIS THE NEXT 2,000%+ CRYPTO REVERSAL SETUP?
#CELO Has Been Crushed By A Multi-Year Downtrend, Losing Nearly 99% From Its $10.98 ATH.
But After Years Of Lower Highs And Lower Lows, Price Is Now Testing A Potential HTF ACCUMULATION ZONE. Is CELO Quietly Building Its Next Major Expansion?
TECHNICAL STRUCTURE
✅ Multi-Year Descending Trendline Resistance
✅ HTF Accumulation Zone: $0.075–$0.057
✅ Bullish Divergence: Potential Momentum Exhaustion
✅ Weekly Breakout + Retest: Key Reversal Confirmation
✅ Invalidation: Weekly Close Below $0.0560
KEY LEVELS
👉 Accumulatio
CELO+4.94%
BITCOIN 2W STRUCTURE: THE NEXT BIG DECISION ZONE
$BTC is currently trading around $84,471 after testing $87,400, which sits inside the major 2W Bearish Order Block.
Bearish Order Block: $86,420 – $97,925:
This is a critical zone for long-term players. The reaction from this area could determine Bitcoin’s next major move.
🟢 BULLISH SCENARIO: If #BTC successfully breaks and holds above $97,925, the bearish structure would be invalidated.
In that scenario, I would target: $128K → $158K → $200K → $300K
A sustained breakout could potentially open the path toward new ATHs and significantly higher v
post-image
BTC+0.07%
  • 2
$TAKE : +1,500% PUMP ONLY IN LAST 3 MONTH | DON’T BECOME EXIT LIQUIDITY
As I Read The Higher-Timeframe Chart, The Structure Is Clear:
From 29 Dec 2025 To 23 Mar 2026, #TAKE Crashed Nearly 97% In Just ~3 Months.
After That Capitulation, Price Entered Around 3 Months Of Accumulation Between $0.013–$0.030, Building A Clear HTF Base.
Then The Expansion Started.
Within The Last 3–4 Months, TAKE/USDT Has Pumped Around 1,500% From The March 2026 Bottom And Is Still Trading Around $0.21.
This Is A MASSIVE Expansion In A Very Short Period.
Yes, TAKE/USDT Can Pump Further, Even Another 40–80% Is Possible
post-image
TAKE+7.04%
BITCOIN MACRO CYCLE MAY BE ENTERING THE PARABOLIC PHASE
HTF structure is echoing previous post-breakdown expansions, if $BTC confirms the breakout and holds the structure, $320K → $600K+ becomes a serious Technical Roadmap.
post-image
BTC+0.07%