MrFlower_XingChen

vip
Crypto Market Researcher
Futures Trading Strategist
Market Analyst
Sharing crypto insights & market vibes
#GateRankedTop4Globally
Gate’s position among the world’s leading crypto exchanges reflects more than a single ranking. It represents years of infrastructure development, deeper liquidity, broader asset coverage, and the continued expansion of products across the digital-asset ecosystem.
Founded in 2013, Gate has grown beyond a traditional spot exchange, building an ecosystem that includes spot and derivatives trading, Earn products, Launchpool, Web3 services, and a wide range of digital assets.
Independent market data also highlights the scale of that growth. TokenInsight’s exchange data cur
MrFlower_XingChen
#GateRankedTop4Globally
Gate’s position among the world’s leading crypto exchanges reflects more than a single ranking. It represents years of infrastructure development, deeper liquidity, broader asset coverage, and the continued expansion of products across the digital-asset ecosystem.
Founded in 2013, Gate has grown beyond a traditional spot exchange, building an ecosystem that includes spot and derivatives trading, Earn products, Launchpool, Web3 services, and a wide range of digital assets.
Independent market data also highlights the scale of that growth. TokenInsight’s exchange data currently places Gate among the leading global exchanges, while its methodology tracks both spot and derivatives activity across centralized platforms.
The June 2026 CoinDesk Exchange Review provides another strong data point. Gate’s spot trading volume increased 50.8% month over month to $66.1 billion, while its spot market share climbed to 5.95%. CoinDesk described Gate as the strongest-performing spot exchange among those tracked for June, with Gate also recording a 9.52% derivatives market share and 9.20% of total open interest.
What stands out to me is not simply the number attached to a ranking. Exchange rankings can change depending on the methodology, time period, and specific metric being measured. The more important signal is whether the underlying ecosystem continues to expand.
Today’s crypto users expect much more than basic buying and selling. They look for liquidity, access to new assets, trading infrastructure, earning products, Web3 tools, and products that can adapt as the market evolves.
Gate’s recent volume growth shows that competition among major exchanges remains intense. That competition ultimately pushes platforms to improve their products, infrastructure, liquidity, and overall user experience.
A ranking is recognition. Maintaining that position is the real challenge.
And with the crypto market continuing to evolve, the next chapter of Gate’s global expansion will be worth watching closely.
@Gate_Square @GateSquare
repost-content-media
  • Reward
  • 8
  • 1
  • Share
LittleQueen:
To The Moon 🌕
View More
#USJulyCPIInLine
July U.S. CPI delivered almost exactly what markets were expecting.
Headline inflation came in at 3.4% YoY, while core CPI eased to 2.5% YoY. On a monthly basis, headline CPI increased just 0.1%, with core CPI rising 0.2%.
The immediate market reaction was constructive: stocks moved higher, Treasury yields eased, and risk sentiment improved as the report reduced pressure for an immediate Fed rate hike.
The bigger story is the September Fed decision.
Following the CPI release, CME FedWatch pricing showed the probability of a September 25-basis-point hike falling to around 42%,
CME1.88%
BTC0.00%
MrFlower_XingChen
#USJulyCPIInLine
July U.S. CPI delivered almost exactly what markets were expecting.
Headline inflation came in at 3.4% YoY, while core CPI eased to 2.5% YoY. On a monthly basis, headline CPI increased just 0.1%, with core CPI rising 0.2%.
The immediate market reaction was constructive: stocks moved higher, Treasury yields eased, and risk sentiment improved as the report reduced pressure for an immediate Fed rate hike.
The bigger story is the September Fed decision.
Following the CPI release, CME FedWatch pricing showed the probability of a September 25-basis-point hike falling to around 42%, while the probability of leaving rates unchanged moved above 55%.
But this is not a clear victory over inflation yet.
Core inflation at 2.5% remains above the Fed’s 2% target, meaning policymakers still have reasons to remain cautious. The Fed will also receive additional inflation, employment and economic data before the September meeting, so today’s probabilities can change quickly.
My take: HOLD currently has the edge over HIKE.
The CPI report removes some pressure for immediate tightening, but one report is not enough to declare the inflation battle finished.
For BTC, stocks and other risk assets, a lower probability of a September hike can be supportive because it reduces near-term tightening fears. The next key question is whether upcoming economic data confirms this cooling trend.
👀 September: HIKE or HOLD?
Drop your call below.
@Gate_Square @GateSquare #StockTradingShareChallenge
repost-content-media
  • Reward
  • 7
  • 1
  • Share
Crypto_Buzz_with_Alex:
Ape In 🚀
View More
#CryptoMarketRecovery
The crypto market is showing signs of resilience, but a recovery should be judged by confirmation, not excitement.
Bitcoin recently stabilized around the $63K–$65K area after a strong July rebound, while market participants continue to watch liquidity, ETF flows, macroeconomic conditions and overall risk appetite. Recent market coverage has also highlighted that BTC is testing the $65K region as crypto sentiment improves.
The current setup is interesting because the market is recovering while several important headwinds remain.
What I’m watching:
📌 Price structure — A r
BTC0.00%
ETH0.35%
MrFlower_XingChen
#CryptoMarketRecovery
The crypto market is showing signs of resilience, but a recovery should be judged by confirmation, not excitement.
Bitcoin recently stabilized around the $63K–$65K area after a strong July rebound, while market participants continue to watch liquidity, ETF flows, macroeconomic conditions and overall risk appetite. Recent market coverage has also highlighted that BTC is testing the $65K region as crypto sentiment improves.
The current setup is interesting because the market is recovering while several important headwinds remain.
What I’m watching:
📌 Price structure — A recovery becomes more convincing when BTC starts making higher highs and higher lows instead of repeatedly getting rejected at resistance.
📌 Volume — Price can move higher on low participation, but sustained volume expansion would provide stronger confirmation that demand is returning.
📌 Liquidity & macro — Crypto remains highly sensitive to global liquidity, interest-rate expectations, Treasury yields and the U.S. dollar. A stronger dollar and higher yields can continue to pressure risk assets.
📌 ETF/institutional demand — Consistent inflows would strengthen the argument that the recovery is supported by real capital rather than short-term speculation.
📌 Altcoin rotation — If Bitcoin stabilizes and capital gradually moves into ETH and selected altcoins, that could signal broader market participation. If BTC dominance remains strong, the recovery may remain primarily Bitcoin-led.
There is another lesson that matters just as much as the chart:
Be careful with analysts who constantly rewrite their predictions after the market has already moved.
A forecast should be judged by what was actually said before the move happened. Changing a target afterward and presenting it as a successful prediction can create a false impression of accuracy.
No analyst can consistently predict every market move. Crypto is influenced by macro data, liquidity, regulation, sentiment, positioning and unexpected events. Even strong technical setups can fail.
So instead of following the loudest prediction, build your own framework:
Trend → Key levels → Volume → Liquidity → Macro → Risk
The recent recovery is encouraging, but the bigger question is whether it can develop into a sustained trend.
For now, I would treat the market as recovering, but not fully confirmed.
The next major move will tell us whether this is the beginning of a stronger recovery or simply another relief rally.
What are you watching most closely: BTC structure, volume, ETF flows, or macro liquidity?
repost-content-media
  • Reward
  • 5
  • Repost
  • Share
Crypto_Buzz_with_Alex:
LFG 🔥
View More
#BigShortBurryBearsAI
Michael Burry is once again challenging one of the market’s strongest narratives: the AI boom.
Burry has taken bearish positions against major AI-linked names including Nvidia, Palantir, Oracle and the SOXX semiconductor ETF, while maintaining his bearish view on Tesla. His broader argument is that investors may be underestimating how much of the current AI infrastructure boom is being supported by complex financing structures rather than straightforward end-user demand.
What makes the argument interesting is that some of the underlying concerns are also being discussed
NVDA0.56%
PLTR4.61%
ORCL1.99%
SOXX0.66%
TSLA3.84%
MrFlower_XingChen
#BigShortBurryBearsAI
Michael Burry is once again challenging one of the market’s strongest narratives: the AI boom.
Burry has taken bearish positions against major AI-linked names including Nvidia, Palantir, Oracle and the SOXX semiconductor ETF, while maintaining his bearish view on Tesla. His broader argument is that investors may be underestimating how much of the current AI infrastructure boom is being supported by complex financing structures rather than straightforward end-user demand.
What makes the argument interesting is that some of the underlying concerns are also being discussed by the Bank for International Settlements (BIS).
A March 2026 BIS analysis described part of AI infrastructure financing as “shadow borrowing,” where economically debt-like obligations can sit outside corporate balance sheets. The BIS noted that these structures can increase links between hyperscalers, private-credit investors, insurers and banks, potentially creating additional channels for financial stress.
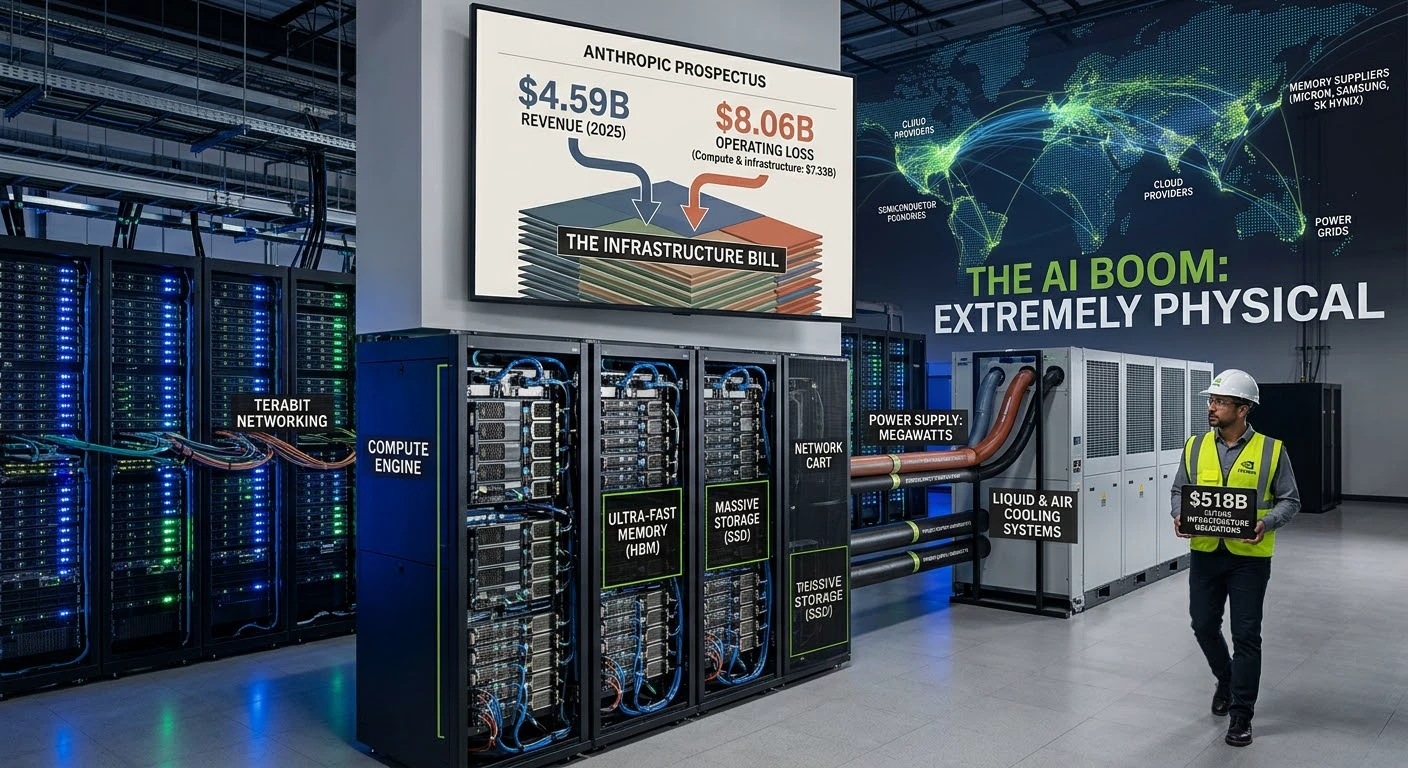
The BIS went further in its June 2026 Annual Economic Report, warning that the five largest hyperscalers were set to spend more than $1 trillion on AI-related capital expenditure across 2025–2026, with investment commitments outpacing earnings and free cash flow in some cases.
But this does not automatically prove that Nvidia or the broader AI industry is a bubble.
There is genuine demand for AI computing, enormous investment in data centers, and real technological progress. The key question is whether future AI revenue and productivity gains will be large enough to justify the enormous amount of capital being committed today.
That is where Burry’s warning becomes important.
The risk is not necessarily that AI is fake. The bigger risk is that real technology can still become overvalued.
If companies continue spending aggressively, while monetization fails to grow quickly enough, the return on that investment could disappoint. The BIS has similarly highlighted concerns around debt-financed investment, circular financial relationships and the possibility that excessive investment could amplify a future downturn.
So I would separate two questions:
Is AI real?
Yes.
Can AI-related assets still be overpriced?
Absolutely.
That distinction is what makes the current debate so important.
Burry may ultimately be early, wrong, or right on the timing. But his argument raises a legitimate question for investors: are today’s AI valuations being supported primarily by sustainable cash flows, or by expectations of future demand that still need to materialize?
The next few earnings cycles, AI infrastructure spending, customer monetization and financing conditions should provide much clearer evidence.
AI may be the future — but the price investors pay for that future still matters.
Not financial advice. Always evaluate the underlying data rather than following any single analyst or market narrative.
repost-content-media
  • Reward
  • 6
  • Repost
  • Share
Crypto_Buzz_with_Alex:
LFG 🔥
View More
#XAU
Gold is trading around the $4,400/oz area, with the market still highly sensitive to U.S. inflation, Treasury yields, the dollar and geopolitical risk. Recent data showed July U.S. consumer prices rising only 0.1% month-on-month, which reduced expectations of an immediate Fed rate hike and helped precious metals remain supported.
KEY MARKET LEVELS
Resistance:
• $4,450–$4,470 — first upside supply zone
• $4,500 — major psychological resistance
• $4,550–$4,600 — breakout/extension zone
Support:
• $4,380–$4,400 — immediate demand area
• $4,330–$4,350 — stronger pullback support
• $4,280–$4
XAU-1.02%
XAUUSD0.13%
MrFlower_XingChen
#XAU
Gold is trading around the $4,400/oz area, with the market still highly sensitive to U.S. inflation, Treasury yields, the dollar and geopolitical risk. Recent data showed July U.S. consumer prices rising only 0.1% month-on-month, which reduced expectations of an immediate Fed rate hike and helped precious metals remain supported.
KEY MARKET LEVELS
Resistance:
• $4,450–$4,470 — first upside supply zone
• $4,500 — major psychological resistance
• $4,550–$4,600 — breakout/extension zone
Support:
• $4,380–$4,400 — immediate demand area
• $4,330–$4,350 — stronger pullback support
• $4,280–$4,300 — major structural support
BULLISH SCENARIO
If XAU/USD holds above $4,400 and buyers reclaim $4,450–$4,470 with strong momentum, the next targets can be $4,500, followed by $4,550–$4,600.
A clean breakout should ideally come with expanding futures/market participation rather than a low-volume price spike. I would avoid chasing the first breakout candle and instead watch for a retest that holds.
BEARISH SCENARIO
If gold repeatedly rejects $4,450–$4,470 and loses $4,380, downside pressure could increase toward $4,330–$4,350. A decisive break below that zone would shift attention toward $4,280–$4,300.
The key point is that support should be confirmed by price action rather than assuming every dip is automatically a buying opportunity.
TRADING FRAMEWORK
Bullish setup → wait for a confirmed breakout/retest above resistance.
Pullback setup → look for a clear reaction around $4,380–$4,400 or deeper $4,330–$4,350 support.
Bearish setup → wait for rejection plus a confirmed breakdown below support.
For risk management, keep position size controlled and define invalidation before entering. Gold can move sharply around U.S. data, Fed expectations, Treasury yields and geopolitical headlines.
MACRO FACTORS TO WATCH
The U.S. dollar and real yields remain two of the most important short-term drivers for gold. Lower real yields and a weaker dollar generally improve gold's relative appeal, while rising yields and a stronger dollar can create pressure.
At the moment, the inflation picture is giving gold some support, but the 10-year U.S. Treasury yield is still around 4.69%, meaning yields remain an important headwind to monitor.
MY VIEW
XAU/USD remains neutral-to-bullish above $4,380, but I want to see a confirmed break of $4,450–$4,470 before treating the move toward $4,500+ as a stronger continuation setup.
The market is sitting at an important decision zone: hold support and reclaim resistance = bullish continuation; lose support and reject resistance = deeper correction.
@Gate_Square @GateSquare
repost-content-media
  • Reward
  • 5
  • Repost
  • Share
Crypto_Buzz_with_Alex:
LFG 🔥
View More
#GoogleDoublesDownOnGemini
Google is sending a much stronger message about where it believes the next phase of the AI race will be won: Gemini.
Alphabet has reshaped Google DeepMind’s leadership. Demis Hassabis is moving into the roles of Chairman of Google DeepMind and Chief Scientist of Alphabet, while Koray Kavukcuoglu takes operational leadership of Google DeepMind, including responsibility for Gemini model development, frontier AI research, and the Gemini app and developer teams. Google officially confirmed the transition, while Reuters reports that the reshuffle comes as Google faces in
MrFlower_XingChen
#GoogleDoublesDownOnGemini
Google is sending a much stronger message about where it believes the next phase of the AI race will be won: Gemini.
Alphabet has reshaped Google DeepMind’s leadership. Demis Hassabis is moving into the roles of Chairman of Google DeepMind and Chief Scientist of Alphabet, while Koray Kavukcuoglu takes operational leadership of Google DeepMind, including responsibility for Gemini model development, frontier AI research, and the Gemini app and developer teams. Google officially confirmed the transition, while Reuters reports that the reshuffle comes as Google faces intense competitive pressure from OpenAI and Anthropic.
What makes this important is the change in priorities.
Google already has something most AI competitors would struggle to reproduce: AI research talent + enormous computing infrastructure + custom chips + Google Cloud + Search + Android + YouTube + billions of existing users.
The missing piece is turning that advantage into faster execution.
Gemini has been expanding rapidly, and Google has continued releasing new models and AI features throughout 2026. The company is increasingly integrating Gemini into products rather than treating it as a standalone chatbot.
But the AI race is getting harder.
OpenAI and Anthropic continue pushing aggressively, while Reuters reports that Google has faced internal pressure around Gemini's development speed and performance, particularly in areas such as coding. The latest restructuring therefore looks less like a routine management change and more like an attempt to create a clearer chain of command around Google's AI ambitions.
The role of Hassabis is also important.
Moving him into a broader scientific and strategic position could allow him to focus more heavily on long-term AGI research while Kavukcuoglu concentrates on execution across models, products and developers.
That creates a simple question for Google:
Can Gemini become more than a strong AI model and become the AI layer connecting Google's entire ecosystem?
If Gemini becomes deeply embedded across Search, Android, Workspace, Cloud and developer products, Google's distribution advantage could become extremely powerful.
But there is another side to the story.
Leadership changes, talent retention, model quality, computing costs and the speed of innovation will all matter. In AI, being second today does not guarantee being first tomorrow — but being first in distribution also does not guarantee winning the model race.
For Alphabet, the opportunity is enormous.
For the AI industry, the competition is becoming even more intense.
Google is no longer treating Gemini as an experiment. It is increasingly building its AI strategy around it.
The next battle will not simply be about who has the smartest model.
It will be about who can combine research, compute, products, distribution, developers and monetization better than everyone else.
And that is exactly why this Google DeepMind reshuffle deserves attention.
@Gate_Square @GateSquare
repost-content-media
  • Reward
  • 4
  • Repost
  • Share
Crypto_Buzz_with_Alex:
LFG 🔥
View More
#InstitutionsSold21.6BNasdaqFuturesInAWeek
Institutions Are Selling Nasdaq Futures — But the Nasdaq Is Still Rising
One of the most interesting market divergences developing right now is happening between institutional positioning and actual price action.
According to Goldman Sachs data cited by market sources, non-dealer investors sold approximately $21.6 billion of Nasdaq futures during the week ending August 4, the largest weekly selling figure reported in the dataset. Roughly 72% of that flow was attributed to short positioning. Hedge funds accounted for about $11.9 billion of the selling
MrFlower_XingChen
#InstitutionsSold21.6BNasdaqFuturesInAWeek
Institutions Are Selling Nasdaq Futures — But the Nasdaq Is Still Rising
One of the most interesting market divergences developing right now is happening between institutional positioning and actual price action.
According to Goldman Sachs data cited by market sources, non-dealer investors sold approximately $21.6 billion of Nasdaq futures during the week ending August 4, the largest weekly selling figure reported in the dataset. Roughly 72% of that flow was attributed to short positioning. Hedge funds accounted for about $11.9 billion of the selling, while asset managers represented roughly $7.4 billion.
What makes this unusual is the timing.
The Nasdaq was moving sharply higher during the same period. In other words, institutions were reducing or hedging Nasdaq exposure while the index was delivering a strong rally.
That creates a very important question:
Are institutions predicting a decline — or simply protecting profits after a powerful move?
There is a major difference.
Futures positioning is not the same thing as simply selling stocks. Large institutions use futures for portfolio hedging, tactical exposure, risk management and relative-value strategies. A large short futures position can therefore exist alongside substantial long positions in individual technology companies.
So I would not interpret the $21.6 billion figure as an automatic “Nasdaq crash incoming” signal.
Instead, I see it as a warning about positioning.
The most interesting part is that reported institutional net exposure has moved from extremely bullish levels toward negative territory. Market coverage citing the Goldman Sachs data says net positioning reached approximately -$5 billion, compared with a peak around +$54 billion in October 2025.
That is a significant change in sentiment.
But there is another side to the story.
Goldman Sachs itself has recently argued that U.S. stocks could continue grinding higher, and its August 7 market commentary said it does not expect the Federal Reserve to raise rates in 2026.
This tells us the institutional picture is not simply bearish.
The market is balancing several forces at once:
1. AI earnings and investment
Technology remains heavily supported by the AI investment cycle. Goldman Sachs previously estimated that AI investment could account for a substantial portion of S&P 500 earnings growth in 2026, while major cloud companies continue committing enormous amounts of capital to infrastructure.
2. Strong price momentum
The Nasdaq has continued showing resilience despite the increase in defensive positioning. Recent market data shows Nasdaq-100 futures still trading near elevated levels, with the index continuing to respond positively to AI-related earnings and macroeconomic developments.
3. Institutional hedging
The record futures selling may represent institutions reducing beta after a strong rally rather than abandoning technology altogether.
4. Short-squeeze risk
This is where the situation becomes particularly interesting.
If institutions continue building short exposure while the Nasdaq keeps climbing, those bearish positions can eventually become a source of buying pressure. Short sellers may be forced to reduce positions if the market continues moving against them.
That can create a powerful feedback loop:
More shorts → Nasdaq keeps rising → shorts face losses → positions get covered → additional buying → stronger upside momentum.
But the opposite scenario is equally important.
If Nasdaq momentum begins to weaken while institutional shorts remain elevated, the market could experience a much sharper correction because the positioning would already be defensive.
Therefore, I would watch price confirmation rather than headlines alone.
The key signals going forward are:
Price: Does Nasdaq continue making higher highs and higher lows?
Breadth: Is the rally spreading across the technology sector, or is it being carried by only a handful of mega-cap names?
Volatility: Does volatility remain suppressed, or does it suddenly expand?
Futures positioning: Are institutional shorts increasing further, or are investors beginning to cover?
Earnings: Can AI-related earnings and guidance continue justifying elevated valuations?
Liquidity and rates: Are financial conditions supportive enough to keep capital flowing toward growth assets?
This is why the current setup is fascinating.
A market can continue rising even while institutions become increasingly cautious. In fact, extreme bearish positioning during a strong uptrend can sometimes become fuel for another leg higher.
But if the price trend finally breaks, the same positioning becomes a potential confirmation of a larger risk-off move.
My takeaway:
The $21.6 billion Nasdaq futures selling should not be treated as a standalone sell signal. It is better understood as evidence that institutional positioning has become significantly more defensive while price remains strong.
That divergence is the real story.
If Nasdaq continues higher despite record institutional selling, the market is demonstrating extraordinary underlying demand — and short positioning could eventually become fuel for further upside.
If Nasdaq loses momentum and begins breaking important support, however, the institutional positioning could prove to be an early warning rather than simple profit-taking.
For now, I would stay focused on the relationship between price, positioning, breadth, earnings and liquidity.
The next major move may not come from the headline itself.
It may come from the moment when institutional positioning and price finally move in the same direction.
Market commentary only, not financial advice.
#StockTradingShareChallenge
repost-content-media
  • Reward
  • 3
  • Repost
  • Share
Crypto_Buzz_with_Alex:
2026 GOGOGO 👊
View More
#MyQixiTradingShare
#China10YearYieldFallsBelow1.7%
China’s Bond Market Is Sending a Bigger Macro Signal
China’s 10-year government bond yield has slipped into historically low territory, trading around 1.69%–1.70% on August 13, while the 30-year yield is around 2.16%–2.17%. Official ChinaBond data put the August 12 10-year yield at 1.7141% and the 30-year at 2.1731%, while other market feeds show the 10-year near 1.695% today.
This move is more than a simple bond rally. Falling yields indicate that investors are increasingly positioning for a combination of easier monetary conditions, weake
MrFlower_XingChen
#MyQixiTradingShare
#China10YearYieldFallsBelow1.7%
China’s Bond Market Is Sending a Bigger Macro Signal
China’s 10-year government bond yield has slipped into historically low territory, trading around 1.69%–1.70% on August 13, while the 30-year yield is around 2.16%–2.17%. Official ChinaBond data put the August 12 10-year yield at 1.7141% and the 30-year at 2.1731%, while other market feeds show the 10-year near 1.695% today.
This move is more than a simple bond rally. Falling yields indicate that investors are increasingly positioning for a combination of easier monetary conditions, weaker inflation pressure and softer growth expectations. China’s July inflation rate was only 0.5%, while the 10-year yield has continued to grind lower despite already depressed levels.
The key question now is whether 1.70% becomes a floor or simply another level on the way down.
If expectations for additional policy support strengthen, the next area to watch could be around 1.65%, followed by the 1.60%–1.62% zone. A sustained break below 1.60% would represent a much stronger signal that markets are pricing a prolonged low-rate environment rather than a temporary easing cycle.
But there is an important risk on the other side: ultra-low yields can become crowded trades. At these levels, even a modest change in PBOC expectations, stronger economic data, higher inflation expectations or heavier government bond supply could trigger a sharp reversal in yields.
The China-US rate differential is also worth watching. China’s 10-year yield is around 1.70%, compared with roughly 4.68% for the US 10-year Treasury, leaving a very wide yield gap.
My view: the direction of Chinese yields matters more than the exact number. If yields keep falling while economic data remains soft, markets may interpret it as growing expectations for further policy support. If yields stabilize around 1.65%–1.70%, the market could be entering a consolidation phase after a major bond rally.
The next major test is simple:
Can China’s 10Y yield break decisively below 1.65% — or will 1.70% become the new macro floor?
That answer could have implications well beyond Chinese bonds, especially for the RMB, Asian equities, commodities and global liquidity expectations.
What do you think comes next: 1.60%, 1.65%, or a rebound back above 1.75%?
@Gate_Square
repost-content-media
  • Reward
  • 3
  • Repost
  • Share
Crypto_Buzz_with_Alex:
To The Moon 🌕
View More
#GoogleDoublesDownOnGemini
Google Doubles Down On Gemini — This Is Bigger Than A Leadership Shuffle
Google is reorganizing its AI leadership at a critical moment in the global AI race.
Demis Hassabis is moving from day-to-day leadership of Google DeepMind into the roles of Chair of Google DeepMind and Chief Scientist of Alphabet, while Koray Kavukcuoglu, previously DeepMind’s CTO and Google’s chief AI architect, is taking over as Senior Vice President of Google DeepMind and reporting directly to Sundar Pichai.
The important part is not the job titles. It is the division of responsibility.
Has
GOOGL0.83%
MrFlower_XingChen
#GoogleDoublesDownOnGemini
Google Doubles Down On Gemini — This Is Bigger Than A Leadership Shuffle
Google is reorganizing its AI leadership at a critical moment in the global AI race.
Demis Hassabis is moving from day-to-day leadership of Google DeepMind into the roles of Chair of Google DeepMind and Chief Scientist of Alphabet, while Koray Kavukcuoglu, previously DeepMind’s CTO and Google’s chief AI architect, is taking over as Senior Vice President of Google DeepMind and reporting directly to Sundar Pichai.
The important part is not the job titles. It is the division of responsibility.
Hassabis can now concentrate more heavily on long-term AGI research, scientific discovery and Alphabet-wide AI strategy, while Kavukcuoglu is responsible for execution across Gemini model development, frontier AI research, the Gemini app and developer teams. Google itself describes this as the next chapter of its AI momentum.
That tells me Google is trying to solve one of the biggest challenges in AI today: turning world-class research and massive computing resources into products that move fast enough.
Google already has enormous advantages — DeepMind research, custom AI infrastructure, Search distribution, Android, Cloud and a huge developer ecosystem. But the competitive environment is changing quickly. OpenAI and Anthropic are pushing aggressively at the frontier, while Google has faced model delays and the loss of several high-profile researchers. Longtime Google AI leader Jeff Dean is also leaving with other researchers to build a new AI venture.
So this restructuring should be viewed as an execution test for Gemini.
Can Google make Gemini better, faster and more deeply integrated across its ecosystem?
That is what ultimately matters for Alphabet shareholders.
GOOGL TECHNICAL PICTURE
Alphabet shares are currently around $343–$344 based on the latest available market data. The technical structure is still cautious rather than strongly bullish.
Recent technical readings show the stock below its 50-day and 200-day moving averages, while RSI is in weaker territory and MACD remains negative.
The immediate area I would watch is $350–$356.
A sustained move back above that zone could improve momentum and potentially open the door toward $370, which remains an important resistance area.
On the downside, the recent trading range around $340 becomes important. If that area fails decisively, the market could remain under pressure before another meaningful recovery attempt.
The key point: the AI leadership change itself does not automatically make GOOGL bullish.
The market will eventually demand evidence.
More capable Gemini models.
Faster product releases.
Higher developer adoption.
Stronger enterprise demand.
And, most importantly, measurable financial returns from AI investment.
THE BIGGER AI BET
Google is effectively separating two missions.
Hassabis → long-term AGI, science and strategic AI direction.
Kavukcuoglu → execution, Gemini, products and developers.
That could be a powerful structure if Google can maintain close coordination between research and commercialization.
For GOOGL, I would watch the $350–$356 reclaim first, then $370. A convincing breakout above $370 would make the technical picture considerably stronger.
Until then, this remains a story of AI execution meeting market expectations.
Google has the technology, infrastructure and distribution.
Now the question is whether it can execute quickly enough.
Not financial advice. This is market commentary and my own analysis.
#StockTradingShareChallenge
@Gate_Square @GateSquare
repost-content-media
  • Reward
  • 2
  • Repost
  • Share
Yunna:
LFG 🔥
View More
#China10YearYieldFallsBelow1.7%
China’s 10Y Yield Is Sending a Bigger Macro Signal
China’s 10-year government bond yield is hovering around the 1.69%–1.70% area, while the 30-year yield remains near 2.16%–2.17%. ChinaBond data has already shown the long-end of the curve at historically low levels, highlighting how strong demand for government bonds has become.
The bigger story is not simply that yields are falling. It is why investors are willing to accept such low returns.
China’s July inflation data showed CPI rising just 0.5% year over year, reinforcing concerns about weak domestic demand
MrFlower_XingChen
#China10YearYieldFallsBelow1.7%
China’s 10Y Yield Is Sending a Bigger Macro Signal
China’s 10-year government bond yield is hovering around the 1.69%–1.70% area, while the 30-year yield remains near 2.16%–2.17%. ChinaBond data has already shown the long-end of the curve at historically low levels, highlighting how strong demand for government bonds has become.
The bigger story is not simply that yields are falling. It is why investors are willing to accept such low returns.
China’s July inflation data showed CPI rising just 0.5% year over year, reinforcing concerns about weak domestic demand and subdued price pressures. That environment can increase expectations for additional monetary and fiscal support, while encouraging investors to move toward longer-duration government bonds.
Now the market is approaching an important technical and psychological zone.
1.70% → first major pivot
1.65% → key downside test
1.60%–1.62% → potential next macro target
1.75% → important rebound level
A sustained move below 1.65% would strengthen the argument that markets are pricing a prolonged low-rate environment rather than a short-lived bond rally. A break toward 1.60% would be an even stronger signal.
But there is another side to the trade.
When yields become extremely low, positioning can become crowded. A change in PBOC expectations, stronger economic data, higher inflation expectations or heavier government bond supply could push yields sharply higher as investors unwind duration exposure.
The China-US rate gap also remains enormous. The US 10-year Treasury yield is around 4.68%, compared with roughly 1.70% for China — a spread of almost 3 percentage points.
That divergence matters for the RMB, Asian equities, commodities and global liquidity expectations.
My key signal to watch is therefore not one exact yield number, but the direction and persistence of the move.
If China’s 10Y yield breaks below 1.65% and stays there, the market could be signaling deeper expectations for easing and weaker growth.
If it repeatedly fails near 1.65%–1.70% and rebounds above 1.75%, the bond rally may be entering a consolidation or reversal phase.
The real question:
Is 1.70% the new floor — or just another stop on the way to 1.60%?
What’s your view: 1.60%, 1.65%, or a rebound above 1.75%?
#MyQixiTradingShare #China10YearYieldFallsBelow1.7%
@Gate_Square
repost-content-media
  • Reward
  • 2
  • Repost
  • Share
Yunna:
LFG 🔥
View More
#GateHits59MillionUsers
Gate Surpasses 59 Million Users — 60 Million Is Next
Gate has now surpassed 59 million global users, bringing the platform within just 1 million users of the 60 million milestone.
Since its founding in 2013, Gate has continued expanding its global multi-asset ecosystem, moving far beyond a single-asset crypto trading platform.
Today, the numbers tell the story:
59M+ global users
4,900+ crypto assets
12,500+ stock assets
Top-tier spot trading volume and liquidity
117% total reserve ratio
Nearly 500 user assets covered
The latest Proof of Reserves report, dated July 27,
BTC0.00%
ETH0.35%
MrFlower_XingChen
#GateHits59MillionUsers
Gate Surpasses 59 Million Users — 60 Million Is Next
Gate has now surpassed 59 million global users, bringing the platform within just 1 million users of the 60 million milestone.
Since its founding in 2013, Gate has continued expanding its global multi-asset ecosystem, moving far beyond a single-asset crypto trading platform.
Today, the numbers tell the story:
59M+ global users
4,900+ crypto assets
12,500+ stock assets
Top-tier spot trading volume and liquidity
117% total reserve ratio
Nearly 500 user assets covered
The latest Proof of Reserves report, dated July 27, shows Gate maintaining an overall 117% reserve ratio, while BTC and ETH reserves also remain above user holdings.
But the most important part of this growth is the expansion of the ecosystem itself.
Gate now brings together exposure across crypto assets, stocks, metals, indices, forex and commodities, creating a broader multi-asset environment for users around the world.
From the very first user in 2013 to 59 million+ today, the scale of the journey is significant.
And the next milestone is already visible:
59M → 60M
The final million is more than just another number. It represents another test of whether Gate can continue combining global user growth, deep liquidity, asset diversity, transparency and reserve strength as the platform scales.
With the ecosystem continuing to expand, the bigger question is no longer whether Gate can reach 60 million.
It is:
What will Gate’s next phase look like after 60 million users?
60M is getting closer.
The next chapter could be even bigger.
#StockTradingShareChallenge @Gate_Square
repost-content-media
  • Reward
  • 2
  • Repost
  • Share
Yunna:
LFG 🔥
View More
#JulyCPIInLineAsInflationCools
US July CPI: Cooling Inflation, But Not Yet a New Crypto Catalyst
The latest US inflation report delivered a message markets were hoping for — but not a dramatic one.
July CPI rose 3.4% year over year, down from 3.5% in June, while prices increased 0.2% month over month. Core CPI, excluding food and energy, also increased 0.2% MoM, with the annual core rate at 2.9%. The headline result broadly matched expectations, meaning the report did not deliver the kind of upside inflation surprise that could immediately push markets toward a more hawkish Federal Reserve st
BTC0.00%
MrFlower_XingChen
#JulyCPIInLineAsInflationCools
US July CPI: Cooling Inflation, But Not Yet a New Crypto Catalyst
The latest US inflation report delivered a message markets were hoping for — but not a dramatic one.
July CPI rose 3.4% year over year, down from 3.5% in June, while prices increased 0.2% month over month. Core CPI, excluding food and energy, also increased 0.2% MoM, with the annual core rate at 2.9%. The headline result broadly matched expectations, meaning the report did not deliver the kind of upside inflation surprise that could immediately push markets toward a more hawkish Federal Reserve stance.
That distinction matters.
A CPI report that comes in exactly as expected removes some uncertainty, but it does not automatically create a powerful liquidity catalyst for Bitcoin and other risk assets.
Bitcoin’s reaction has reflected that reality. After the initial response, BTC remained around the $63K–$64K area, with traders quickly shifting their attention away from the CPI headline and toward the next macro signals. CoinDesk noted that the in-line inflation print gave Bitcoin little reason to sustain a major breakout.
Why didn’t BTC rally harder?
Because the market was already prepared for this number.
When expectations and reality are almost identical, there is little new information for traders to price in. The bigger question is now whether inflation continues to cool over the coming months and whether that eventually changes the Federal Reserve’s policy path.
For crypto, that is crucial.
Bitcoin remains highly sensitive to changes in liquidity, interest-rate expectations, Treasury yields and overall risk appetite. A softer inflation trend can improve the macro backdrop, but the strongest bullish signal would come from a combination of continued disinflation, stable economic growth and a clearer shift toward easier monetary conditions.
The next phase could be more important than the CPI reaction
The market now needs confirmation.
If upcoming inflation data continues moving lower while the labour market gradually cools, expectations for easier monetary policy could strengthen. That would potentially create a more supportive environment for risk assets.
But if inflation stalls above the Fed’s target or begins accelerating again, the market could quickly reverse those expectations.
That makes the next major catalysts especially important:
• Future CPI and PCE inflation data
• US employment and wage data
• Treasury yields and the US dollar
• Federal Reserve communication
• Liquidity conditions and institutional flows
Bitcoin’s technical message
BTC is currently trading in a market where $65K remains an important upside area, while the $63K zone continues to matter for short-term structure.
A convincing move above $65K, supported by stronger volume and improving liquidity, would make the current consolidation look more constructive.
On the other hand, losing the $63K area would weaken the near-term structure and could bring lower support zones back into focus.
So far, the CPI release has reduced one source of macro uncertainty — but it has not provided the catalyst required for a decisive breakout.
That is the key takeaway.
The market is no longer asking only:
“Is inflation falling?”
It is asking:
“Is inflation falling fast enough, and consistently enough, to change the Fed’s policy path?”
Until that answer becomes clearer, Bitcoin may continue consolidating rather than immediately entering a sustained trend.
CPI cooled.
The macro pressure eased.
But the real test is still ahead.
Watch the data, watch yields, and most importantly, watch how BTC reacts when the next major liquidity catalyst arrives.
#StockTradingShareChallenge @Gate_Square
repost-content-media
  • Reward
  • 3
  • Repost
  • Share
Yusfirah:
To The Moon 🌕
View More
#GateJulyTransparencyReportReleased
Gate’s July 2026 Transparency Report highlights a broader transformation taking place across its platform: trading activity continues to expand while the product ecosystem is moving deeper into TradFi, IPO access, payments, Web3 and multi-asset services.
The headline numbers are significant.
117% overall reserve ratio
$260M+ cumulative OpenAI Pre-IPO subscriptions
36%+ peak event-contract market share
135%+ peak Launchpool SLX APR
Up to 8% Gate Card cashback
200+ countries and regions covered
But the real story is the combination of these developments.
Trad
MrFlower_XingChen
#GateJulyTransparencyReportReleased
Gate’s July 2026 Transparency Report highlights a broader transformation taking place across its platform: trading activity continues to expand while the product ecosystem is moving deeper into TradFi, IPO access, payments, Web3 and multi-asset services.
The headline numbers are significant.
117% overall reserve ratio
$260M+ cumulative OpenAI Pre-IPO subscriptions
36%+ peak event-contract market share
135%+ peak Launchpool SLX APR
Up to 8% Gate Card cashback
200+ countries and regions covered
But the real story is the combination of these developments.
TradFi is becoming a major part of the ecosystem
Gate continued expanding beyond crypto with the rollout of zero-fee trading for U.S. stocks and ETFs, gStocks, stock copy trading and account-yield services.
The launch of gStocks is particularly notable because Gate describes the product as tokenized securities backed 1:1 by underlying stocks held in custody, creating a bridge between traditional equities and blockchain-based trading infrastructure.
This reflects a much bigger industry trend: users increasingly want access to different asset classes without moving between completely separate financial platforms.
Pre-IPO demand is another major signal
Cumulative subscriptions for OpenAI Pre-IPOs exceeded $260 million, showing substantial user interest in gaining exposure to private-market opportunities through Gate’s ecosystem.
Gate has also continued developing its broader IPO-access strategy. Its July expansion included the transition from the first SpaceX project toward additional opportunities such as Jersey Mike’s, indicating that IPO access is becoming a more structured part of the platform rather than a one-off product.
Reserves remain a key part of the story
Gate reported an overall reserve ratio of 117% in July.
For a growing multi-asset platform, reserve transparency matters because scale alone is not enough. As product coverage expands, users increasingly look at asset backing, transparency, liquidity and operational resilience alongside trading features.
Payments are expanding too
Gate Card maximum cashback has increased to 8%, with coverage extending across 200+ countries and regions.
That moves the conversation beyond trading.
The long-term opportunity for exchanges is increasingly about connecting the full user journey: holding assets → trading → investing → payments → accessing traditional markets.
What does all of this mean?
Gate’s July report suggests the platform is building toward a much broader financial ecosystem.
Crypto remains the foundation, but the product direction now increasingly includes:
Crypto → Stocks → ETFs → IPOs → RWA → Web3 → Payments
That diversification could become strategically important as the boundaries between traditional finance and digital assets continue to narrow.
The most important metric may therefore not be any single July number.
It is whether Gate can successfully combine liquidity, product diversity, reserve transparency and global accessibility while continuing to scale.
July’s report suggests that expansion is continuing on multiple fronts.
The bigger question is what this ecosystem looks like by the end of 2026.
#StockTradingShareChallenge @Gate_Square
repost-content-media
  • Reward
  • 2
  • Repost
  • Share
Yunna:
LFG 🔥
View More
#MemoryChipsRally
Memory Chips Are Becoming the Next AI Bottleneck
The AI rally is expanding beyond GPUs.
Memory-chip stocks have been showing powerful momentum, with SK hynix, SanDisk, Micron and Seagate among the names attracting strong buying interest. The move reflects a deeper shift inside the AI infrastructure cycle: as data centers become larger and AI models become more demanding, the need for high-bandwidth memory, DRAM and storage is accelerating.
The most important part of this cycle is HBM.
AI accelerators require enormous amounts of high-speed memory to process increasingly compl
MrFlower_XingChen
#MemoryChipsRally
Memory Chips Are Becoming the Next AI Bottleneck
The AI rally is expanding beyond GPUs.
Memory-chip stocks have been showing powerful momentum, with SK hynix, SanDisk, Micron and Seagate among the names attracting strong buying interest. The move reflects a deeper shift inside the AI infrastructure cycle: as data centers become larger and AI models become more demanding, the need for high-bandwidth memory, DRAM and storage is accelerating.
The most important part of this cycle is HBM.
AI accelerators require enormous amounts of high-speed memory to process increasingly complex workloads. As hyperscalers continue investing billions into AI data centers, memory has become a critical component of the infrastructure buildout rather than a secondary hardware category.
That is already showing up in company results.
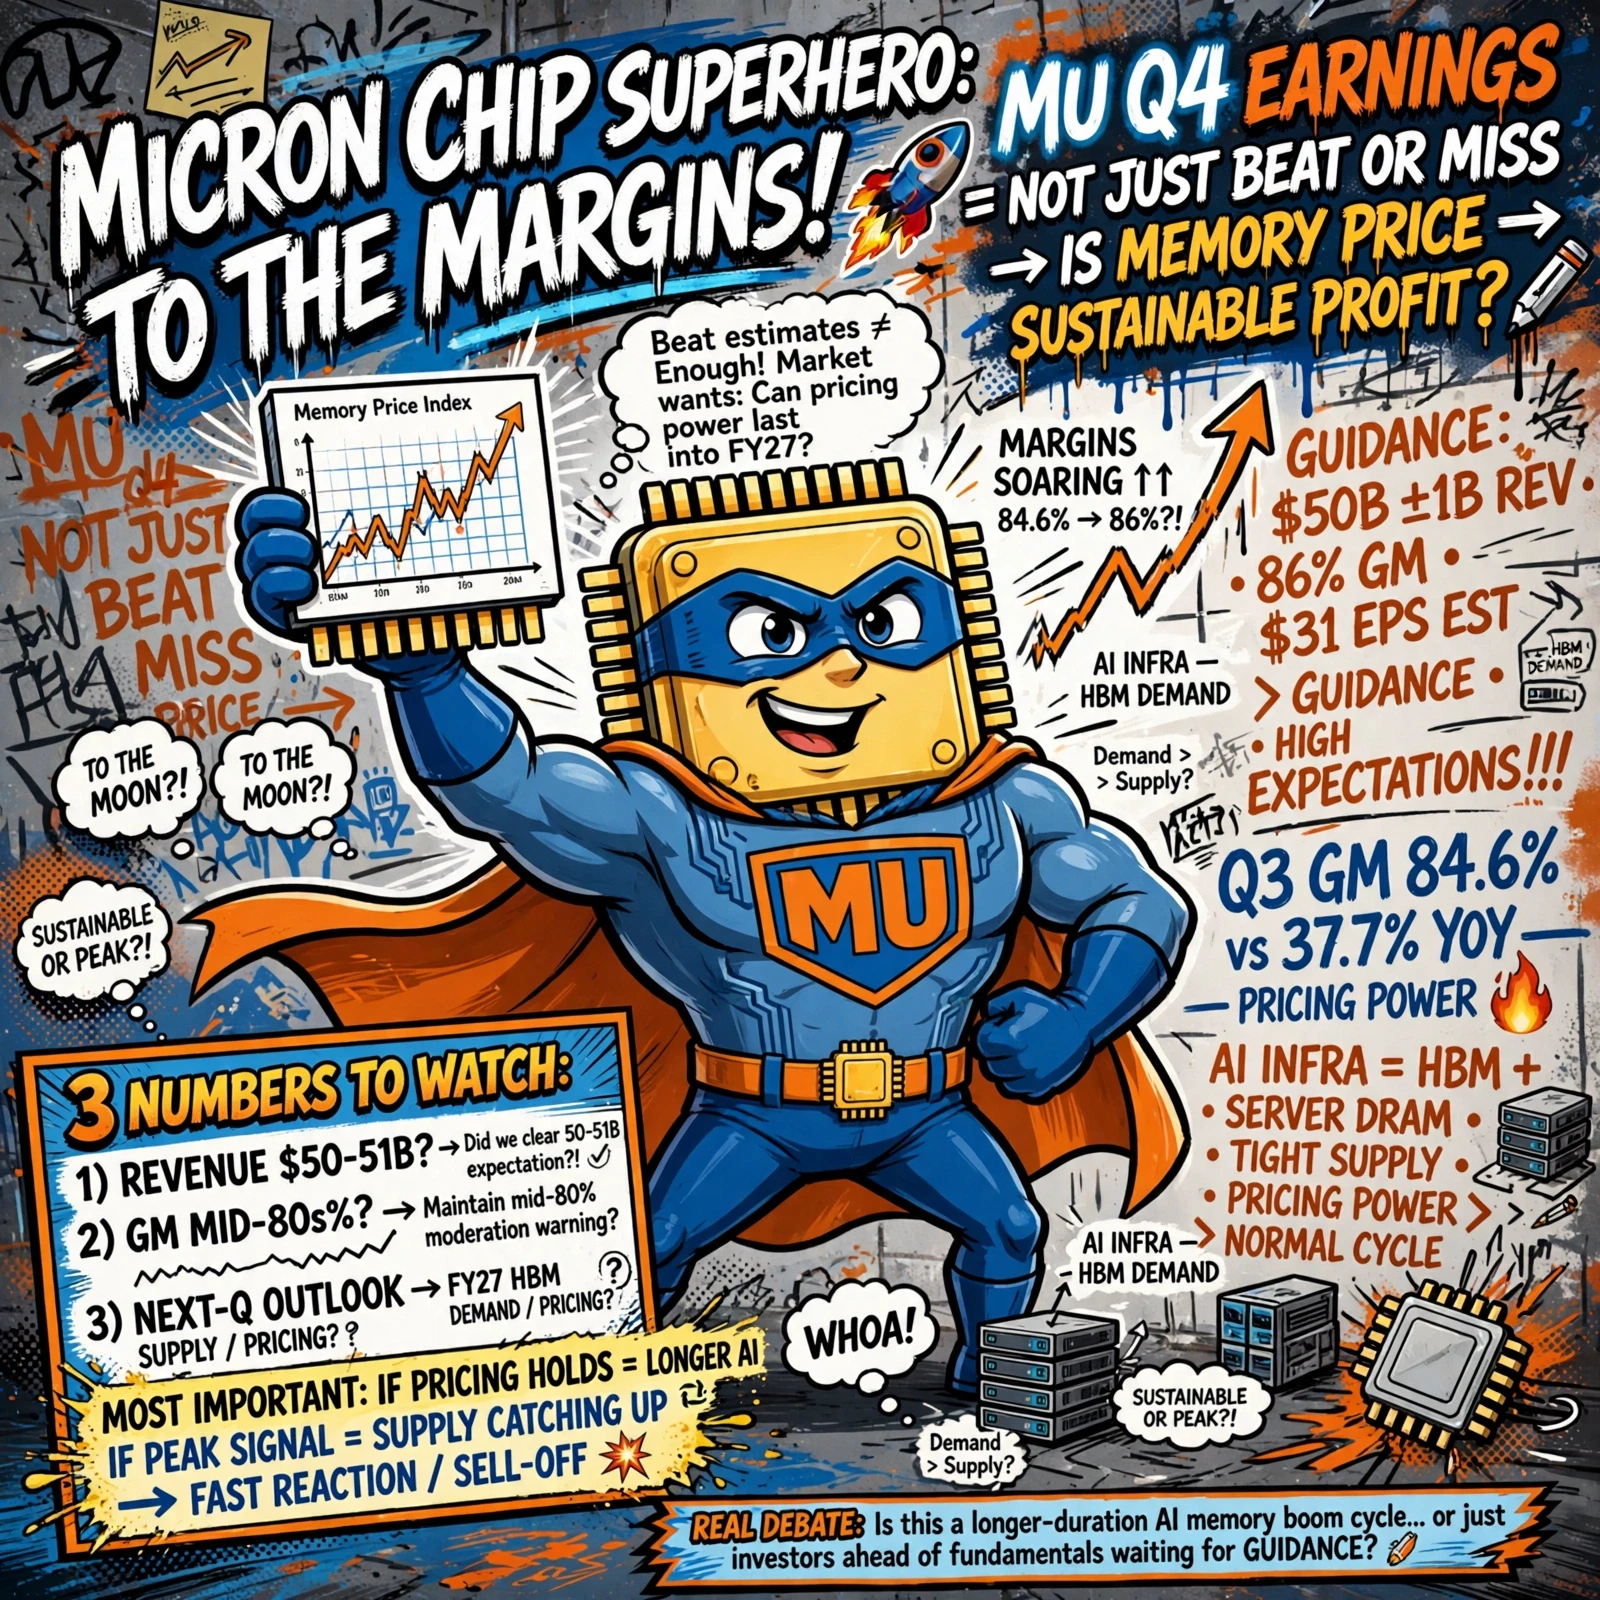
Micron recently reported record quarterly revenue of around $41.5 billion, while management highlighted exceptionally strong demand across data-center memory and continued strength in HBM. The company has also indicated that supply conditions remain tight as AI demand continues to reshape the memory market.
This creates a powerful setup for the sector.
When demand grows faster than supply, memory pricing can rise, manufacturers gain pricing power and margins expand. That combination can create a very strong earnings cycle for companies such as MU and SK hynix.
But there is another side to the story.
Memory is historically cyclical.
If manufacturers respond to today's high prices by aggressively expanding capacity, the current shortage can eventually turn into oversupply. That means investors need to watch memory prices, HBM capacity, capital expenditure, AI infrastructure spending and inventory levels just as closely as AI demand itself.
This is also why the recent strength in memory stocks should not automatically be interpreted as an unlimited rally.
The market is already pricing in substantial AI-driven growth. From here, companies will increasingly need to beat expectations, not simply meet them.
Why MU stands out
Micron sits directly inside several of the strongest trends in semiconductor infrastructure:
HBM → AI accelerators → Data centers → DRAM → NAND → Enterprise storage
That gives MU significant exposure to the continued expansion of AI computing.
The fundamental setup remains attractive as long as hyperscaler spending stays strong and memory supply remains disciplined. But after a major price move, valuation becomes increasingly important because even excellent earnings can produce a weak stock reaction if expectations have moved too far ahead.
The bigger picture is clear:
AI is not only creating demand for more computing power. It is creating demand for more memory, more bandwidth and more storage.
That makes the memory industry one of the most important second-order beneficiaries of the AI infrastructure boom.
The current rally has a genuine fundamental engine behind it. The next stage, however, will depend on whether AI-driven demand continues growing faster than memory supply.
For MU and the broader memory sector, that supply-demand balance is becoming the central variable of the entire cycle.
@Gate_Square
#StockTradingShareChallenge
repost-content-media
  • Reward
  • 2
  • Repost
  • Share
Yunna:
LFG 🔥
View More
#MemoryChipsRally
Memory Chips Are Becoming the Next AI Bottleneck
The AI rally is expanding beyond GPUs.
Memory-chip stocks have been showing powerful momentum, with SK hynix, SanDisk, Micron and Seagate among the names attracting strong buying interest. The move reflects a deeper shift inside the AI infrastructure cycle: as data centers become larger and AI models become more demanding, the need for high-bandwidth memory, DRAM and storage is accelerating.
The most important part of this cycle is HBM.
AI accelerators require enormous amounts of high-speed memory to process increasingly compl
post-image
post-image
  • Reward
  • 8
  • 2
  • Share
DuniaForexCrypto:
Keep building, friend.
View More
#GateJulyTransparencyReportReleased
Gate’s July 2026 Transparency Report highlights a broader transformation taking place across its platform: trading activity continues to expand while the product ecosystem is moving deeper into TradFi, IPO access, payments, Web3 and multi-asset services.
The headline numbers are significant.
117% overall reserve ratio
$260M+ cumulative OpenAI Pre-IPO subscriptions
36%+ peak event-contract market share
135%+ peak Launchpool SLX APR
Up to 8% Gate Card cashback
200+ countries and regions covered
But the real story is the combination of these developments.
Trad
OPENAI1.14%
SLX1.90%
RWA-1.49%
post-image
post-image
  • Reward
  • 10
  • 2
  • Share
LittleQueen:
To The Moon 🌕
View More
#JulyCPIInLineAsInflationCools
US July CPI: Cooling Inflation, But Not Yet a New Crypto Catalyst
The latest US inflation report delivered a message markets were hoping for — but not a dramatic one.
July CPI rose 3.4% year over year, down from 3.5% in June, while prices increased 0.2% month over month. Core CPI, excluding food and energy, also increased 0.2% MoM, with the annual core rate at 2.9%. The headline result broadly matched expectations, meaning the report did not deliver the kind of upside inflation surprise that could immediately push markets toward a more hawkish Federal Reserve st
BTC0.00%
post-image
  • Reward
  • 10
  • 2
  • Share
LittleQueen:
To The Moon 🌕
View More
#GateHits59MillionUsers
Gate Surpasses 59 Million Users — 60 Million Is Next
Gate has now surpassed 59 million global users, bringing the platform within just 1 million users of the 60 million milestone.
Since its founding in 2013, Gate has continued expanding its global multi-asset ecosystem, moving far beyond a single-asset crypto trading platform.
Today, the numbers tell the story:
59M+ global users
4,900+ crypto assets
12,500+ stock assets
Top-tier spot trading volume and liquidity
117% total reserve ratio
Nearly 500 user assets covered
The latest Proof of Reserves report, dated July 27,
BTC0.00%
ETH0.35%
post-image
  • Reward
  • 8
  • 2
  • Share
LittleQueen:
To The Moon 🌕
View More
#China10YearYieldFallsBelow1.7%
China’s 10Y Yield Is Sending a Bigger Macro Signal
China’s 10-year government bond yield is hovering around the 1.69%–1.70% area, while the 30-year yield remains near 2.16%–2.17%. ChinaBond data has already shown the long-end of the curve at historically low levels, highlighting how strong demand for government bonds has become.
The bigger story is not simply that yields are falling. It is why investors are willing to accept such low returns.
China’s July inflation data showed CPI rising just 0.5% year over year, reinforcing concerns about weak domestic demand
post-image
post-image
  • Reward
  • 9
  • 2
  • Share
LittleQueen:
LFG 🔥
View More
#GoogleDoublesDownOnGemini
Google Doubles Down On Gemini — This Is Bigger Than A Leadership Shuffle
Google is reorganizing its AI leadership at a critical moment in the global AI race.
Demis Hassabis is moving from day-to-day leadership of Google DeepMind into the roles of Chair of Google DeepMind and Chief Scientist of Alphabet, while Koray Kavukcuoglu, previously DeepMind’s CTO and Google’s chief AI architect, is taking over as Senior Vice President of Google DeepMind and reporting directly to Sundar Pichai.
The important part is not the job titles. It is the division of responsibility.
Has
GOOGL0.83%
post-image
  • Reward
  • 10
  • 2
  • Share
LittleQueen:
2026 GOGOGO 👊
View More
  • Pinned