


#StrongNonfarmPayrollsRekindleRateHikeFear
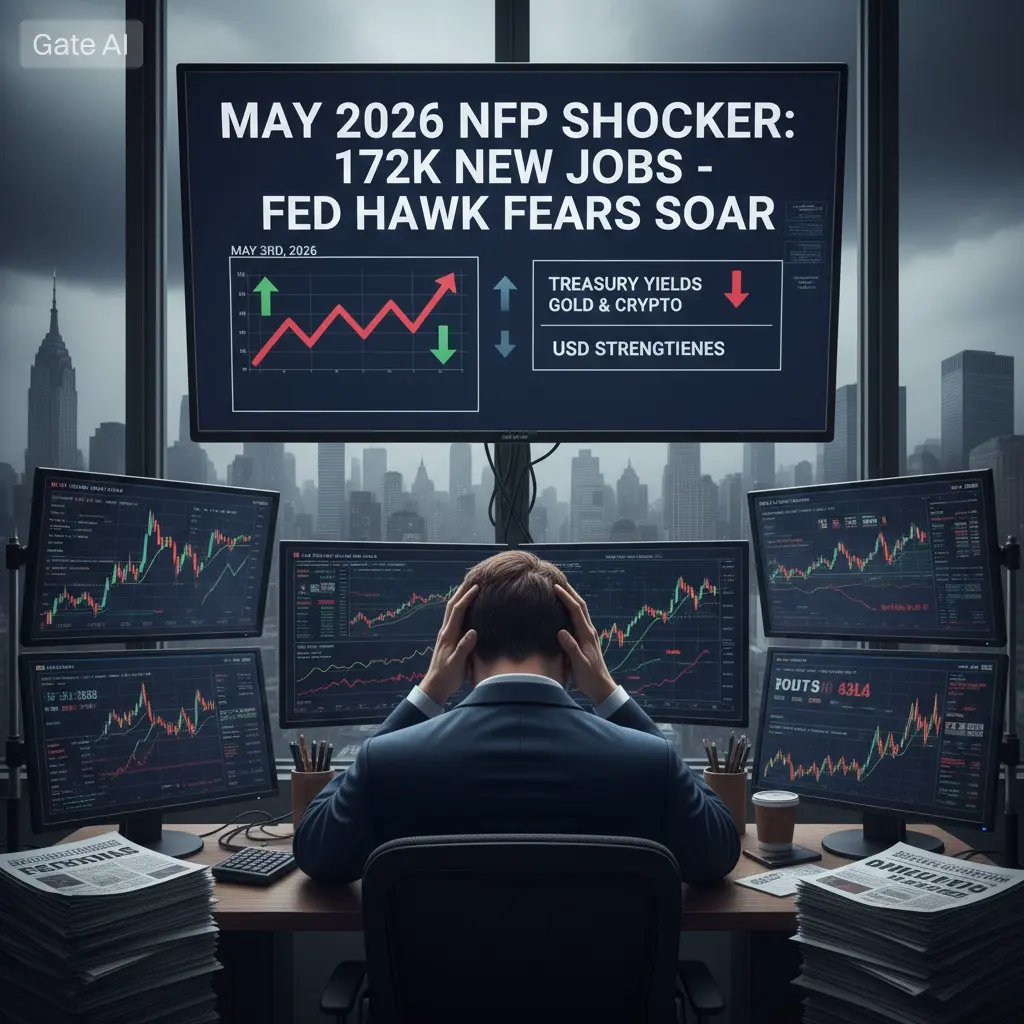
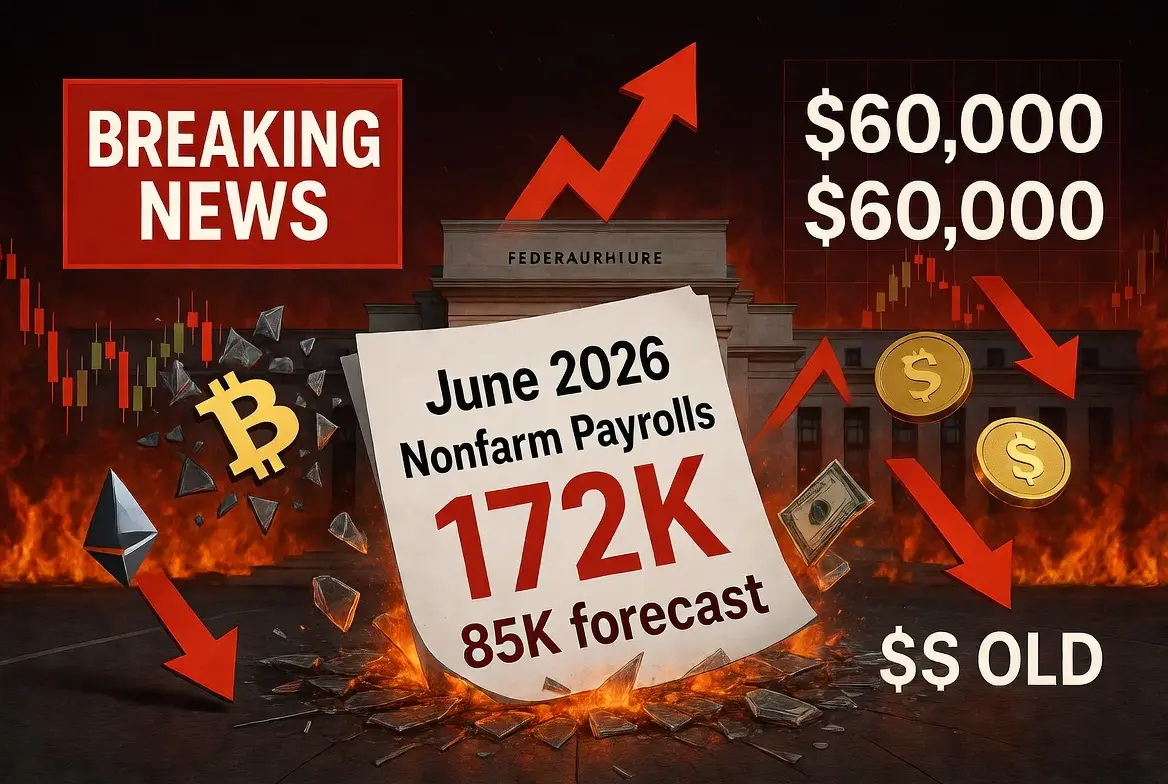
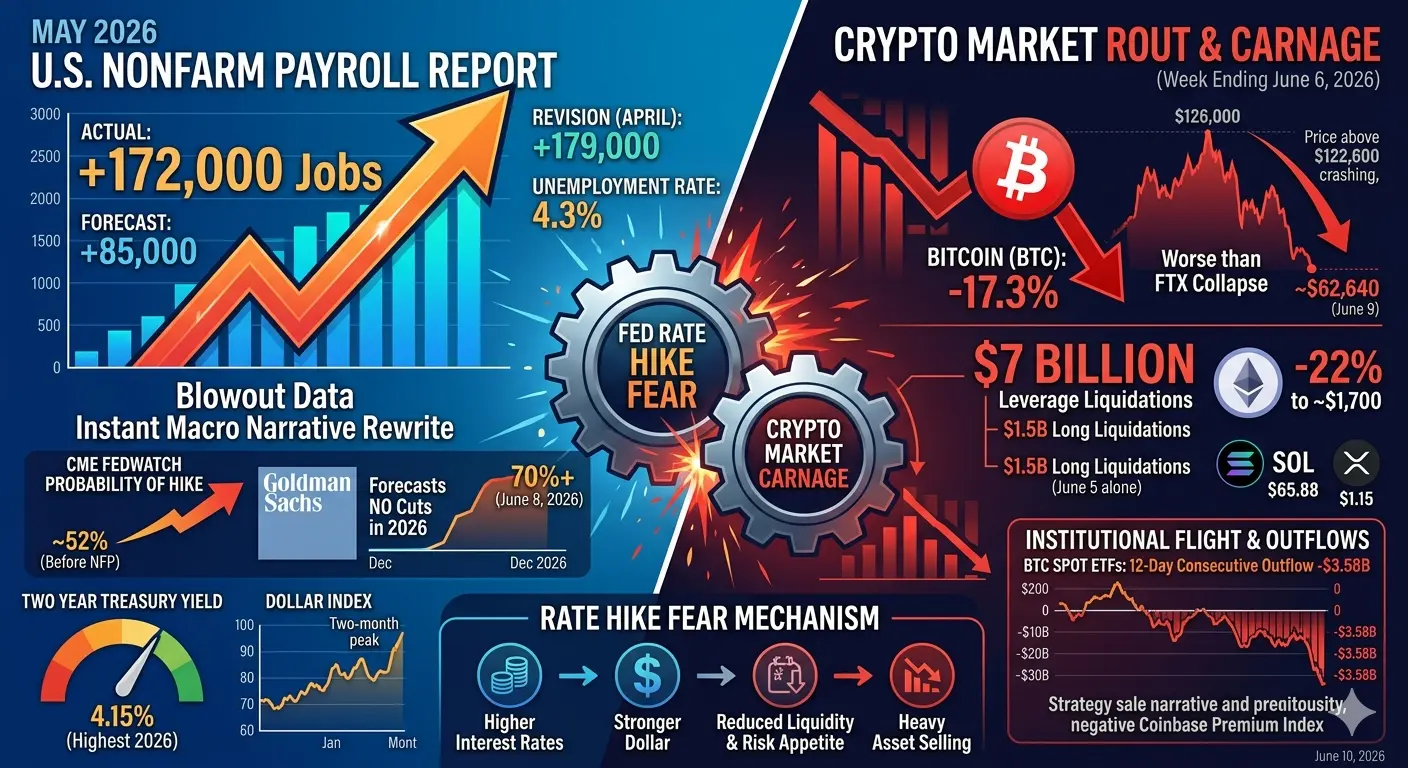
The May 2026 Non-Farm Payroll report just detonated across global markets, and the fallout is reshaping everything from Federal Reserve policy expectations to crypto valuations. The U.S. economy added 172,000 jobs in May, more than double the 85,000 that economists had forecast. April's figure was revised upward to 179,000, marking the strongest three-month hiring streak in over two years. The unemployment rate held flat at 4.3%, and average hourly earnings climbed 0.3% month-over-month, keeping wage pressure firmly in the picture. This was not just a beat; it was a blowout that instantly rewrote the macro narrative. Here are the six critical dimensions of this unfolding story.
Point 1: The Non-Farm Payroll Shock and What the Numbers Mean
When the Bureau of Labor Statistics released the May report on June 5, the market was bracing for a modest 85,000 job additions, which would have signaled a cooling labor market and given the Fed room to ease. Instead, 172,000 jobs materialized, and the prior two months were revised upward by a combined 64,000. This means the economy added an average of over 150,000 jobs per month across the last three months, a pace consistent with a healthy, expanding labor market rather than one that needs stimulus. The unemployment rate at 4.3% is historically low, and wage growth at 0.3% monthly translates to an annualized pace above 3.5%, meaning workers are still seeing real income gains. For a Federal Reserve that has been cautiously holding rates at 3.50%-3.75%, this data screams that the economy does not need rate cuts; if anything, it might need more restraint. The immediate market reaction was violent. Two-year Treasury yields, which are the most sensitive to Fed policy expectations, surged 11 basis points to 4.15%, the highest level this year. The dollar index rocketed to a two-month peak. Gold cratered more than 3% in a single session, its worst daily drop since March, with spot gold falling to $4,287 per ounce and gold futures settling at $4,353. The message from the data was clear: the labor market is not breaking down, it is breaking out.
Point 2: Fed Rate Hike Probability and How It Has Surged
Before the NFP release, CME's FedWatch tool showed roughly a 52% probability of a rate hike by December 2026. Within hours of the report, that probability jumped to 68.4%, and by Monday June 8, it had climbed above 70%. Some analysts at major banks now project the Fed could deliver two 25 basis-point hikes later this year, responding to both the labor market re-acceleration and the inflationary pressures from the ongoing Iran conflict driving oil prices above $100 per barrel. Goldman Sachs has officially scrapped its forecast for any rate cut in 2026 and pushed its first cut prediction to June 2027, with a second cut expected in December 2027. The brokerage's reasoning is telling: resilient activity and employment data lower the bar for a rate hike not because the economy is overheating, but because a stronger starting point reduces the risk that a hike could end up looking like a costly mistake. For the June FOMC meeting, the probability of holding rates steady at 3.50%-3.75% stands at 96.4%, effectively ruling out any immediate move. But the December timeline is where the real fear now lives. The shift from expecting rate cuts to pricing in rate hikes is a seismic reversal. Just weeks ago, markets were debating whether the Fed would cut once or twice this year. Now, the conversation has flipped to whether there will be one hike or two. This reversal is what the hashtag StrongNonfarmPayrollsRekindleRateHikeFear encapsulates: the fear that the Fed, seeing a resilient economy and rising inflation pressures from energy costs, may actually tighten further rather than loosen.
Point 3: What Rekindled Rate Hike Fear Means in Practical Terms
Rate hike fear is not just an abstract macro concept. It translates directly into tighter financial conditions across every asset class. When the market prices in higher future rates, the cost of borrowing increases immediately through the bond market, even before the Fed actually moves. Corporate bond yields rise, mortgage rates climb, and the discount rate applied to future earnings on equities and future cash flows on speculative assets like crypto increases. This means every asset that depends on cheap liquidity gets repriced downward. The dollar strengthens as foreign capital chases higher U.S. yields, draining liquidity from emerging markets and risk assets globally. Gold, which benefits from low real rates, gets hammered because higher nominal rates without offsetting inflation compression push real yields up. The two-year yield at 4.15% combined with inflation still running above target means real short-term rates are meaningfully positive, a hostile environment for zero-yield assets like gold and Bitcoin. For crypto specifically, the mechanism is brutal. Higher rates mean a stronger dollar, which historically correlates inversely with Bitcoin price action. Higher rates also mean reduced appetite for leveraged speculation, which is the engine that has driven crypto rallies in every cycle. When the cost of carry on leveraged positions rises and the macro backdrop signals that cheap money is not coming back, speculators unwind positions en masse, which is exactly what we witnessed on June 5.
Point 4: The Crypto Market Carnage and Key Price Levels
The crypto market has been under siege for weeks, and the NFP shock turned pressure into a full-blown rout. Bitcoin fell 17.3% over the week ending June 6, its worst weekly performance since the FTX collapse in November 2022. BTC touched a low below $60,000 on Friday, briefly hitting $59,800 before recovering to approximately $61,300 over the weekend. As of June 9, Bitcoin is trading around $62,640, still nursing severe losses from a peak above $126,000 in October 2025. That peak-to-current decline represents more than a 50% drawdown from the cycle high. Ethereum suffered even more, dropping 22% over the same week, with ETH falling to approximately $1,658 on June 5 before edging back toward the $1,700 range. ETH's underperformance versus BTC reflects the higher beta nature of altcoins in a risk-off environment. Solana edged down to around $65.88 with marginal recovery. XRP held relatively better at approximately $1.15, showing only modest declines. The total crypto market capitalization shed approximately $390 billion during the week, leaving total market cap hovering just above $2 trillion. Bitcoin open interest fell 22.7% to $46.27 billion, and Ethereum open interest dropped 26.6% to $25.06 billion, indicating massive deleveraging. Approximately $7 billion in leveraged positions were liquidated across the week, with $1.5 billion in long liquidations cascading on the day of the NFP release alone. The liquidation cascade briefly pushed Bitcoin below $60,000 for the first time since October 2024, a psychologically devastating level that erased the entire post-Trump election rally narrative.
Point 5: How Institutional Flows and ETF Dynamics Amplified the Damage
The NFP shock did not act alone. It landed on a crypto market already weakened by unprecedented ETF outflows and institutional capitulation. Spot Bitcoin ETFs had been on a 12-day consecutive outflow streak totaling $3.58 billion before the NFP release, and the payroll data accelerated that drain. The Coinbase Premium Index, which measures the difference between BTC prices on Coinbase versus offshore exchanges, plunged to -0.15%, meaning U.S. institutional buyers were effectively paying less for Bitcoin than global retail participants. This is a clear signal that American institutional demand has evaporated. Strategy, the largest corporate Bitcoin holder, briefly sold 32 BTC between May 26 and May 31, its first-ever Bitcoin sale, which sent shockwaves through the market even though the amount was tiny relative to its total holdings. The psychological impact was disproportionate: if the most committed corporate holder was selling, what did that say about conviction? Strategy later reversed course, purchasing 1,550 BTC between June 1 and June 7 at an average price of $65,332, funded by $181 million in equity sales, attempting to restore confidence. But the damage to sentiment was already done. The combination of persistent ETF outflows, the Strategy sale narrative, and then the NFP-driven rate hike repricing created a three-front assault on crypto valuations. Each factor alone would have caused volatility; together, they produced one of the worst weekly drawdowns in crypto history.
Point 6: What Comes Next and How to Navigate the Rate Hike Fear Era
Looking ahead, the path depends on whether the rate hike fear materializes into actual Fed tightening or remains a market repricing that eventually stabilizes. The June FOMC meeting on June 18 will almost certainly hold rates steady at 3.50%-3.75%, with a 96.4% probability priced in. The real drama begins with the July meeting and beyond. If subsequent employment and inflation data continue to surprise strong, the probability of a December hike will push above 80%, and the market may begin pricing in a July hike as well. That scenario would likely drive Bitcoin toward the $50,000-$55,000 support zone that Standard Chartered has warned about, and could push ETH below $1,500. Conversely, if the next few months of data show cooling, or if the geopolitical energy shock from the Iran conflict stabilizes, rate hike probabilities could retreat, potentially restoring a rate-hold or even rate-cut narrative by late 2026. Goldman Sachs now expects the Fed to wait until 2027 for cuts, meaning the no-cut baseline for the rest of 2026 is the mainstream consensus. For crypto investors, this means the macro headwind is structural and persistent, not transient. The era of rate-cut-driven rallies that powered crypto from late 2023 through early 2025 is over. The new regime demands a different approach: focus on assets and projects with fundamental value rather than pure speculation, manage leverage conservatively because the liquidation cascades are getting more violent, and watch the CME FedWatch probability as the single most important macro signal. A drop in the December hike probability below 50% would signal that the rate hike fear is fading and that a relief rally could materialize. Until that happens, crypto remains under macro pressure, and every strong economic data print will feel like another blow. The StrongNonfarmPayrollsRekindleRateHikeFear story is not a one-day event. It is the beginning of a new macro chapter where the labor market's strength paradoxically becomes the market's greatest threat.@Gate_Square #StrategyAdds1550BTCatLowerPrices