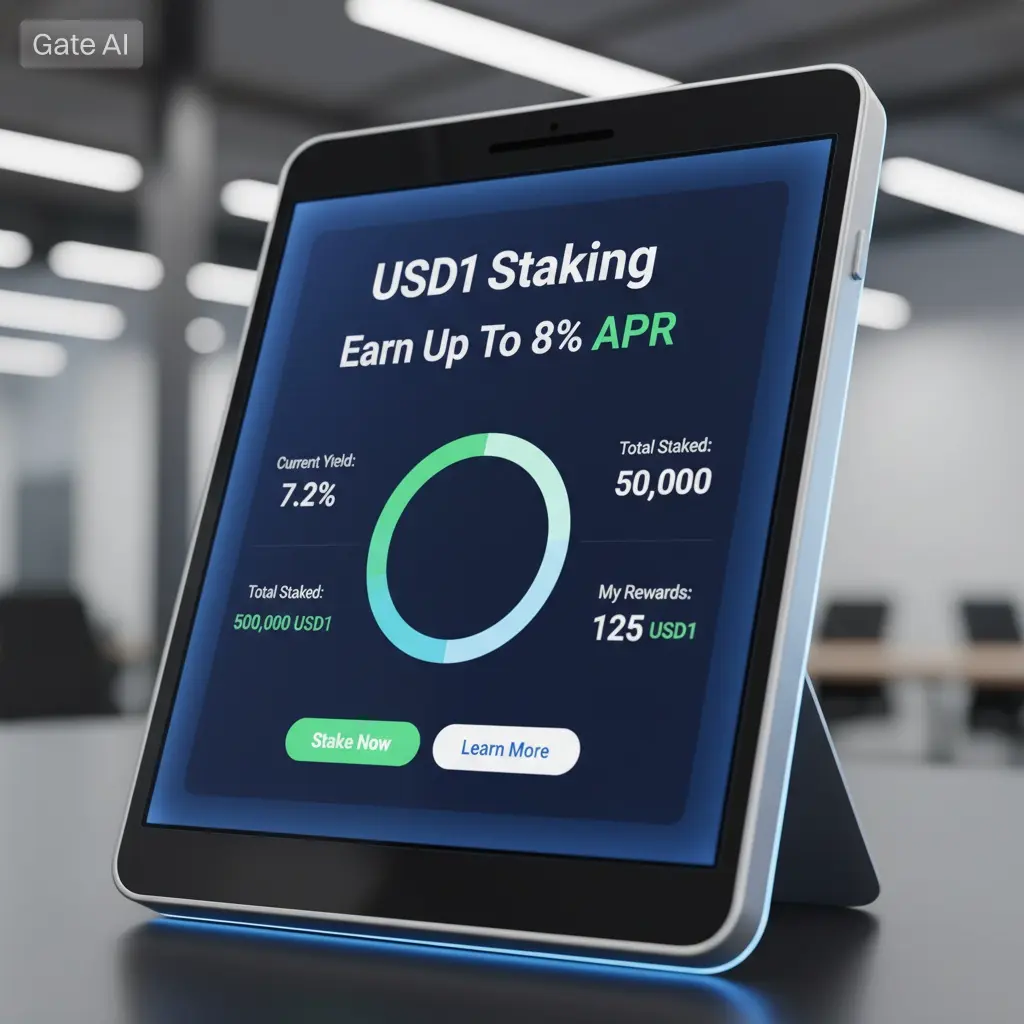
Yusfirah

vip
Age 1.5 Year
Peak Tier 5
No content yet
Pin
🎁 100% chance to win! Gate Square Issue 2️⃣0️⃣ Community Growth Points Lottery Carnival begins!
Zero threshold, no trading required, complete interactions to get lottery eligibility!
💰 Bonus boost: Up to $10,000 CFD trial voucher, can trade popular stocks!
Also prediction market trial vouchers, fee rebate vouchers, and other card voucher gift packs await your draw!
Every 300 points, draw directly 👇
https://www.gate.com/activities/pointprize?now_period=20
🌟 How to participate:
1️⃣ Post, comment, like, chat, easily earn growth points
2️⃣ Click the post button [+] to enter [Activity Center]
BTC0.43%
ETH0.35%
SPCX0.34%
post-image
  • Reward
  • 34
  • Repost
  • Share
2In1:
2026 GOGOGO 👊
View More
#ETHBreaks1700 #Ethereum #CryptoMarket #DeFi #Layer2
Ethereum Breaks Above $1,700: A Critical Breakout That Could Shape the Next Phase of the Crypto Market
Ethereum has successfully reclaimed the $1,700 level, delivering one of the most significant technical developments in the cryptocurrency market over recent sessions. This breakout is more than a simple price milestone—it represents a shift in market psychology, improving investor confidence, and renewed optimism surrounding the broader digital asset ecosystem. After spending weeks consolidating below a major resistance zone, Ethereum has
ETH0.35%
post-image
post-image
  • Reward
  • 3
  • Repost
  • Share
ThisIsTranslateContent::
Steadfastly HODL💎
View More
#ETH
Ethereum is currently trading at approximately 1,770 dollars, representing a remarkable recovery of 18 percent from its recent low of 1,500 dollars observed just five days ago. This substantial price appreciation of 270 dollars within a compressed timeframe signals renewed bullish momentum and growing investor confidence across retail and institutional segments. The current market structure suggests Ethereum is positioned at a critical decision zone where sustained momentum could propel prices toward the psychologically significant 2,000 dollar threshold.
Technical Analysis and Price Str
HighAmbition
#ETH
Ethereum is currently trading at approximately 1,770 dollars, representing a remarkable recovery of 18 percent from its recent low of 1,500 dollars observed just five days ago. This substantial price appreciation of 270 dollars within a compressed timeframe signals renewed bullish momentum and growing investor confidence across retail and institutional segments. The current market structure suggests Ethereum is positioned at a critical decision zone where sustained momentum could propel prices toward the psychologically significant 2,000 dollar threshold.
Technical Analysis and Price Structure
From a technical perspective, Ethereum has successfully reclaimed multiple key demand zones that were previously lost during the broader market correction. The price action demonstrates a clear breakout above the 1,700 dollar support level, which has now flipped into a dynamic support zone. Current technical indicators present a mixed but cautiously optimistic outlook. The Relative Strength Index on the 4-hour timeframe registers approximately 72.6, placing Ethereum in technically overbought territory and suggesting potential short-term consolidation or pullback before the next leg higher. However, the daily RSI shows a more moderate reading around 39.8, indicating substantial room for further upside before reaching overextended conditions.
The Williams Percent Range indicator currently reads negative 9.94, which confirms the overbought conditions on shorter timeframes. The daily Stochastic oscillator shows values near 110.28, demonstrating momentum strength but also highlighting the need for caution as these elevated readings often precede temporary corrections. The Moving Average Convergence Divergence indicator on multiple timeframes has generated bullish crossovers, with the MACD line positioned above the signal line, supporting the continuation of the current uptrend.
Key Support and Resistance Levels
Critical support levels for Ethereum are established at 1,750 dollars, 1,700 dollars, and the deeper support zone between 1,400 and 1,530 dollars. The 1,750 dollar level represents the 4-year trendline support that has been tested multiple times throughout 2026, making it a crucial line in the sand for bulls. A sustained break below this level would invalidate the current bullish structure and open the path toward the 1,400 dollar support zone.
On the resistance side, immediate resistance is encountered at 1,800 dollars, followed by the major psychological barrier at 1,846 dollars. Beyond this level, the 1,944 dollar mark represents a significant technical resistance where previous selling pressure emerged. The ultimate target for this bullish phase remains the 2,000 dollar level, which coincides with the weekly Fast Moving Average line and represents a 12.99 percent gain from current prices. More ambitious projections from technical analysts suggest potential extensions toward 2,200 dollars to 2,350 dollars if momentum sustains, representing an additional 24.29 percent to 32.77 percent appreciation from present levels.
Institutional Accumulation and Whale Activity
The fundamental backdrop supporting Ethereum's recovery has strengthened considerably through substantial institutional buying and whale accumulation. BlackRock's iShares Ethereum Trust ETF, ticker symbol ETHA, has emerged as the dominant force in institutional Ethereum adoption. Recent data indicates that ETHA captured 29.7 million dollars in inflows on July 2, 2026, representing the second consecutive day of positive flows across the entire Ethereum ETF complex. BlackRock's Ethereum ETF has accumulated approximately 6.5 billion dollars in assets under management, establishing it as the undisputed heavyweight among Ethereum spot ETFs.
Fidelity's Ethereum Fund, designated FETH, contributed an additional 0.8 million dollars in inflows on the same day, while VanEck added 1.2 million dollars. The cumulative net inflows across all nine Ethereum spot ETFs have surpassed 1.5 billion dollars since their July 2024 launch, demonstrating sustained institutional appetite for regulated Ethereum exposure. This institutional participation represents a fundamental shift in how traditional finance accesses cryptocurrency markets, providing a regulated gateway for conventional investors seeking Ethereum exposure without direct custody requirements.
On-chain data reveals significant whale accumulation activity, with addresses holding more than 10,000 Ethereum purchasing over 140,000 Ethereum within recent days. This accumulation of approximately 246.6 million dollars worth of Ethereum by large holders signals strong conviction among sophisticated market participants regarding Ethereum's long-term value proposition. The whale accumulation trend has been particularly pronounced near key support areas, suggesting that large holders view current price levels as attractive entry points for long-term positioning.
Trading Strategy and Risk Management
For active traders, the current Ethereum setup presents both opportunity and risk that requires careful position management. The optimal trading strategy involves monitoring the 1,750 to 1,800 dollar range for directional confirmation. A weekly close above 1,800 dollars would trigger a high-probability move toward the 2,000 dollar target, representing a 12.99 percent upside from current levels. Traders should establish long positions with stop-loss orders placed below 1,670 dollars, which represents the invalidation point for the current bullish setup.
Risk management parameters should account for the overbought conditions on shorter timeframes. The 4-hour RSI reading of 72.6 suggests that a pullback toward the 1,750 dollar support zone is probable before the next leg higher. Traders can utilize this potential retracement as an opportunity to scale into positions at more favorable risk-reward ratios. The risk-reward profile for Ethereum longs remains attractive, with potential upside of 230 dollars to 2,000 dollars versus downside risk of approximately 100 dollars to the invalidation level.
Short-term price targets include 1,846 dollars as the first take-profit level, representing a 4.29 percent gain from current prices. The second target at 1,944 dollars offers 9.83 percent upside, while the third target at 2,050 dollars represents 15.82 percent appreciation. These targets align with historical resistance levels and Fibonacci retracement zones that have previously acted as price magnets during bullish phases.
Market Sentiment and Trader Consensus
Trader sentiment across social media platforms and professional analysis channels has shifted decisively toward cautious bullishness. Multiple professional traders describe the current price action as a strong trend reversal with bullish shift building momentum. The refusal of Ethereum to make new lows, combined with every dip being bought aggressively, supports the narrative of underlying demand strength. The sentiment analysis indicates that traders are positioning for a push toward the 2,000 dollar target next week if Ethereum secures the 1,750 to 1,800 dollar range.
ETF inflows, which increased nearly 12 percent this week according to available data, combined with easing inflationary fears and shifting Federal Reserve policy expectations, are cited as primary tailwinds supporting a reversion to the 2,000 dollar level in the coming weeks. Regulatory concerns continue to cap the upside sentiment to some extent, but overall market chatter targets 2,000 dollars and beyond with potential extensions to 2,200 dollars to 2,350 dollars according to optimistic analyst projections.
Percentage Calculations and Mathematical Analysis
The recovery from 1,500 dollars to 1,770 dollars represents a gain of 270 dollars, which translates to exactly 18 percent appreciation over five trading days. This calculates to an average daily gain of 3.6 percent during the recovery phase. The distance from current prices at 1,770 dollars to the 2,000 dollar target is 230 dollars, representing a required gain of 12.99 percent. If Ethereum achieves the 2,000 dollar target, the total recovery from the 1,500 dollar low would amount to 500 dollars, representing a 33.33 percent gain.
The risk-reward ratio for a long position from current levels with a stop at 1,670 dollars and target at 2,000 dollars calculates to 2.3 to 1, meaning traders risk 100 dollars to potentially gain 230 dollars. This represents a favorable asymmetric opportunity for disciplined traders. The probability-weighted expected value of this trade, assuming a 60 percent probability of reaching target and 40 percent probability of hitting stop-loss, yields a positive expected return of 98 dollars per unit of Ethereum traded.
Weekly price volatility has averaged approximately 8.5 percent over the past month, suggesting that the 12.99 percent move required to reach 2,000 dollars is within normal market parameters and achievable within a one to two week timeframe if momentum sustains. The correlation between Ethereum and Bitcoin price movements remains elevated at approximately 0.85, meaning Ethereum will likely follow any significant Bitcoin directional moves with amplified volatility.
Next Seven Days Price Forecast
The seven-day outlook for Ethereum remains constructive with a bias toward the upside, contingent upon maintaining support above the 1,750 dollar level. The most probable scenario involves Ethereum consolidating in the 1,750 to 1,850 dollar range for the first two to three days of the week, allowing overbought technical indicators to normalize while building a base for the next advance. Following this consolidation period, a push toward the 1,900 to 1,950 dollar zone becomes likely, with the 2,000 dollar psychological level representing the primary target for the week ending July 12, 2026.
Alternative scenarios include a deeper retracement toward 1,700 dollars if the 1,750 dollar support fails to hold, which would delay the 2,000 dollar target but potentially create an even more attractive entry point for long-term investors. The bearish scenario, with probability estimated at 25 percent, involves a break below 1,670 dollars that would invalidate the current bullish structure and open the path toward 1,550 dollars.
Conclusion and Strategic Recommendations
Ethereum stands at a critical juncture where technical recovery aligns with fundamental institutional support to create a favorable risk-reward environment for long positions. The combination of whale accumulation exceeding 140,000 Ethereum, institutional ETF inflows surpassing 29 million dollars in recent sessions, and improving technical momentum supports the case for continued appreciation toward the 2,000 dollar target. Traders should maintain disciplined risk management with stop-loss orders below 1,670 dollars while targeting 1,846 dollars, 1,944 dollars, and ultimately 2,000 dollars as take-profit levels. The 18 percent recovery from 1,500 dollars demonstrates the resilience of Ethereum demand, and the path toward 2,000 dollars represents an additional 12.99 percent opportunity for participants who maintain proper position sizing and risk controls.
#ETHMarketAnalysis #ETHBreaks1700 @Gate_Square
repost-content-media
  • Reward
  • 4
  • Repost
  • Share
ThisIsTranslateContent::
Just go for it 👊
View More
#CanadaVsMorocco #WorldCup2026 #KnockoutStage #Football #GatePolymarket
Canada vs Morocco: Knockout Football Reaches a New Level as Two Determined Nations Battle for a Place in the Quarterfinals
The 2026 FIFA World Cup has officially entered its most unforgiving stage, where every match is an all-or-nothing battle and every decision can determine whether a nation's dream continues or comes to an end. Today's Round of 16 showdown between Canada and Morocco is one of the tournament's most anticipated fixtures, bringing together the tournament hosts and one of international football's most respe
post-image
post-image
  • Reward
  • 3
  • Repost
  • Share
ThisIsTranslateContent::
Firmly HODL💎
View More
#WeakNFPShakesRateHikeOdds
#Inflation #Crypto #Stocks
Weak U.S. Jobs Data Reshapes Rate Hike Expectations as Global Markets Reprice the Economic Outlook
The latest U.S. Non-Farm Payrolls (NFP) report has become one of the most closely watched macroeconomic developments, delivering weaker-than-expected employment growth and prompting investors to reassess the outlook for Federal Reserve monetary policy. The softer labor market data suggests that hiring momentum is cooling after months of resilience, reinforcing expectations that policymakers may have less urgency to maintain restrictive inter
BTC0.43%
post-image
  • Reward
  • 3
  • Repost
  • Share
ThisIsTranslateContent::
Get in quickly!🚗
View More
I'm trading on Gate, a top-tier exchange with a 13-year track record. Come join me and dive into the hottest events right now! https://www.gate.com/campaigns/5353?ch=4418&ref=VLJNBLTXUG&ref_type=132
post-image
  • Reward
  • 8
  • Repost
  • Share
ShainingMoon:
To The Moon 🌕
View More
🇨🇦 Canada vs Morocco, the Round of 16 knockout match officially begins!
The World Cup has entered the Round of 16, with host Canada facing Morocco. Canada has home-field advantage, while Morocco continues its dark horse momentum. Do you favor Canada to advance, or Morocco to create another surprise?
⏰ Match time: July 5, 2026, 01:00 (UTC+8)
👉 Participate in predictions: https://gate.onelink.me/Hls0/prediction?page=detail&event_ticker=650867&source=cex
Come to Gate Polymarket and predict this Round of 16 knockout match!
GateSquare
🇨🇦 Canada vs Morocco, the Round of 16 knockout match officially begins!
The World Cup has entered the Round of 16, with host Canada facing Morocco. Canada has home-field advantage, while Morocco continues its dark horse momentum. Do you favor Canada to advance, or Morocco to create another surprise?
⏰ Match time: July 5, 2026, 01:00 (UTC+8)
👉 Participate in predictions: https://gate.onelink.me/Hls0/prediction?page=detail&event_ticker=650867&source=cex
Come to Gate Polymarket and predict this Round of 16 knockout match!
repost-content-media
  • Reward
  • 8
  • Repost
  • Share
ShainingMoon:
To The Moon 🌕
View More
MORNING MARKET UBDATE
107 views
2026-07-05 03:06
  • Reward
  • 4
  • Repost
  • Share
ShainingMoon:
To The Moon 🌕
View More
#gStocksTokenizedStocksLive
#gStocksLaunch #TokenizedStocks
Gate gStocks Officially Launches: A Major Step Toward Bringing Global Equity Markets On-Chain
The official launch of Gate gStocks represents one of the most meaningful developments in the evolution of blockchain-powered finance. As digital assets continue expanding beyond cryptocurrencies, the integration of tokenized real-world assets is becoming a defining trend for the next generation of global investing. Gate gStocks demonstrates how blockchain technology can enhance accessibility, efficiency, transparency, and flexibility while
post-image
  • Reward
  • 10
  • Repost
  • Share
BeautifulDay:
To The Moon 🌕
View More
good
ShainingMoon
#Get2SharesOfSKHynixAtZeroCost
🚀 Get 2 FREE Shares of SK Hynix Worth Up to $3,400 — The Biggest Korean Stock Reward Event of 2026!
🔥 Introduction
What if your normal trading activity could earn you up to 2 full shares of SK Hynix completely free?
That's exactly what Gate is offering through its latest Korean Stocks promotion. From June 23, 2026, to June 30, 2026, traders have a unique chance to accumulate SK Hynix stock rewards simply by participating in stock trading activities on the platform.
With SK Hynix now standing at the center of the global AI revolution and recently overtaking Samsung Electronics in market value, this campaign could become one of the most valuable stock reward events of the year.
🎯 Why Everyone Is Talking About SK Hynix
SK Hynix is no ordinary semiconductor company.
✅ World's leading producer of High Bandwidth Memory (HBM)
✅ Key supplier for NVIDIA's AI chips
✅ Most 2026 HBM production already sold out
✅ Recently surpassed Samsung Electronics in market capitalization
✅ Filed a massive $29.4 Billion Nasdaq ADR listing
✅ Direct beneficiary of the global Artificial Intelligence boom
As AI demand continues exploding worldwide, SK Hynix has become one of the most sought-after semiconductor stocks among institutional investors.
💰 How To Earn 2 Shares For Free
Gate has divided rewards into three major categories.
1️⃣ Registration Reward Pool
This is the easiest reward available.
The first 2,000 eligible users who have never traded stocks on Gate can share a reward pool worth approximately 3,400 USDT in SK Hynix stock rewards.
Requirements:
✔ Register during the campaign
✔ Be a new stock trader
✔ Claim your spot before the pool fills
No large capital is required.
Early registration significantly improves your chances.
2️⃣ First Trade Reward
New users can unlock additional rewards simply by placing their first stock trade.
Qualification:
• Trade SK Hynix or Samsung Electronics
• Reach at least 500 USDT cumulative trading volume
• Receive 5–17 USDT equivalent in SK Hynix rewards
Prize Pool:
17,000 USDT
First Come — First Served
This means your capital remains yours while
receiving extra stock rewards on top.
3️⃣ Buy Stocks, Get Stocks Airdrop
This is where the real opportunity begins.
For every:
10,000 USDT Trading Volume
Users receive a random SK Hynix stock airdrop.
Reward Range:
• 0.01 Share
to
• 0.50 Share
Maximum Reward:
2 Full SK Hynix Shares
Estimated Value:
≈ 3,400 USDT
Higher trading volume increases your ranking
and your chances of receiving larger rewards.
📊 Step-by-Step Participation Guide
Step 1
Register through the official event page.
Step 2
Open:
Stocks → Korean Stocks
Step 3
Transfer USDT to your Stock Account.
Step 4
Trade during Korean market hours:
00:00–06:20 UTC
Step 5
Increase cumulative volume to unlock larger rewards.
📈 SK Hynix Technical Outlook
Current Price Range
1,700–1,800 USDT
Resistance Levels
🔴 R1: 1,850 USDT
🔴 R2: 1,905 USDT
🔴 R3: 2,015 USDT
🔴 ATH Zone: 2,030 USDT
Support Levels
🟢 S1: 1,690 USDT
🟢 S2: 1,585–1,655 USDT
🟢 S3: 1,380 USDT
Trend Analysis
Short-Term Outlook:
Bearish Correction
Long-Term Outlook:
Strong Bullish Trend
Overall Market Bias:
Bullish
Current weakness appears to be a temporary correction within a much larger AI-driven uptrend.
🤖 The AI Revolution Is Fueling SK Hynix
Several major developments continue supporting long-term growth.
NVIDIA Partnership Expansion
NVIDIA CEO Jensen Huang recently highlighted
SK Hynix's importance during Computex 2026.
The partnership focuses on next-generation AI memory solutions for future AI factories.
HBM4E Technology Leadership
SK Hynix recently shipped 12-layer HBM4E samples featuring:
✔ 16Gbps speed
✔ Lower heat generation
✔ Improved efficiency
This strengthens its leadership position over competitors.
2026 Supply Already Sold Out
Most HBM production capacity for 2026 has already been reserved.
Demand continues exceeding supply.
This creates powerful pricing strength and revenue growth potential.
Nasdaq Listing Catalyst
The company recently announced plans for a massive Nasdaq ADR listing worth approximately 29.4 Billion USD.
Following the announcement, shares surged significantly as investors anticipated broader international participation.
⚠️ Recent Market Crash Explained
On June 23, semiconductor stocks experienced a sharp selloff.
SK Hynix dropped more than 12%.
Samsung Electronics also faced heavy selling pressure.
The broader market panic was driven by:
• NVIDIA production concerns
• Profit taking
• Global technology sector weakness
However, industry analysts continue viewing this as a healthy correction rather than the end of the AI boom.
The core fundamentals remain extremely strong.
💡 Best Strategy For Participants
Small Investors
Register immediately.
Complete the 500 USDT trading requirement.
Collect both registration and first-trade rewards.
Medium Traders
Target 10,000–40,000 USDT trading volume.
Unlock multiple airdrop opportunities.
High-Volume Traders
Aim for the maximum 2-share reward.
Combine all Korean stock campaigns to maximize earnings.
Potential rewards can exceed several thousand dollars in stock value.
⏳ Final Countdown
The campaign ends on:
June 30, 2026 — 16:00 UTC
Only a limited number of Korean trading sessions remain.
Every missed session reduces your opportunity to build volume and qualify for larger rewards.
🚀 Final Verdict
Gate's SK Hynix campaign is one of the most attractive stock reward events currently available.
Participants can potentially earn up to:
💰 2 FREE SK Hynix Shares
💰 Worth Approximately 3,400 USDT
💰 Plus Additional Rewards From Parallel Campaigns
With SK Hynix positioned at the center of the AI memory boom, sold-out HBM demand, expanding NVIDIA partnerships, and a major Nasdaq listing ahead, the company remains one of the strongest AI infrastructure plays globally.
If you were already planning to trade stocks, this promotion allows you to turn normal trading activity into real stock ownership at zero additional cost.
Register early, trade strategically, and maximize every reward tier before the event closes.
@ga
repost-content-media
  • Reward
  • 21
  • Repost
  • Share
ShainingMoon:
To The Moon 🌕
View More
#OUSDStablecoinLaunch
OUSD Stablecoin Launch Signals a Stronger Foundation for Stable Digital Finance
The official OUSD Stablecoin launch continues to attract attention across the digital asset industry as of July 4, 2026, highlighting the growing demand for reliable blockchain-based assets that combine price stability with practical utility. As the cryptocurrency market continues to mature, stablecoins have become an essential component of the global digital economy, serving as a bridge between traditional finance and decentralized financial infrastructure. The introduction of OUSD represent
post-image
  • Reward
  • 21
  • Repost
  • Share
EagleEye:
2026 GOGOGO 👊
View More
#TradFiCFDGoldMasters
#GateGoldLuckyBag #TradFiCFDGoldMasterCompetition
The Gold Lucky Bag Giveaway Continues to Reward Active Traders Across July
As of July 4, 2026, the Gate TradFi CFD Gold Master Competition remains one of the most engaging trading campaigns currently available, giving participants multiple opportunities each day to compete for a share of an impressive 1,020-gram gold reward pool. With the campaign entering its final week before concluding on July 11, 2026 (UTC+8), traders still have valuable time to qualify for hourly lucky draws by completing eligible CFD trading activ
XAU0.08%
post-image
  • Reward
  • 20
  • 2
  • Share
EagleEye:
To The Moon 🌕
View More
#GateCardPointsSystemLaunched
#GateCardPointsSystem
The official launch of the Gate Card Points System marks a significant step toward creating a more rewarding and user-focused digital payment experience. Rather than treating payments as simple transactions, the new ecosystem transforms everyday spending into a long-term value-building opportunity through cashback rewards, flexible payment options, permanent points accumulation, and an attractive tier progression model.
At the center of this upgrade is a powerful rewards mechanism designed to encourage active participation while giving user
GT0.29%
post-image
  • Reward
  • 19
  • 1
  • Share
EagleEye:
LFG 🔥
View More
#WeakNFPShakesRateHikeOdds
The Phantom Ledger: When Jobs Data Rewrites the Fed's Script 🎭
The Hook That Broke the Narrative
Picture this: You're a trader who has spent months watching the Federal Reserve telegraph rate hikes like a conductor leading an orchestra. The market was convinced—July was the month. Then Thursday morning hit, and the June Nonfarm Payrolls report dropped like a piano from a rooftop. Just 57,000 jobs created. Not the 113,000 everyone expected. Not even close. April and May? Revised down by a combined 74,000. The labor force participation rate? Fell 0.3 percentage point
BTC0.43%
ETH0.35%
US5000.46%
DragonFlyOfficial
#WeakNFPShakesRateHikeOdds
The Phantom Ledger: When Jobs Data Rewrites the Fed's Script 🎭
The Hook That Broke the Narrative
Picture this: You're a trader who has spent months watching the Federal Reserve telegraph rate hikes like a conductor leading an orchestra. The market was convinced—July was the month. Then Thursday morning hit, and the June Nonfarm Payrolls report dropped like a piano from a rooftop. Just 57,000 jobs created. Not the 113,000 everyone expected. Not even close. April and May? Revised down by a combined 74,000. The labor force participation rate? Fell 0.3 percentage points to 61.5%. Nearly 832,000 people simply walked away from the workforce entirely. The unemployment rate ticked down to 4.2%, but here's the cognitive bias trap most traders fell into: they saw "lower unemployment" and thought "strong economy." Dead wrong. This was the "Exodus Illusion"—a phenomenon I call the Labor Force Mirage, where headline unemployment drops not because people found jobs, but because they stopped looking altogether. When 832,000 workers vanish from the labor pool, the math gets distorted, and the real story hides in plain sight.
Why the Fed Just Lost Its Conviction
The Federal Reserve has been laser-focused on one narrative: the labor market is too tight, wages are sticky, and inflation demands action. But this jobs report just pulled the rug out from under that story. Here's the behavioral finance angle—markets suffer from recency bias, overweighting recent strong data while ignoring structural cracks. The prior three months of 100K+ job gains created a false sense of security. When reality diverges from consensus by 50%, that's not noise—that's signal. The CME FedWatch tool tells the story: July rate-hike odds collapsed below 20%, while December became the new focal point. Why? Because the Fed cannot hike into a labor market that's not just cooling, but potentially cracking. The participation rate decline to 61.5% is the lowest in over five years. That's not transitory. That's structural. Chair Warsh can talk tough on inflation all he wants, but when the data contradicts the narrative, even hawks start looking for exits.
The Great Rotation: Where the Money Flows
Let's talk cross-asset impact because this is where the real alpha lives. The U.S. Dollar Index (DXY) took a beating—down 0.5% on the day, heading for its biggest weekly drop since April. When rate-hike expectations evaporate, the dollar loses its yield advantage. Simple math. Gold? It exploded above $4,100, rallying 2%+ as real yields compressed and the "debasement trade" woke up from its slumber. Bitcoin and Ethereum caught a bid too—BTC pushing above $61K, ETH near $1,650—because when the Fed's hawkishness gets questioned, liquidity-sensitive assets breathe easier. U.S. Treasury yields? The 2-year note, which tracks Fed expectations most closely, dropped nearly 3 basis points to 4.137%. The 10-year held steadier at 4.479%, creating a subtle steepening that suggests markets are repricing the terminal rate lower. Global equities? The Dow hit new highs, the S&P 500 held firm, and even the Nasdaq—which had been bleeding on tech valuation fears—found support. This is the "Soft Landing Reflex" in action: bad news becomes good news when it means the Fed keeps its foot off the brake.
Bullish Scenario: The Goldilocks Gamble
If the labor market continues this gradual deceleration without collapsing, we get the dream scenario: the Fed holds rates steady through summer, inflation continues its slow grind toward 2%, and risk assets rally into year-end. Gold could push toward $4,400. Bitcoin might retest its March highs. The DXY could break below 100, giving emerging markets and risk-on trades room to run. This is the "immaculate disinflation" thesis that keeps equity bulls awake at night with hope.
Bearish Scenario: The Cracks Beneath
But here's what keeps me up at night: that participation rate collapse isn't just noise. It's a warning. If 832,000 people leaving the workforce becomes a trend—driven by aging demographics, immigration crackdowns, or discouraged workers—then the Fed faces an impossible choice. Cut rates to support growth and watch inflation reaccelerate, or hike into a shrinking labor pool and risk breaking something. The April/May revisions downward suggest the labor market was weaker than reported all along. If July and August data confirm this slowdown, we're not looking at a "pause"—we're looking at the early innings of a labor market recession. In that scenario, DXY could spike on safe-haven flows, gold gets volatile, and crypto faces a liquidity crunch as risk-off dominates.
Key Risks: The Known Unknowns
First, the revision risk: those April/May downward adjustments mean the BLS data has been overstating strength. If July gets revised lower later, the Fed's decision-making is based on faulty inputs. Second, wage stickiness: average hourly earnings are still running hot. If wages don't decelerate, the Fed can't pivot even if jobs do. Third, geopolitical shocks: any escalation in trade wars or supply chain disruptions could reignite inflation just as the Fed gets dovish. Fourth, the participation rate cliff: if that 61.5% level breaks lower, we're in uncharted territory for post-pandemic labor economics.
The Forward View: Reading the Tea Leaves
We're at an inflection point. The market has shifted from pricing "when will the Fed hike" to "will they hike at all." My read? The Fed holds in July, holds in September, and if the labor market keeps softening, they might not hike in 2026 at all. That creates a window for risk assets—especially gold and crypto—to outperform as the dollar yield advantage erodes. But this is a trader's market now, not a buy-and-hold playground. The dispersion between consensus and reality just widened, and those who can see through the headline numbers will find the edge.
The Question That Matters
Here's what I want to know from you: Do you think the Fed is trapped—unable to hike because of weak jobs, but unable to cut because of sticky inflation? Or is this the beginning of a genuine pivot that sends risk assets soaring into year-end? Drop your take below. 👇
repost-content-media
  • Reward
  • 19
  • Repost
  • Share
BeautifulDay:
To The Moon 🌕
View More
Hold GT and Earn Rewards, Win 2,500 GT and 350,000 USDT https://www.gate.com/campaigns/5122?ref=VLJNBLTXUG&ref_type=132
post-image
  • Reward
  • 21
  • Repost
  • Share
EagleEye:
2026 GOGOGO 👊
View More
#ShortSqueezeAlert 🔥📊.
Over $280 Million in Short Liquidations Shake the Crypto Market
The cryptocurrency market has witnessed a powerful short squeeze, with more than $280 million in short positions liquidated within the past 24 hours. Traders who expected prices to move lower were forced to close their positions as Bitcoin and several major altcoins continued their upward momentum.
Short liquidations often create a chain reaction. As bearish positions are closed automatically, additional buying pressure enters the market, pushing prices even higher. This is exactly what the market has
BTC0.46%
Ai_Power
#ShortSqueezeAlert 🔥📊.
Over $280 Million in Short Liquidations Shake the Crypto Market
The cryptocurrency market has witnessed a powerful short squeeze, with more than $280 million in short positions liquidated within the past 24 hours. Traders who expected prices to move lower were forced to close their positions as Bitcoin and several major altcoins continued their upward momentum.
Short liquidations often create a chain reaction. As bearish positions are closed automatically, additional buying pressure enters the market, pushing prices even higher. This is exactly what the market has experienced during the latest rally.
However, experienced traders know that a short squeeze alone does not guarantee a long-term bull market. Sustainable trends require strong trading volume, healthy market structure, and continued investor confidence.
What This Means for Traders
📈 Bears have suffered significant losses.
📊 Volatility has increased across the crypto market.
⚠️ Chasing green candles without confirmation can be risky.
✅ Wait for strong support and resistance confirmation before entering new positions.
Market Outlook
If buyers continue defending key support levels while volume remains strong, bullish momentum could extend further. On the other hand, if buying pressure weakens after the squeeze, the market may enter a period of consolidation before the next major move.
In fast-moving markets, discipline always outperforms emotion. Successful traders follow their strategy instead of reacting to fear or excitement.
repost-content-media
  • Reward
  • 17
  • Repost
  • Share
EagleEye:
LFG 🔥
View More
⚽ France pushes for advancement, Morocco leads in popularity.
France win rate 83%, can Paraguay cause an upset?
Morocco win rate 52%, Canada still has a chance to fight back.
The further into the knockout stage, the faster the price changes.
Watch the probability fluctuations, and you can also exit early to lock in opportunities.
👉 Participate now: https://www.gate.com/competition/road-to-champion
GateLaunch
⚽ France pushes for advancement, Morocco leads in popularity.
France win rate 83%, can Paraguay cause an upset?
Morocco win rate 52%, Canada still has a chance to fight back.
The further into the knockout stage, the faster the price changes.
Watch the probability fluctuations, and you can also exit early to lock in opportunities.
👉 Participate now: https://www.gate.com/competition/road-to-champion
repost-content-media
  • Reward
  • 12
  • Repost
  • Share
EagleEye:
Let's f***ing go 🔥
View More
⏰ Family, have you come to the Square to draw today? Up to $10,000 CFD vouchers are waiting for you!
100% winning! The brand-new prize pool is upgraded in a big way—get an abundance of multiple practical vouchers!
Start drawing directly 👉 https://www.gate.com/zh/activities/pointprize?now_period=20
CFD position experience vouchers, prediction market experience vouchers, fee cashback vouchers, financial management experience bonuses, VIP cards...
Help you trade popular stocks and prediction markets ahead of time!
10 times a day! No trading required—just interact by posting on the Square to easi
BTC0.43%
ETH0.35%
SPCX0.34%
GateSquare
⏰ Family, have you come to the Square to draw today? Up to $10,000 CFD vouchers are waiting for you!
100% winning! The brand-new prize pool is upgraded in a big way—get an abundance of multiple practical vouchers!
Start drawing directly 👉 https://www.gate.com/zh/activities/pointprize?now_period=20
CFD position experience vouchers, prediction market experience vouchers, fee cashback vouchers, financial management experience bonuses, VIP cards...
Help you trade popular stocks and prediction markets ahead of time!
10 times a day! No trading required—just interact by posting on the Square to easily draw!
Details: https://www.gate.com/announcements/article/100364
#BTC #ETH #SPCX
repost-content-media
  • Reward
  • 13
  • Repost
  • Share
EagleEye:
LFG 🔥
View More
$XAU
July 2–3 delivered one of gold's strongest weekly performances in over a month.
Spot gold surged 2.28% on July 2 to $4,123.80, then extended gains to $4,179.94 on July 3, up another 1.4% on the day. August gold futures climbed to $4,193.20, putting gold on track for its first weekly gain in five weeks (+2.3%).
The rally was driven primarily by a weaker-than-expected June U.S. Non-Farm Payrolls (NFP) report, which reshaped expectations for Federal Reserve policy.
Market Reaction
• Spot Gold (July 2): $4,123.80 (+2.28%)
• Spot Gold (July 3): $4,179.94 (+1.4%)
• August Gold Futures: $4,19
XAU0.08%
Falcon_Official
$XAU
July 2–3 delivered one of gold's strongest weekly performances in over a month.
Spot gold surged 2.28% on July 2 to $4,123.80, then extended gains to $4,179.94 on July 3, up another 1.4% on the day. August gold futures climbed to $4,193.20, putting gold on track for its first weekly gain in five weeks (+2.3%).
The rally was driven primarily by a weaker-than-expected June U.S. Non-Farm Payrolls (NFP) report, which reshaped expectations for Federal Reserve policy.
Market Reaction
• Spot Gold (July 2): $4,123.80 (+2.28%)
• Spot Gold (July 3): $4,179.94 (+1.4%)
• August Gold Futures: $4,193.20
• Weekly Gold Gain: +2.3%
• June NFP: 57,000 jobs added
• Unemployment Rate: 4.2% (vs. 4.3% previously)
• 10-Year Treasury Yield: 4.465%
• U.S. Dollar Index (DXY): 100.85 (-0.55%)
The weak payrolls report significantly reduced expectations for additional Fed rate hikes, supporting both gold prices and broader safe-haven demand.
Why Gold Moved Higher
1. Weak Labor Market Data
The U.S. economy added only 57,000 jobs in June, well below market expectations.
Although the unemployment rate declined to 4.2%, the improvement was largely attributed to lower labor-force participation rather than stronger hiring.
2. Fed Expectations Shifted
The weaker employment data led markets to reduce expectations for future Federal Reserve tightening.
Lower rate expectations reduced the opportunity cost of holding non-yielding assets like gold while simultaneously weakening the U.S. dollar.
OANDA Senior Market Analyst Kelvin Wong summarized the move:
«"What we're seeing is a reduction in the pricing of U.S. Federal Reserve rate hikes for the rest of this year, as well as Q1 next year, primarily driven by a rather lackluster U.S. labor market data."»
3. Technical Momentum Improved
Gold reclaimed the $4,100 level, strengthening bullish momentum and shifting attention toward higher resistance levels.
Key Technical Levels
Resistance
• $4,162.36–$4,214.34
• $4,382.62
• $4,411.94
Support
• $4,100
• $4,032
• $4,000
Holding above $4,100 keeps the current bullish structure intact, while a break below could trigger a retest of lower support.
Macro Outlook
Earlier in late June, Citi reduced its three-month gold target from $4,300 to $4,000, citing stronger real yields, a firmer U.S. dollar, moderating ETF demand, and easing geopolitical risks.
However, the latest NFP report has already challenged part of that outlook.
A weaker dollar, declining Treasury yields, and continued central bank gold purchases remain supportive for the precious metal, while geopolitical uncertainty—including the U.S.-Iran conflict—continues to reinforce safe-haven demand.
Trading Takeaway
The latest NFP report has shifted market sentiment from a more hawkish Fed outlook toward a less aggressive policy path.
For TradFi CFD traders, the current environment favors bullish momentum while the dollar remains under pressure and rate-hike expectations continue to ease.
What to Watch
• U.S. CPI inflation data
• Upcoming Fed communications
• Treasury yield direction
• DXY performance
• Gold support at $4,100 and $4,000
• Resistance at $4,162–$4,214
Positioning
• Monitor incoming macroeconomic data before increasing exposure.
• Respect the key technical support and resistance levels.
• Maintain disciplined risk management, as stronger inflation data could quickly revive hawkish Fed expectations.
#TradFiCFDGoldMasters
@Gate_Square
repost-content-media
  • Reward
  • 14
  • Repost
  • Share
EagleEye:
To The Moon 🌕
View More
#TLM
TLM is currently trading within a volatile range after experiencing a remarkable 205% gain over the past 7 days, with price fluctuating between 0.00159 and 0.00328 USDT in the last 24 hours. This represents a 48% volatility level, indicating extreme price swings that require careful position management.
Key Support Levels are identified at three critical zones. SL1 sits at 0.002450 representing a 5.3% downside buffer from current price, SL2 at 0.002280 marking an 11.9% decline threshold, and SL3 at 0.002100 which constitutes an 18.8% risk boundary. These levels align with recent consolid
TLM-13.14%
HighAmbition
#TLM
TLM is currently trading within a volatile range after experiencing a remarkable 205% gain over the past 7 days, with price fluctuating between 0.00159 and 0.00328 USDT in the last 24 hours. This represents a 48% volatility level, indicating extreme price swings that require careful position management.
Key Support Levels are identified at three critical zones. SL1 sits at 0.002450 representing a 5.3% downside buffer from current price, SL2 at 0.002280 marking an 11.9% decline threshold, and SL3 at 0.002100 which constitutes an 18.8% risk boundary. These levels align with recent consolidation zones and psychological round numbers that have historically attracted buying interest.
Key Resistance Levels present upside targets at three distinct tiers. TP1 is positioned at 0.002850 offering a 10.2% gain potential, TP2 at 0.003150 representing a 21.8% upside move, and TP3 at 0.003500 which would deliver a 35.3% return from current levels. The 0.00328 level recently tested serves as immediate overhead resistance.
Technical indicators reveal a mixed picture that traders should monitor closely. The RSI reading of 86.02 indicates severely overbought conditions across multiple timeframes including 15-minute, 4-hour, and daily charts. CCI readings of 146 on the 4-hour and 284 on daily confirm this overbought status. However, bullish moving average alignment persists with prices trading above key MAs. MACD shows bottom divergence on daily timeframe suggesting potential pullback risk. Bollinger Bands have expanded with price breaking above the upper band indicating strong momentum but also elevated reversal probability.
Risk management calculations show optimal position sizing should account for the 48% volatility. A conservative approach allocates 2-3% of portfolio per trade given the elevated risk profile. The risk-reward ratio at TP1 stands at 1.92, at TP2 improves to 1.83, and at TP3 reaches 1.88 when measured against SL1.
Volume analysis reveals a concerning pattern of price rising while volume declines below the 7-day average, suggesting weakening conviction in the rally. This divergence often precedes sharp corrections in small-cap tokens.
Trading Strategy Recommendation involves entering partial positions at current levels with staggered exits. Take 33% profits at TP1, another 33% at TP2, and trail remaining position to TP3 with stop raised to breakeven after TP2 hits. If price rejects at 0.00328 resistance, consider reducing exposure by 50% immediately. Monitor RSI for any drop below 70 as early warning signal. The 7-day moving average at approximately 0.002350 serves as dynamic support for trend continuation assessment.@Gate_Square
repost-content-media
  • Reward
  • 15
  • 1
  • Share
bandanlage:
Bull Run 🐂Ape In 🚀HODL Tight 💪1000x Vibes 🤑DYOR 🤓
View More
#StakeUSD1Earn8.26%APR
campaign reflects this growing trend by offering eligible participants the opportunity to stake USD1 and earn rewards of up to 8.26% APR. In an environment where market volatility can quickly impact portfolio values, products that focus on stable assets while generating passive income are becoming an increasingly important part of long-term investment strategies.
What Is USD1?
USD1 is a stable-value digital asset designed to maintain a value close to one U.S. dollar. Unlike highly volatile cryptocurrencies, stable assets are primarily used for preserving capital value,
USD1-0.02%
post-image
  • Reward
  • 16
  • 2
  • Share
EagleEye:
2026 GOGOGO 👊
View More
  • Pinned