








Share your thoughts
placeholder
Article
Going to zero is the main theme of Robinhood memes
Liquidity is currently sufficient, but it will only flow toward the top projects; going forward, assets under 1m will face greater risks
post-image
MEME-0.47%
Layout for Bitcoin, Ethereum, and Dogecoin
live-cover
LIVE3,125
  • 1
$AKE A 25x long position anchored at 0.01303: go long with the trend above the 4H EMA20, set a hard stop-loss below 0.01245, and reduce the position once profit exceeds 2%.
The signal comes from the early-September derivatives short-liquidation impulse and the lingering AI narrative, but the TOP100 holder concentration is extremely high at 98.8%, indicating a speculative-capital pump rather than fundamentals.
The current price of 0.01456 is close to the 0.01464 resistance. Without a high-volume breakout, it may pull back to 0.01303; a 25x position would be close to liquidation on any wick. Ris
AKE-13.76%
BTC+0.13%
The OTHERS/BTC chart is starting to look interesting.🔥
We’ve seen similar structures before the 2018 and 2021 altseasons.
Current structure is compressing inside a long-term falling wedge.
If history rhymes again, the next altseason could get very interesting.
Are we getting close? 👀
$BTC
post-image
BTC+0.11%
  • 1
This was purely the market being in a good mood and casually tossing out some gold coins—one just happened to land on my head. 🪙

When I was checking the chart after lunch, $DASH was in a pullback phase, but every step lower was met with buying, and the center of gravity on the lower-timeframe candlesticks was clearly moving upward. This kind of move is the most agonizing and the most likely to turn into a one-way run. My judgment at the time was straightforward: if the pullback held, that was the opportunity.

Later, the price climbed from 39.86 all the way to 73.07, with unrealized gains
post-image
DASH+4.61%
SOL+2.76%
ETH+1.60%
Nvidia’s AI Computing Demand Creates Fresh Momentum Across Semiconductor Stocks
live-cover
LIVE1,168
Everyone’s staring at the altcoin revival, but ADA/USDT just painted a 4h tombstone that nobody’s tweeting about yet.

ADA/USDT - SHORT

Trade Plan:
Entry: 0.2181 – 0.2193
SL: 0.2242
TP1: 0.2145
TP2: 0.2118
TP3: 0.2076

Why this setup?
- 1D trend is a *range*, not a breakout — the “safe” narrative is dead.
- 4h momentum is SHORT with 55.4 confidence, and the 15m RSI is already bleeding at 40.33 — weakness is cascading.
- Entry is armed at 0.2187 (zone: 0.2181–0.2193). If we lose 0.2125, the range floor gets tested fast.
- TP1 sits 1.9% below entry, but TP3 at 0.2076 is the real magnet
ADA+2.58%
IOST surged 25% in 25 minutes on $22 million in trading volume, with a massive bullish candle directly breaking through the previous high. But remember, retail traders chasing this kind of move are just carrying the market maker’s sedan; my system only trades pullback confirmations.
The core battle points in the current market: 0.0008 is today’s bull-bear dividing line, 0.0007 below is the dense support zone, and 0.00085 above is the area where trapped holders may be released. A 30% 24h range indicates extremely high market-maker control. With this kind of coin, either stay out, or participate
IOST+24.94%
By the end of $PONS , the 5U expectation remains unchanged; next year, if the Federal Reserve cuts interest rates, at least 15U.
post-image
PONS+20.19%
Everyone’s staring at the 4H, but the 15-minute RSI just screamed at 32.5—$LAB /USDT is leaking before your eyes.

$LAB /USDT - SHORT

Trade Plan:
Entry: 0.07312 – 0.07356
SL: 0.07549
TP1: 0.07173
TP2: 0.07066
TP3: 0.06905

Why this setup?
- 95% confidence SHORT isn’t a guess; it’s a statistical mugging.
- Price pinned at 0.07334, but the real story is the 1D bearish trend—gravity is already on.
- TP1 (0.07173) is a 2.2% drop; TP2 (0.07066) is the meat. The ATR (0.000894) says volatility is your friend, not your enemy.
- Why now? The 1H reference is the same as entry—no fake pump, jus
LAB-3.77%
#GateEventContractTradeSharingChallenge — A Community Opportunity to Connect, Learn, and Grow
The digital community is constantly evolving, and every new event, challenge, or campaign can create an opportunity for people to learn something valuable, share ideas, and build meaningful connections. The Gate Event Contract Trade Sharing Challenge is an interesting concept for participants who want to explore event-based trading discussions, improve their understanding of market activity, and engage with a wider community.
At its core, a trading challenge is not simply about making a quick decision
post-image
#RedBullTradingTourSeason6
Season 6 of the Red Bull Trading Tour is bringing fresh energy to the trading community, combining competition, learning, and the excitement of the financial markets. It is a great reminder that trading is not only about numbers on a screen, but also about discipline, preparation, strategy, and staying focused when conditions change.
The tour creates an engaging space for traders to follow market ideas, discover different approaches, and connect with a wider community. Every market move can offer a new lesson, whether the market is moving quickly or taking a quieter
This profit has me feeling both thrilled and terrified, worried the market will come to its senses tomorrow and blacklist me. When the price plunged intraday, $PONS pulled back to 0.4156. Seeing the strength of the bids below actually put me at ease—the pullback held, the key level wasn’t broken, and this kind of spot is exactly an open door for those looking to get on board.

I said to go long right then—what is there to hesitate about with this structure? Have a strategy before the market opens, discipline during the session, and reflection afterward. Now 0.8868 has delivered +2236.89%. Th
post-image
PONS+19.37%
DOGE+6.23%
SOL+2.76%
It's more than okay to start like this
post-image
$400K to $145M on $STONK
#USELESSSurgesAnother67%
USELESS is once again catching attention after a sharp 67% surge, putting the token firmly on the radar of traders and crypto watchers. Moves like this can quickly change market sentiment and bring fresh interest to a project that may have been overlooked before.
The latest jump shows how quickly momentum can build in the digital asset market. When price activity accelerates, traders often start watching volume, liquidity, community interest, and overall market direction more closely.
What makes the move interesting is not only the size of the increase, but also the at
USELESS+2.34%
Everyone’s staring at SOL’s range—but the 4H just whispered a secret that 95% missed.

$SOL /USDT - SHORT

Trade Plan:
Entry: 104.96 – 105.42
SL: 107.35
TP1: 103.57
TP2: 102.49
TP3: 100.86

Why this setup?
- Price sits at 105.19, hugging the mid-band while RSI (15m) at 48.58 shows zero momentum—this is a lull before a snap.
- ATR (1h) at 0.90 is tight, but that’s the trap: low volatility precedes the 4H expansion.
- With trend1d “range,” the real play is fading the edges—SHORT from 105.19 targets 103.57, then 102.49.
- Why now? The “Armed” status means the algo is loaded; the longer w
SOL+2.76%
No operations, no analysis, just sheer luck—this performance is embarrassing even to talk about. 🙈

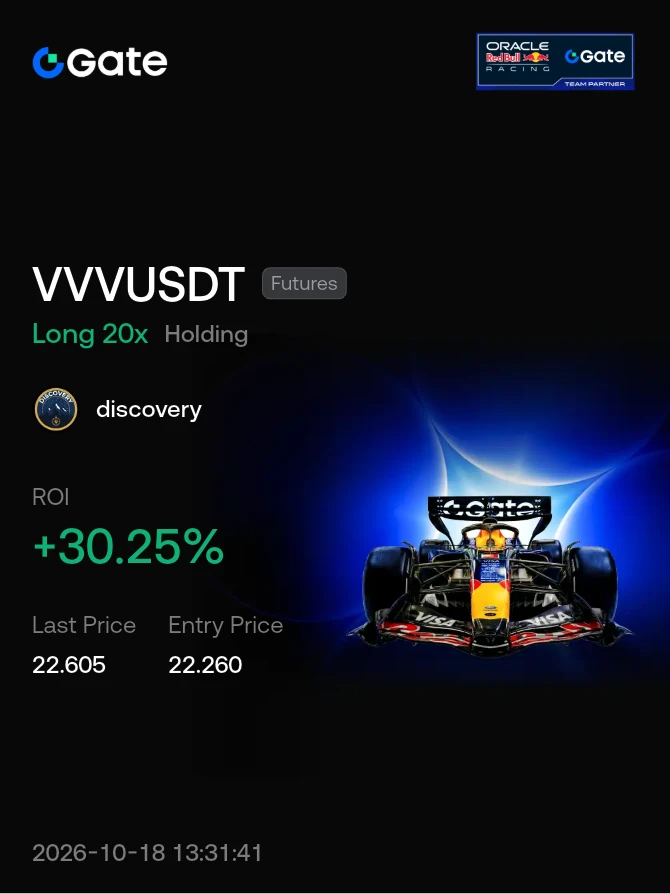
It’s not that I didn’t look at the chart at all. It’s just that while everyone else was still waiting and watching, I stared at the sell orders for $VVV for a while—the sell orders were being eaten away layer by layer, leaving only buy orders pushing upward. This kind of capital movement is the most direct evidence: buying pressure is strengthening, and the trend could start at any moment. I didn’t hesitate, opened a long position directly, set my protection, and went off to do other things.
post-image
VVV-3.47%
BNB+2.40%
BTC+0.13%
#USELESSSurgesAnother67%
USELESS is currently trading near 0.25 after another sharp upward move that registered approximately 67 percent gains in a recent 24-hour window.
The token, a Solana-based meme coin, has shown repeated strength over the past week. Market data places the current price in the 0.248 to 0.252 range, with a market capitalization around 249 to 252 million dollars. Twenty-four-hour trading volume has remained elevated, frequently exceeding 140 to 150 million dollars on spot markets and significantly higher when futures volume is included. This level of activity indicates gen
post-image
Falcon_Official
#USELESSSurgesAnother67%
$USELESS
MOMENTUM IS STILL RUNNING
USELESS has once again become one of the most aggressive momentum stories in the market. After its explosive multi-day rally, the token is now trading around $0.22, following a powerful move that previously pushed price toward the $0.25–$0.28 region. The latest market data shows just how extreme the move has become: USELESS has gained roughly 250%+ over seven days, while 24-hour trading volume has expanded above $200M.
THE BIGGER PICTURE
What makes this setup interesting is that USELESS is not simply experiencing a one-candle pump. The rally has developed across several sessions, with price moving from roughly $0.06–$0.07 at the beginning of the recent acceleration toward the $0.20+ area. Recent daily data shows gains of approximately 31.8% on Aug. 31, 24.8% on Sept. 1, 9.7% on Sept. 2, and 68.1% on Sept. 3, followed by another strong session on Sept. 4.
$0.22 IS THE NEW BATTLEFIELD
At the current $0.22 area, the chart is entering a completely different phase. Buyers have already demonstrated extraordinary strength, but the question now is whether they can maintain that momentum after such a rapid expansion.
The first level I would watch is $0.25. This remains the major psychological barrier because it represents a clean round number and sits close to the recent high zone. A strong daily close above $0.25, supported by sustained volume, would strengthen the continuation setup.
UPSIDE LEVELS
If USELESS successfully reclaims and holds $0.25, the next area to watch would be approximately $0.258–$0.26. A clean break there could put $0.30 back into focus.
Above $0.30, the $0.31–$0.312 region becomes an important technical target. From $0.22, a move to $0.25 would represent roughly 13.6%, while $0.30 would require about 36.4% upside. Reaching $0.312 would mean approximately 41.8% from the current level.
BUT THE CHART IS EXTREMELY HOT
This is where traders need to separate trend strength from risk. USELESS has already moved several hundred percent in a very short period, and current market activity confirms that speculation is intense.
The latest 24-hour range has been extremely wide, with market data showing price moving between roughly $0.18 and $0.28. That means double-digit percentage swings can happen quickly, even without a major fundamental change.
After such a vertical rally, chasing every green candle becomes increasingly dangerous. A strong asset can continue higher, but the probability of sharp profit-taking also increases as early buyers lock in gains.
THE SUPPORT MAP HAS CHANGED
For me, the most important question is whether previous breakout areas can become support.
The first zone is $0.21–$0.20. Holding this region after the recent acceleration would be constructive because it would show that buyers are defending the new higher price structure.
Below that, I would watch $0.18–$0.176. This area becomes much more important if the current momentum starts cooling. A controlled retracement into this region would not automatically destroy the larger rally.
The next deeper zone is around $0.15. Losing that level with heavy volume would suggest that the market is moving from healthy consolidation into a much deeper correction.
VOLUME TELLS THE STORY
The volume expansion is one of the strongest parts of the current setup. Current market data places USELESS around $220M+ in 24-hour trading volume, showing that this rally is happening alongside substantial market participation rather than disappearing liquidity.
But volume needs to be interpreted together with price. If buyers continue producing higher highs while volume remains elevated, momentum can continue. If price repeatedly fails near $0.25–$0.26 while selling volume increases, that would be a very different signal.
THE OVERBOUGHT PROBLEM
Momentum indicators are another reason I would avoid blindly chasing the current move. Previous technical readings already showed RSI entering an extremely overbought area, while MACD and moving averages remained strongly bullish.
That combination tells an important story: the trend is strong, but the entry risk is also rising.
An overbought RSI does not automatically mean price must crash. In powerful momentum markets, RSI can remain elevated for longer than expected. The better signal is whether price starts losing support while momentum indicators roll over.
BULLISH SCENARIO
My bullish scenario is simple: USELESS holds $0.20–$0.21, buyers return with strong volume, and price reclaims $0.25 decisively.
If that happens, $0.26 becomes the first confirmation zone, followed by $0.30 and potentially $0.31–$0.312.
The key is not simply touching $0.25. I want to see acceptance above it rather than another temporary wick followed by immediate rejection.
BEARISH SCENARIO
The risk scenario starts if USELESS repeatedly fails around $0.25 and then loses $0.20 with strong selling pressure.
That could trigger a cooling phase toward $0.18, followed by the $0.15 area if sellers remain aggressive. Such a pullback would not necessarily erase the entire multi-week rally, but it would indicate that the parabolic phase is losing momentum.
MY CURRENT VIEW
At approximately $0.22, USELESS remains one of the strongest momentum charts to watch, but the setup has changed significantly from the beginning of the rally.
The data shows extraordinary seven-day performance, huge trading activity and a market that has already demonstrated its ability to move tens of percent in a single session.
For me, the three levels are clear:
$0.25 — breakout confirmation
$0.20–$0.21 — immediate support
$0.176–$0.18 — deeper trend support
Above $0.25 with strong volume, $0.26 → $0.30 → $0.31+ becomes the upside roadmap.
Below $0.20, I would become much more cautious and wait for the market to establish a new base.
USELESS is still bullish from a momentum perspective, but after a 250%+ seven-day rally, the biggest opportunity may no longer be predicting whether the next candle is green. The real test is whether buyers can convert the explosive move into a sustainable higher-price structure.
If $0.25 breaks and holds, $0.30 comes back into play. If $0.20 breaks, the market may need a serious cooldown first.
@Gate_Square
repost-content-media
USELESS+2.34%
  • 1
MARKET ALERT - DOT (POLKADOT)
DOTUSDT is showing a very strong bullish trend on both the 1-hour and 5-minute timeframes. The current price is around 0.941, with the Exponential Moving Averages (EMA 20, 50, and 200) neatly aligned upward, indicating that buying momentum remains dominant.
​1-Hour Timeframe Analysis
The medium-term trend structure is very positive, with the price positioned above EMA 20 (0.920). The nearest resistance level is at 0.942. If this level is successfully broken with high volume, the price could continue rising further.
​5-Minute Timeframe Analysis
The short-term move
DOT+3.98%
THETA+1.52%
SENT+0.45%
  • 5
Load More

Join 40 M users in our growing community

⚡️ Join 40 M users in the crypto craze discussion

💬 Engage with your favorite top creators

👍 See what interests you

View More