Square
Following
Hot
News
Profile

CcChenYifan

vip
Diamond Hands
Market Analyst
Futures Trading Strategist
Official partner analyst, long-term returns, just passing by, feel free to follow. Focused for 11 years, mainstream coin precise strategies updated daily in real-time.
0
Following
82
Followers
1.7k
Liked
Pin
#晒出我的合约收益#Go all-in directly, take profits and secure your gains, remind everyone every day that a rebound is just a fake, is it really a fake #BTC #ETH
BTC+1.20%
ETH+0.91%
  • 2
9.27 BTC analysis$BTC
Happy holidays, everyone
Currently at the BTC monthly level, BTC's monthly RSI has risen from its yearly low to approximately 54, moving back above the key 50 threshold. The Supertrend indicator has turned green again near $84,000, signaling a recovery in the medium- to long-term trend. The price has moved back above the 365-day moving average (approximately $83,000) and broken above the 50-week moving average. The next key technical resistance is near the 2-year moving average, at approximately $88,761.
Short-term resistance and support: The key short-term resistance zo
post-image
BTC+1.19%
September 27 $BTC early morning analysis
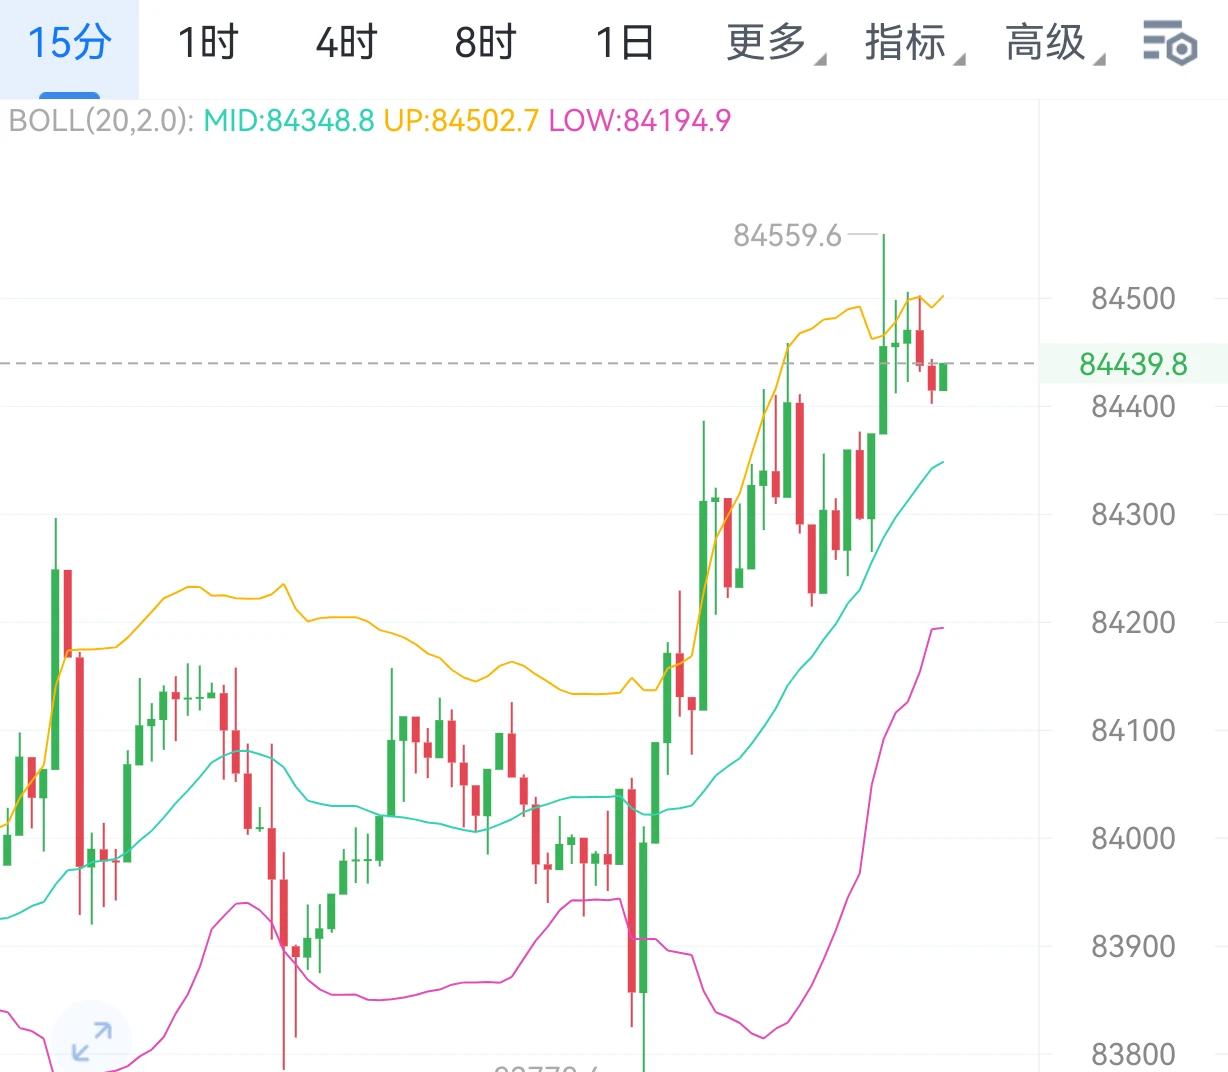
Weekend volatility was very low. Trading the small fluctuations to make some extra living expenses is still quite simple. The Bollinger middle band is around 84125, while the current price of 84029 is right near the middle band; the upper band is 84655, and the lower band is 83596.
The Bollinger Bands are narrowing, indicating that the short-term market has entered a low-volume consolidation phase. Bulls and bears are temporarily deadlocked, volatility will contract, and the market is waiting to choose a direction.
- Short-term resistance above: 84655
BTC+1.19%
ETH+0.91%
September 26 $BTC Analysis
U.S. Treasury yields surge: The 10-year U.S. Treasury yield touched 5.18% intraday, hitting a new high since 2007. The opportunity cost of holding the non-yielding asset BTC has increased significantly, and funds may flow back into the bond market. Price and Bollinger Bands: The current price is 83,969.6, having fallen below the Bollinger middle band (84,537.4) and trading between the middle and lower bands. The upper and lower bands (86,251.8 / 82,823.0) are narrowing, indicating declining short-term volatility and an imminent directional choice.
· MACD indicator:
post-image
BTC+1.19%
Nothing needs to be said—just look at the result. Kong, Kong, Kong. As everyone says, this is what living in the imperial palace means: remind them several times a day, and as long as it dares to rebound, Kong it. Isn’t this a waterfall? #BTC短线回调
post-image
BTC+1.19%
Mid-Autumn Festival benefits are here: short every rebound, with precise levels; everything has been clearly arranged for everyone in advance. Does anyone see any issues with checking in every day and following along?#BTC #ETH #BTC走势分析
BTC+1.19%
ETH+0.91%
$ZEC Has everyone positioned yet? I did give everyone the entry-point range. Although I don’t trade this much, every token Yifan recommends, whether it’s $SNDKB or something else, has more than 100 points of room. You can take a good look at the strategies I shared previously #比特币本周回落至约84600美元 .
ZEC+7.14%
BTC+1.19%
Analysis early morning on September 25 $BTC
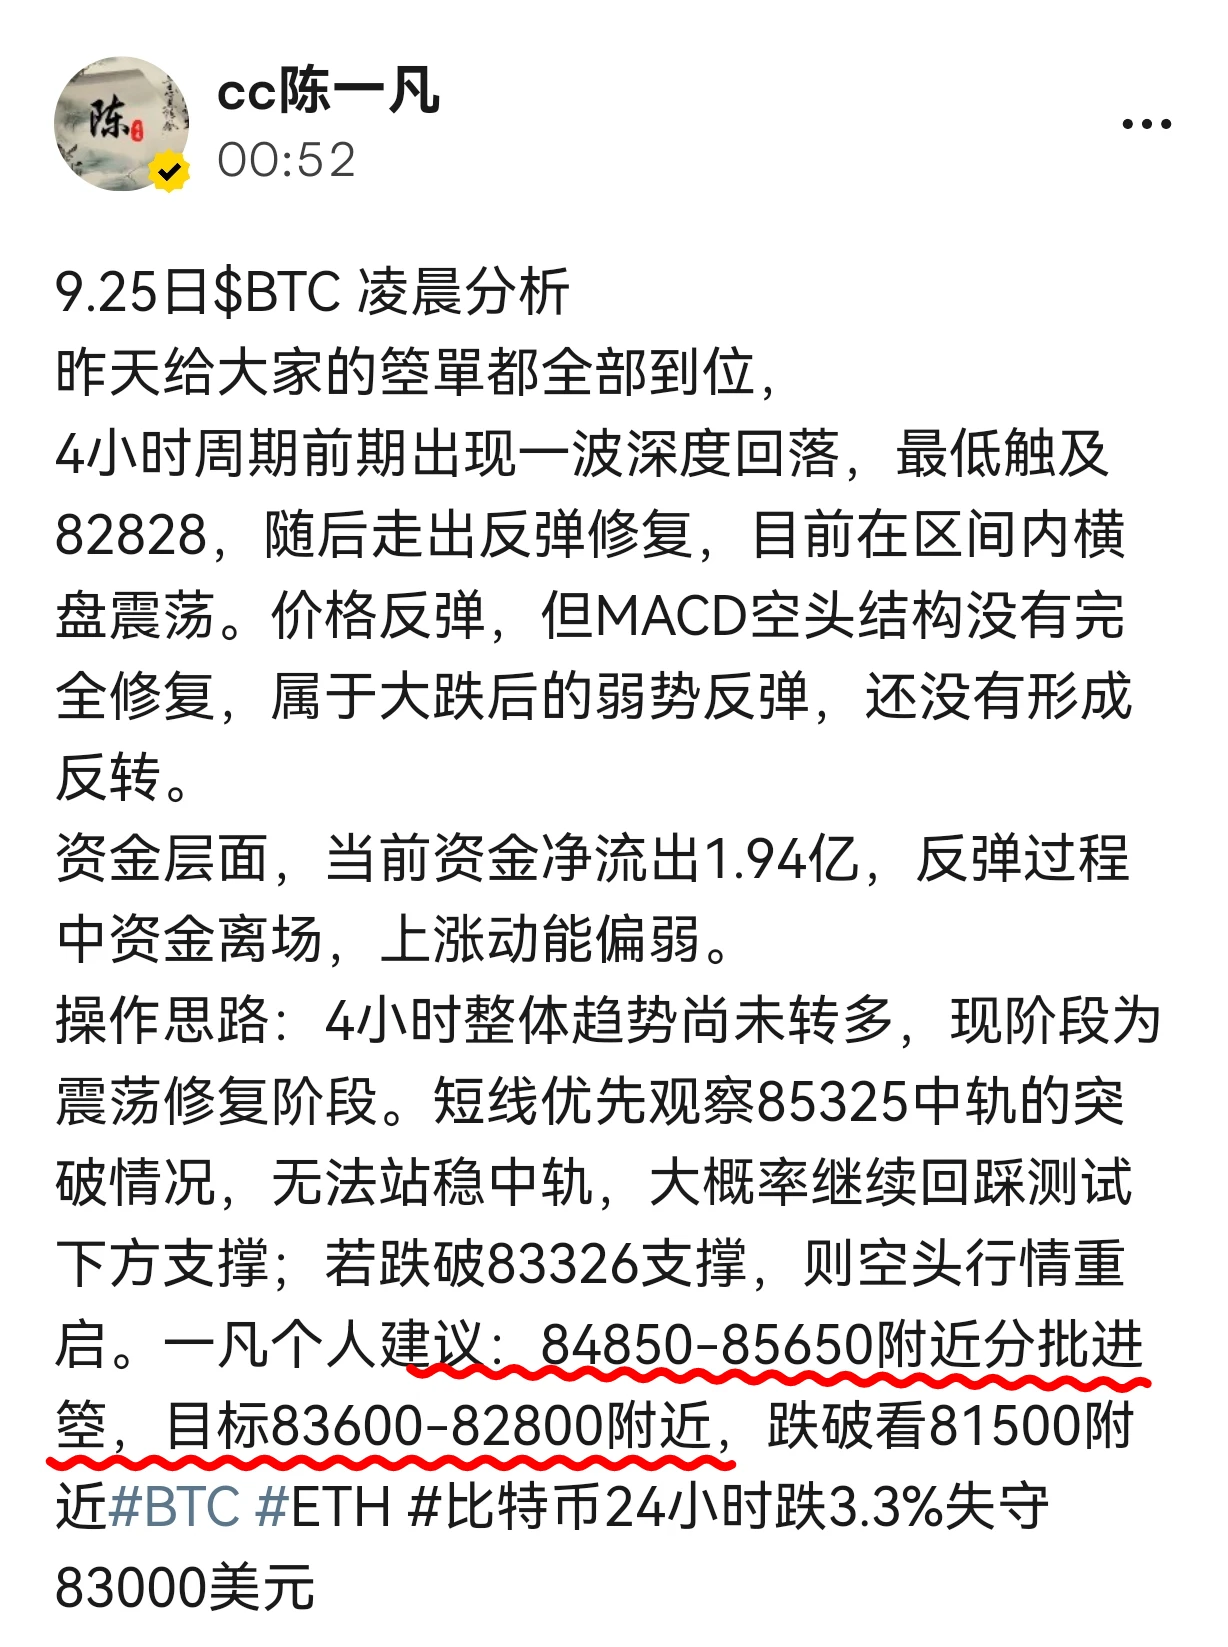
All the short orders I gave everyone yesterday have been fully filled,
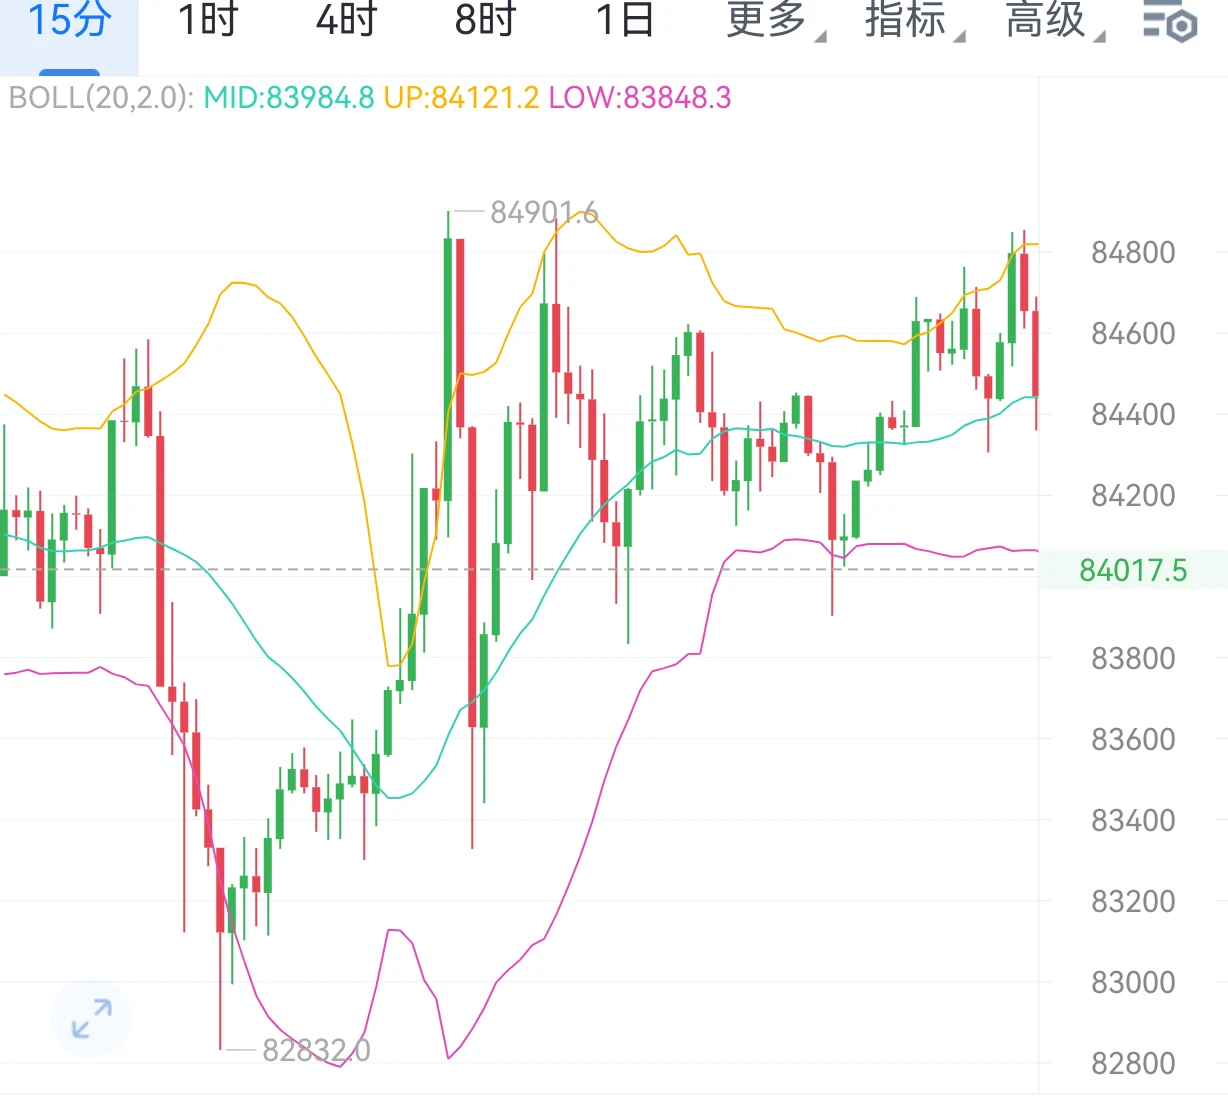
On the 4-hour timeframe, a deep pullback occurred earlier, with the low reaching 82828, followed by a rebound and recovery. It is currently moving sideways within the range. Although the price has rebounded, the bearish MACD structure has not fully recovered. This is a weak rebound after a major drop and has not yet formed a reversal.
In terms of capital flows, the current net outflow is $194 million. Funds are exiting during the rebound, and upward momentum is weak.
Trading stra
BTC+1.19%
  • 2
What does “precise to an absurd degree” mean? It means when I say 82,800, it really reaches 82,800! It’s not about talking—it’s about putting in the work; it’s not about luck. Remember: starlight never asks who is traveling hard, and time never lets down those with determination. Just focus on working hard—the results will speak for you; just keep going—time will give you the answer. 82,800 isn’t the finish line, but proof that we do what we say. At the next stop, keep charging forward, keep winning, and turn each goal we set into reality!#BTC #ETH #BTC走势分析
BTC+1.19%
ETH+0.91%
Just asking whether you're enjoying this. 1000 Duodian Spaces, delivered straight away—execution says it all. If you can't keep up, just watch others eat the meat.#BTC #ETH #BTC走势分析
post-image
BTC+1.19%
ETH+0.91%
Guys, I’ve given you the entry levels; whether you can seize them is up to you. The rebound is giving you a chance to short.#BTC #ETH #BTC走势分析
post-image
BTC+1.20%
ETH+0.91%
September 24 $ETH Analysis
This Friday (September 26) will see quarterly options expiry. Sentiment in the Ethereum options market has clearly turned bearish—the put-call ratio has risen to 0.85, and traders’ positioning is gradually shifting toward puts.
The liquidation heatmap shows a dangerous “liquidation magnet zone” below the current price: if ETH falls below $2,536, the cumulative long liquidation intensity on major CEXs will reach $469 million; if it falls further below $2,633, liquidation intensity will surge to $1.197 billion. With options expiry approaching and market liquidity thinn
ETH+0.91%
BTC-0.40%
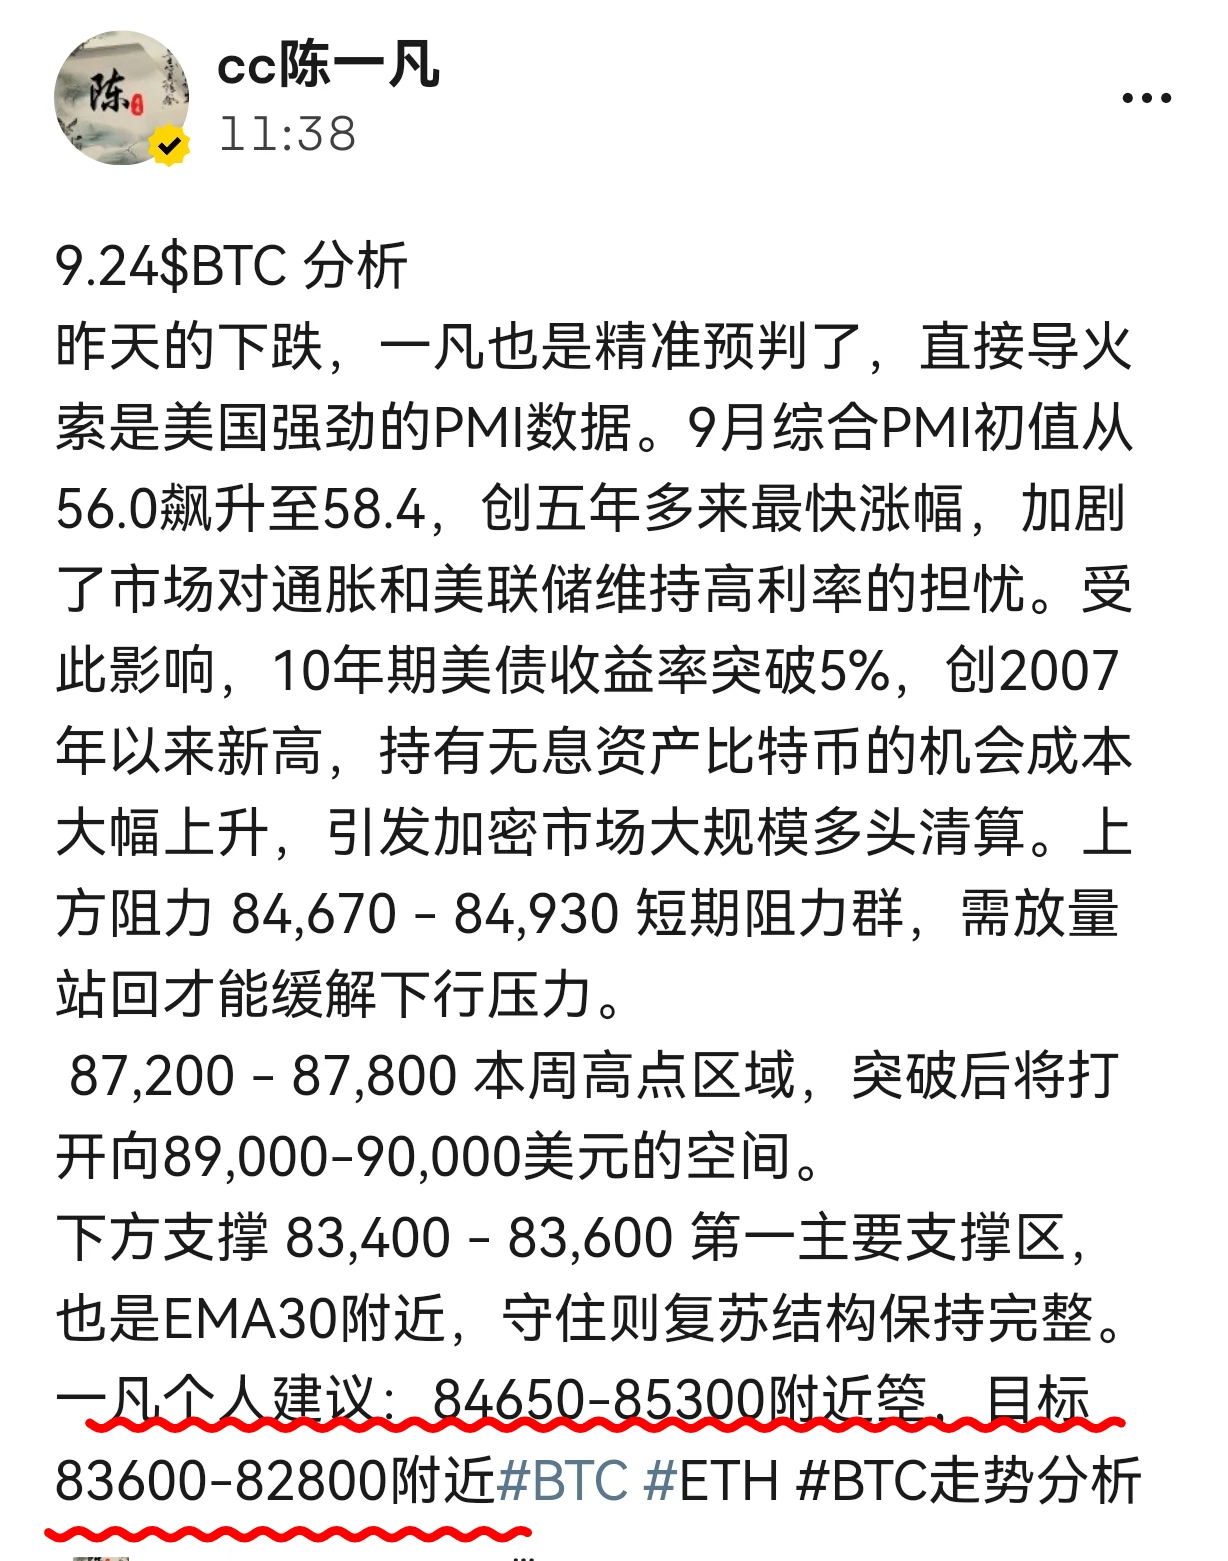
9.24$BTC Analysis
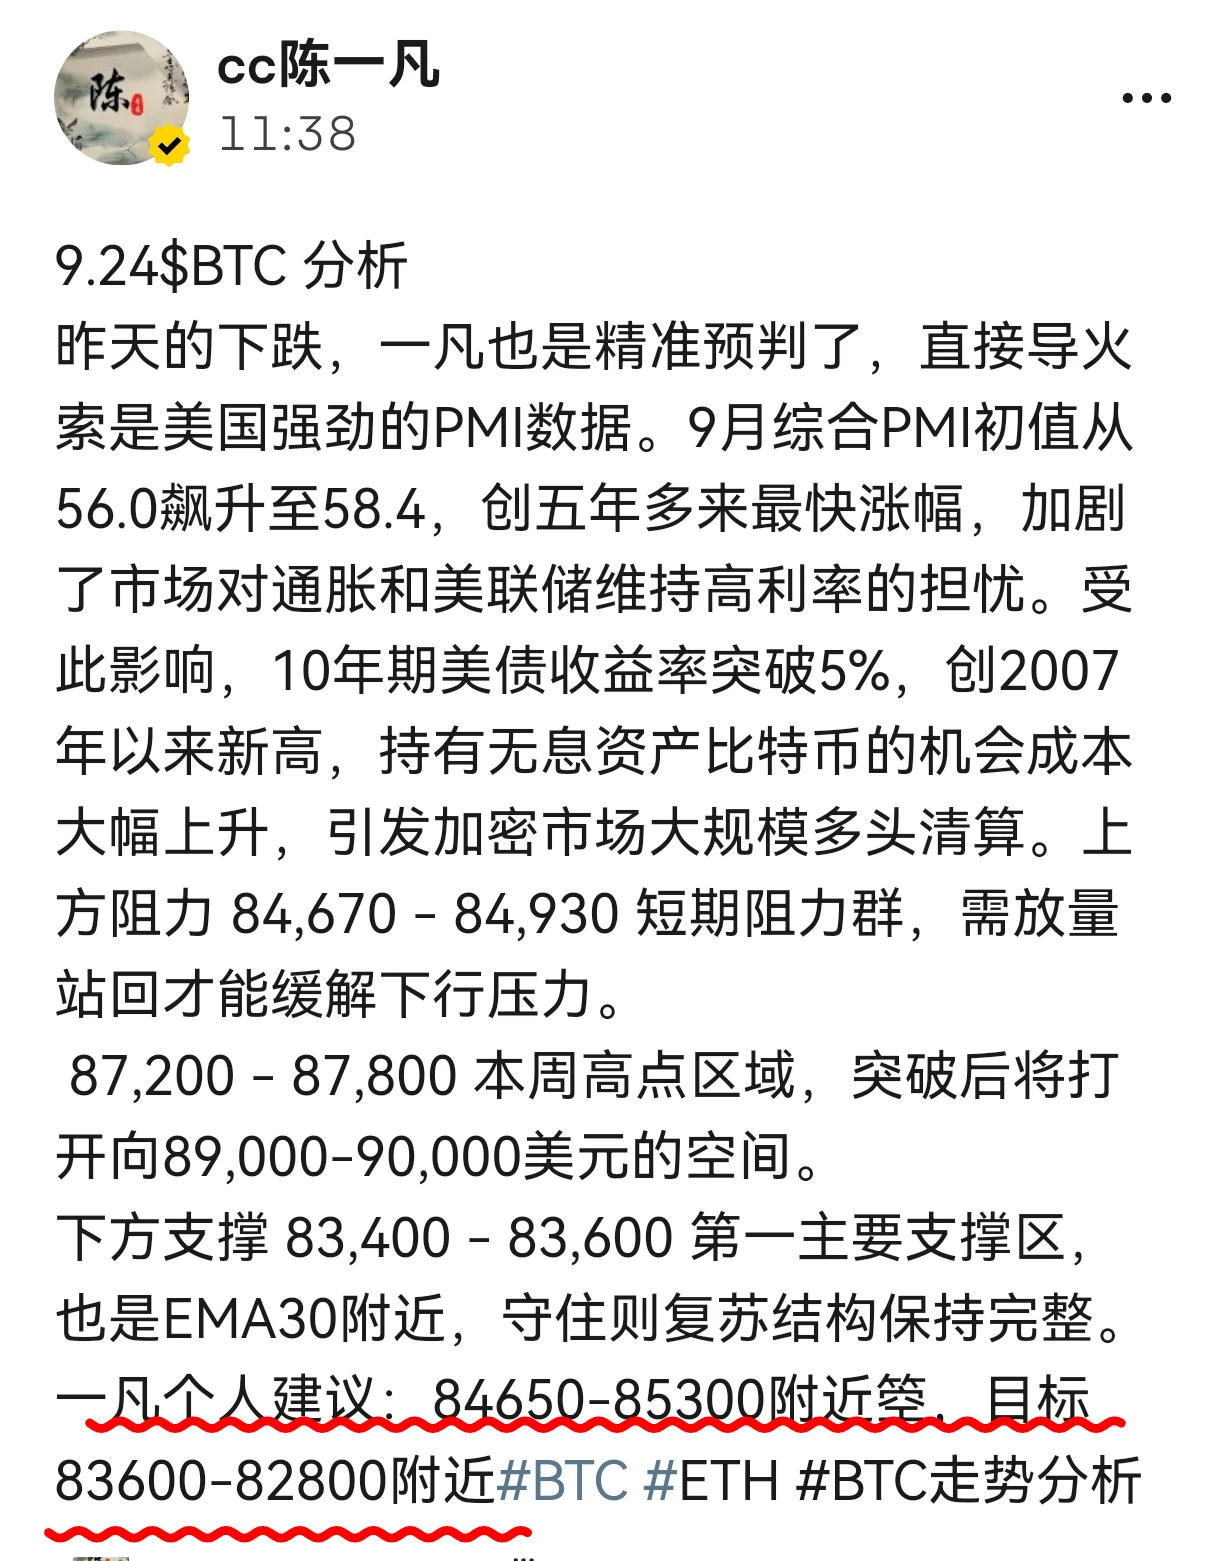
Yesterday's decline was directly triggered by strong U.S. PMI data. The preliminary September composite PMI surged from 56.0 to 58.4, marking its fastest increase in more than five years and intensifying market concerns about inflation and the Federal Reserve maintaining high interest rates. As a result, the 10-year U.S. Treasury yield broke above 5%, reaching its highest level since 2007. The opportunity cost of holding the non-yielding asset Bitcoin rose sharply, triggering large-scale long liquidations in the crypto market. Resistance above: 84,670 - 84,930, a short-term r
post-image
BTC+1.19%
ETH+0.91%
September 24 $ETH early-morning analysis
The current ETH price is 2637.56, down 3.90% intraday, with a rapid sell-off in the short term. On the 15-minute Bollinger Bands, the price has fallen below or near the lower band, while the Bollinger channel is opening downward, indicating concentrated short-term bearish pressure.
Bollinger lower band LB: 2635.13; intraday low: 2636.30. The current price is closely hugging the lower band, indicating a short-term oversold state and the possibility of a slight technical rebound, but the broader short-term trend remains bearish. Overall, ETH is currently
ETH+0.91%
BTC+1.19%
September 23 $ZEC Evening Analysis
On the 4-hour chart, after ZEC touched $1,679.98, it formed consecutive solid bearish candles. The latest candlestick plunged rapidly from around $1,640, with an extremely long upper wick, indicating heavy selling pressure in the $1,650–$1,680 area. The price has fallen below the upper Bollinger Band ($1,644.08). After the Bollinger Bands widened dramatically, this is the first pullback, a typical signal of a short-term overbought correction. Regarding MACD, DIF (45.14) remains above DEA (40.38), but the histogram has narrowed significantly from its previous
ZEC+7.14%
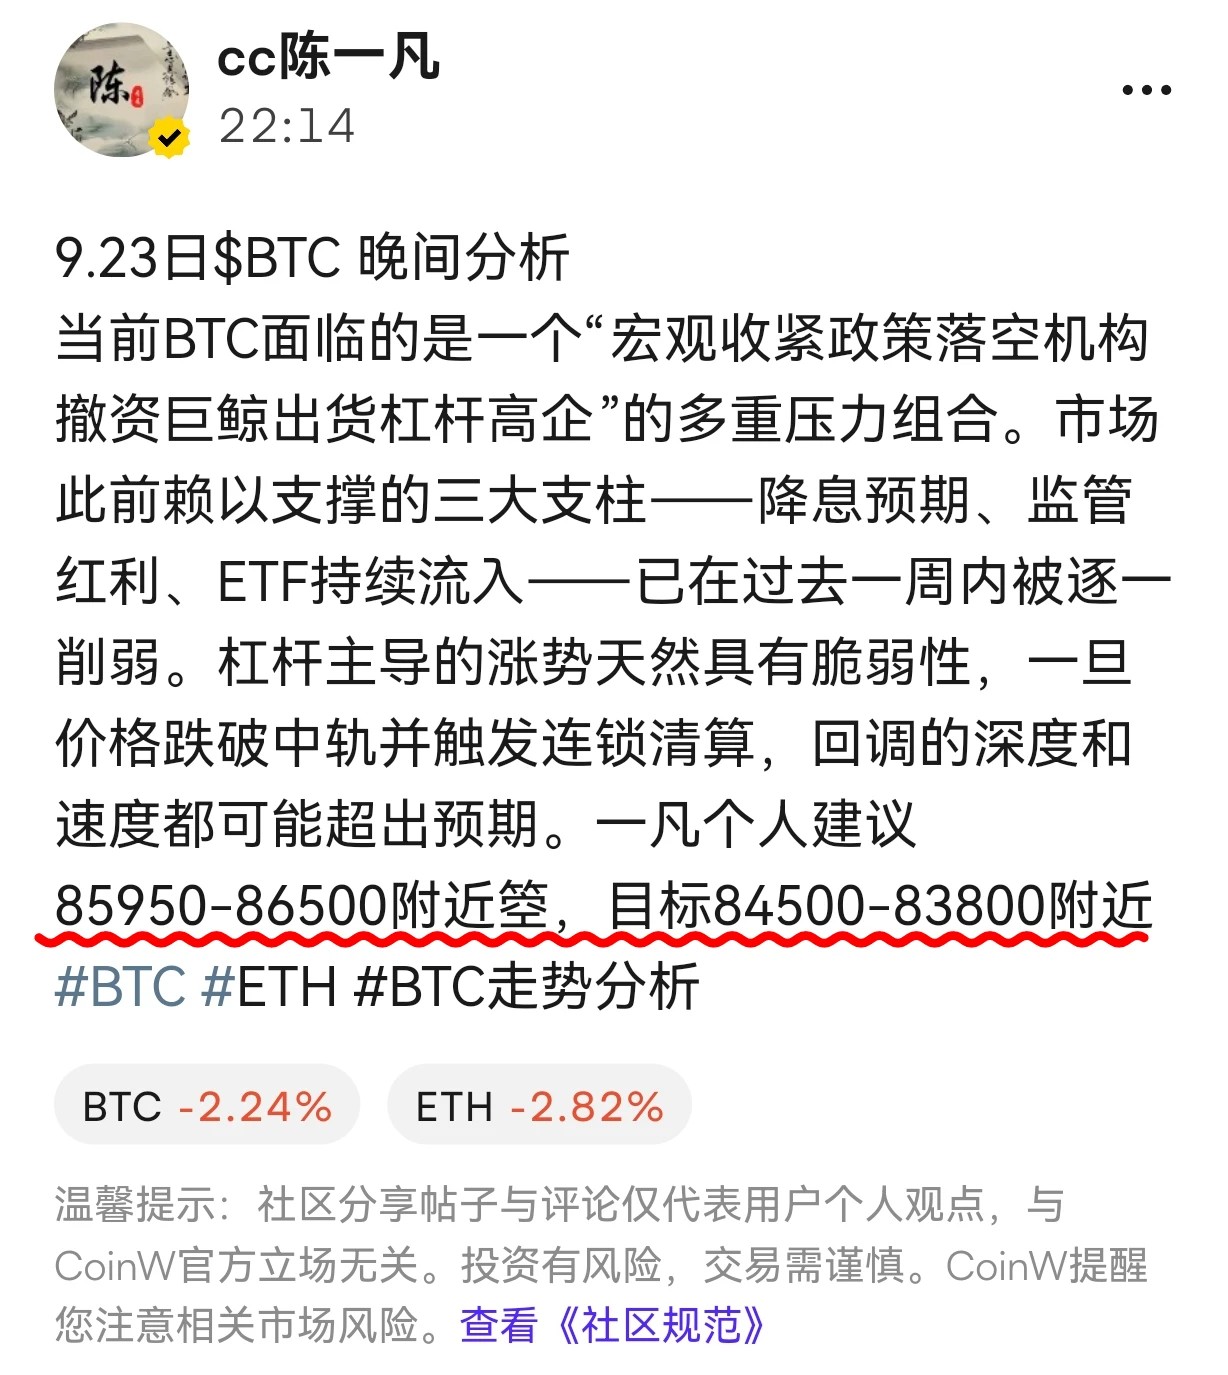
9.23 $BTC Midday Analysis
Macro: The market has quickly priced in the Fed's 25-basis-point rate hike (to 3.75%-4.00%) and the negative impact of the Clarity Act hitting obstacles in the Senate, while ETF funds rapidly flowed back in after a brief outflow. International oil prices retreated, U.S. stocks strengthened, and overall risk appetite recovered.
Long-term technical signals: Bitcoin has regained the 365-day moving average (around $83,000) and broken above the 200-day moving average (in the $80,000-$81,000 range), which CryptoQuant has characterized as a key confirmation signal for a bul
BTC+1.19%
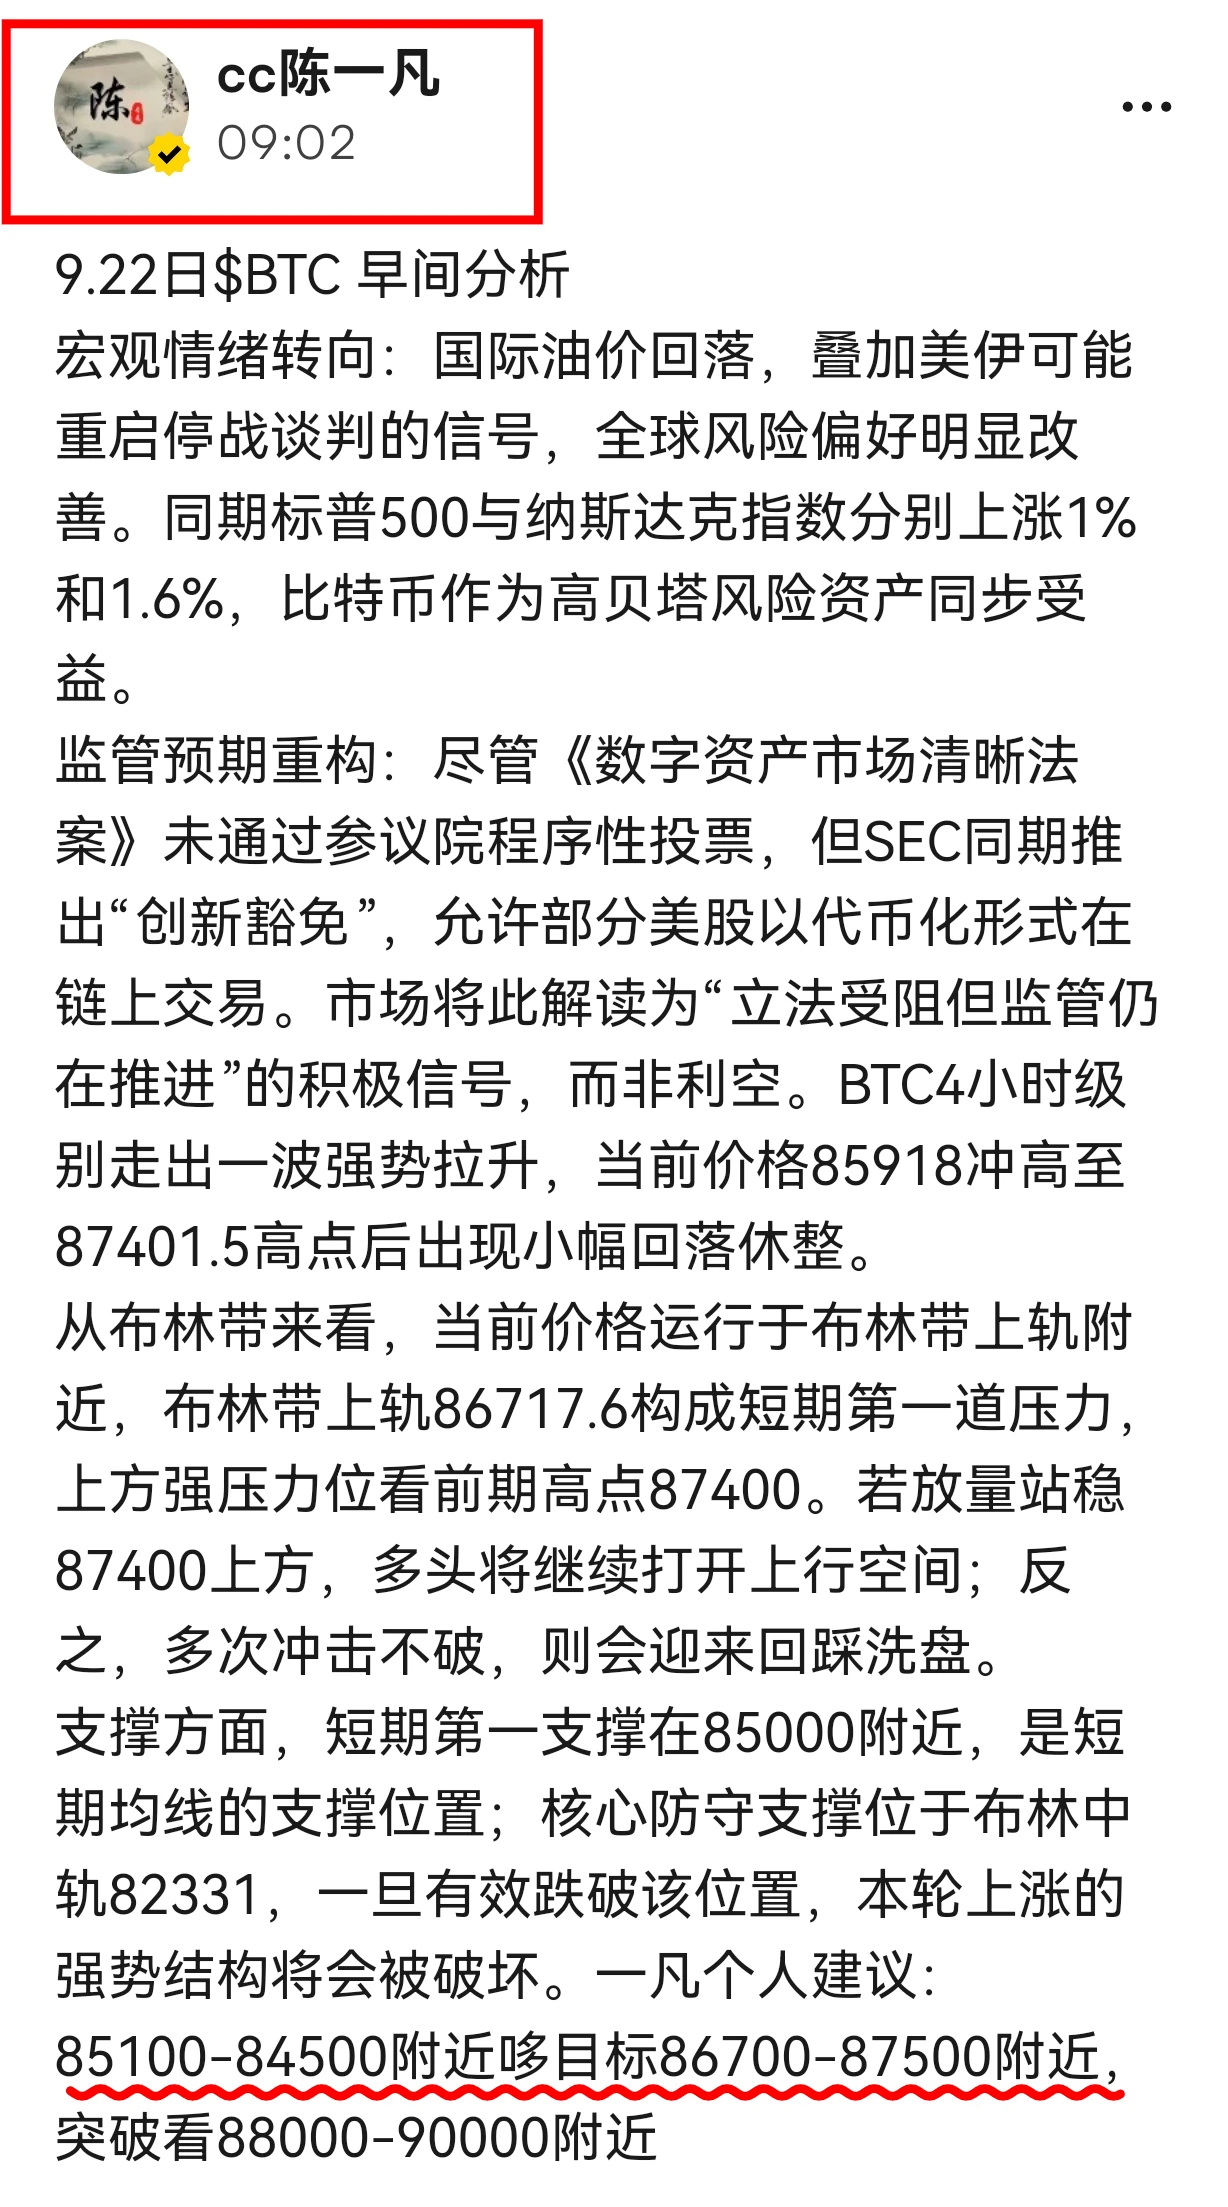
Sept. 22 $BTC Evening Analysis
Today’s market action has simply been oscillating back and forth. It rose right after the short position was just closed for profit. Currently, BTC is maintaining a high-level consolidation pattern on the four-hour chart, with the current price at 86646.5. After previously surging to the stage high of 87401.5, the bulls failed to maintain their momentum, and the market entered a range-bound consolidation phase. After pulling back to the 85121.4 support level, it rebounded again to recover.
From the perspective of the Bollinger Bands, the middle band is at 83047
post-image
BTC+1.19%
This afternoon I had you go long around 85,100 and take profit at 86,300. Now short around here down to 85,500, capturing several hundred points of room directly—take it. Ride the swings back and forth; Yifan’s market orders never miss. I had you close your longs—what could be wrong with shorting?#BTC #ETH #BTC走势分析
post-image
BTC+1.20%
ETH+0.91%
  • 1