


#CryptoMarketUpdate
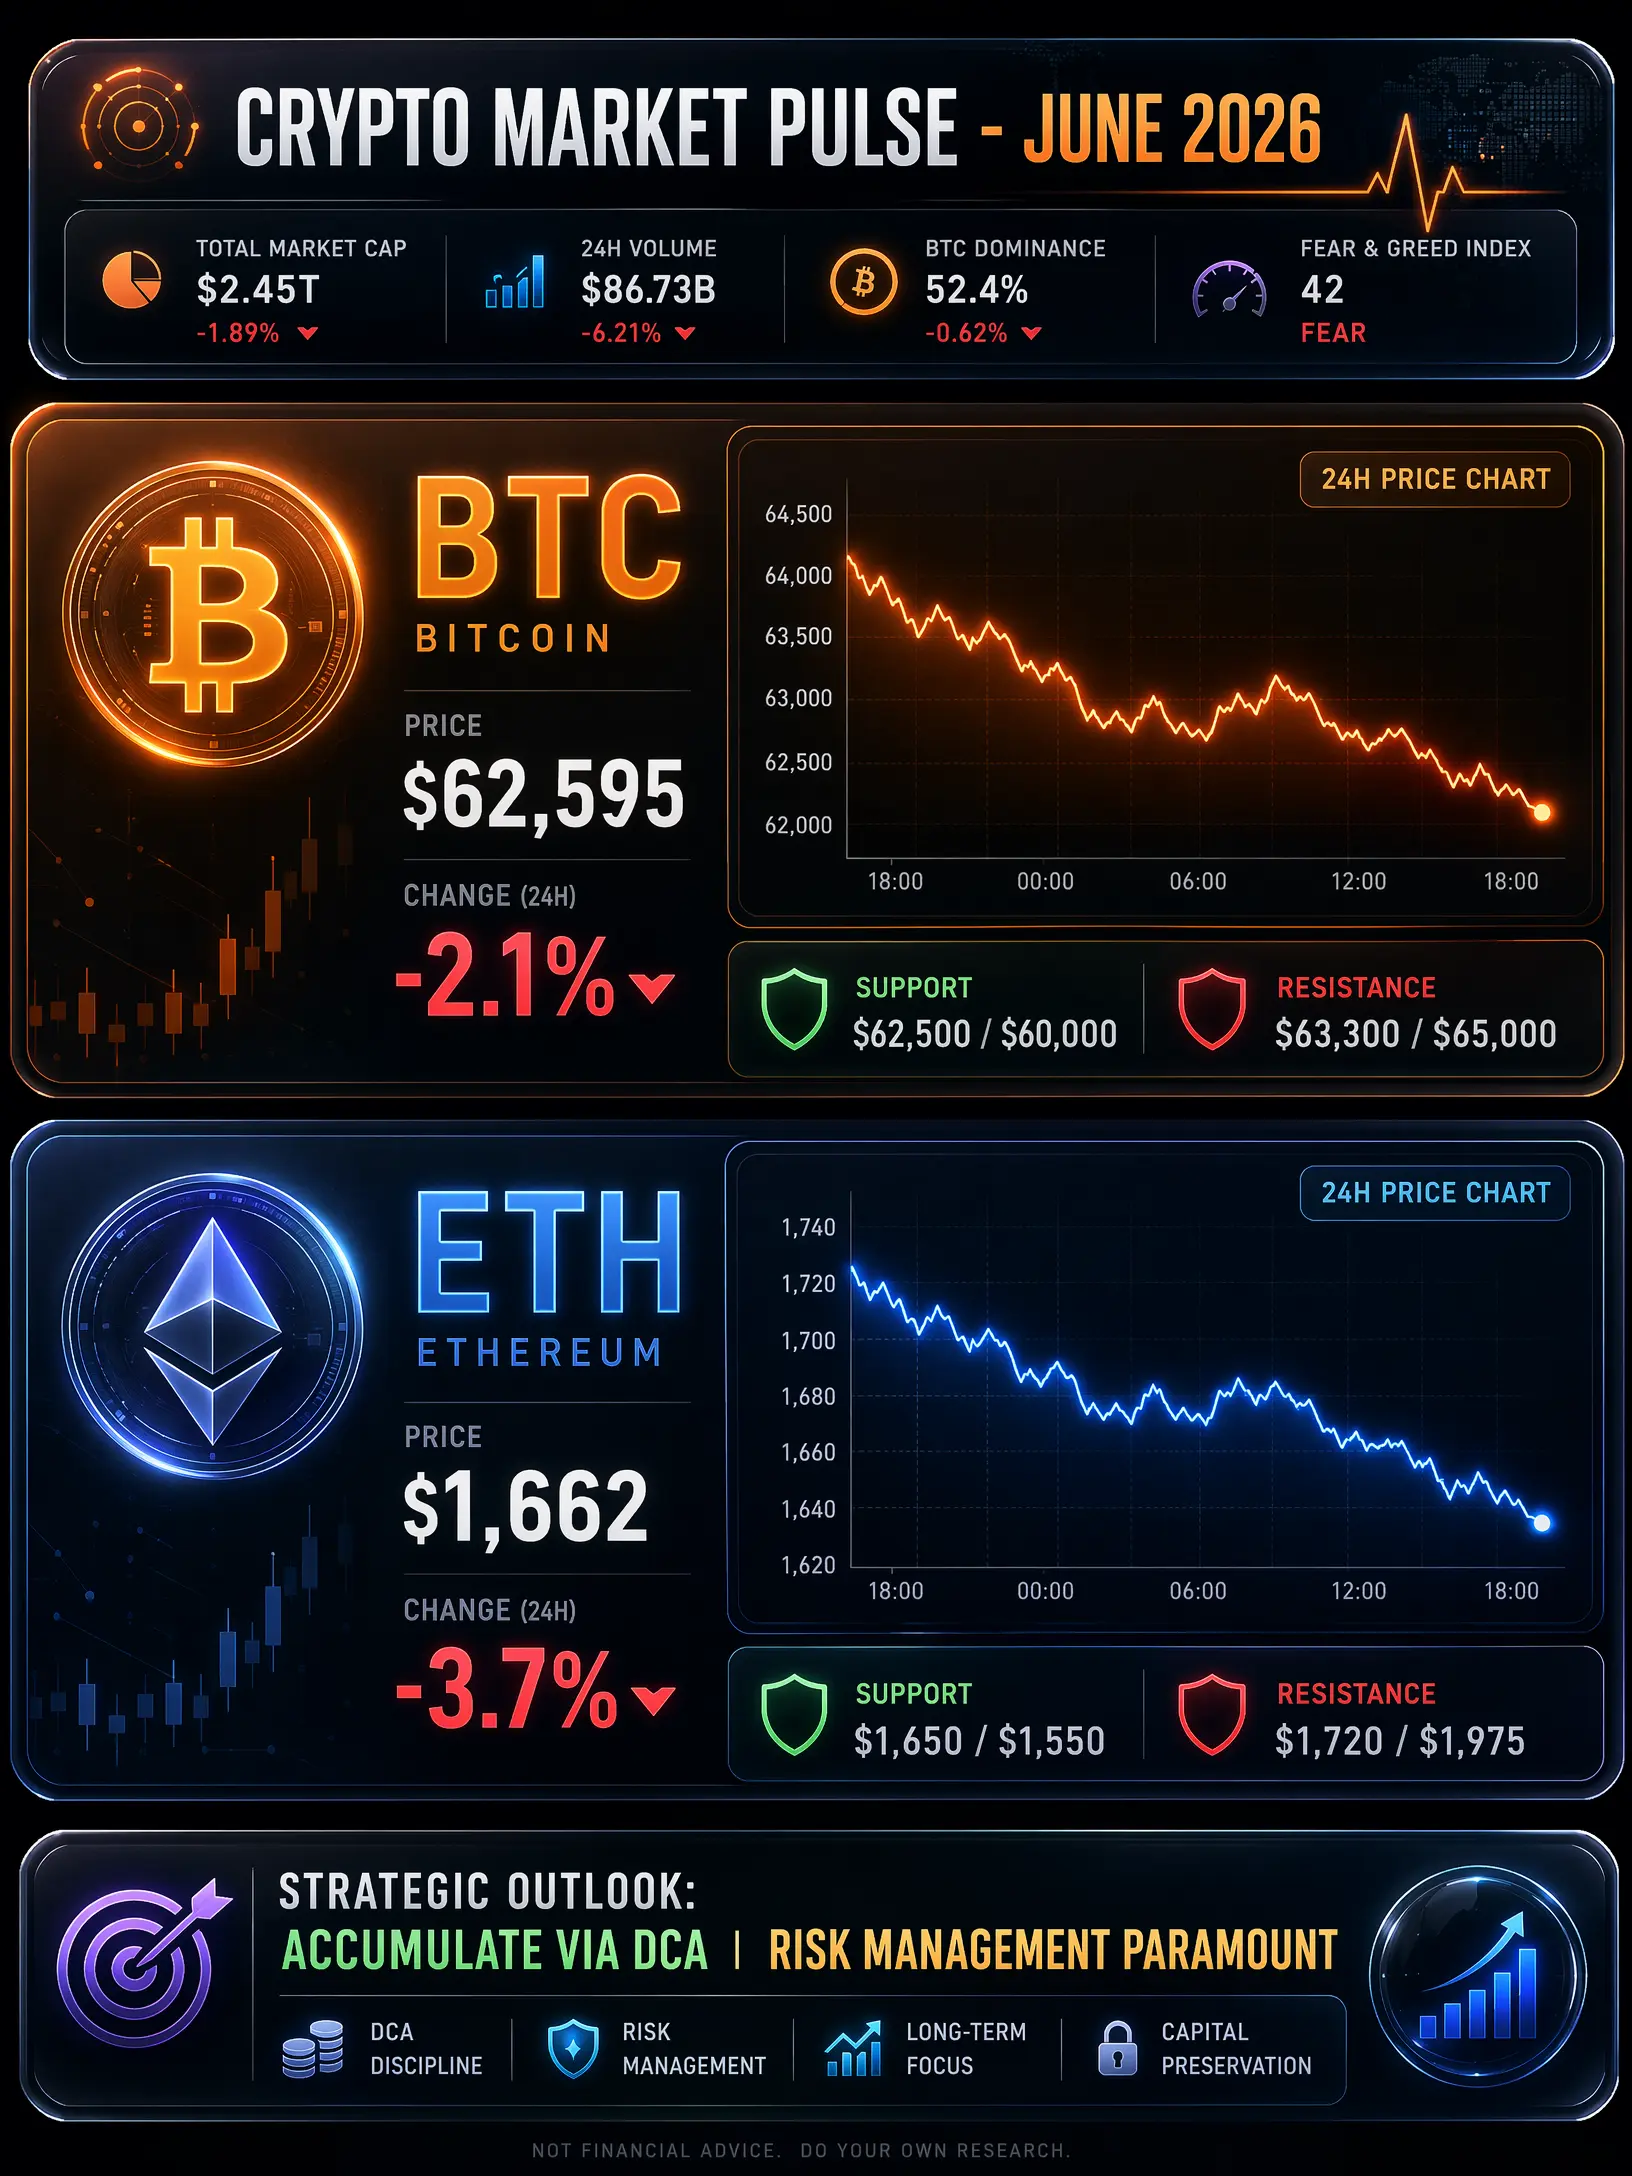
The cryptocurrency market is experiencing significant turbulence as Bitcoin trades at $62,595, marking a decline of 2.1% over the past 24 hours, while Ethereum has fallen to $1,662, down 3.7% with approximately $170 million in leveraged long positions liquidated. This comprehensive analysis examines the current market conditions, critical price levels, and strategic recommendations for investors and traders navigating this volatile environment.
Bitcoin Market Analysis and Price Action
Bitcoin has been under considerable pressure as geopolitical tensions and macroeconomic uncertainties weigh heavily on risk assets. The current price of $62,595 represents a critical juncture where bulls and bears are battling for control. Technical analysis reveals that immediate support lies at the $62,500 level, with a breach below this threshold potentially triggering further downside toward $61,800 and potentially $60,000. On the resistance side, Bitcoin faces immediate hurdles at $63,300, followed by stronger resistance at $64,100 and the psychological $65,000 level.
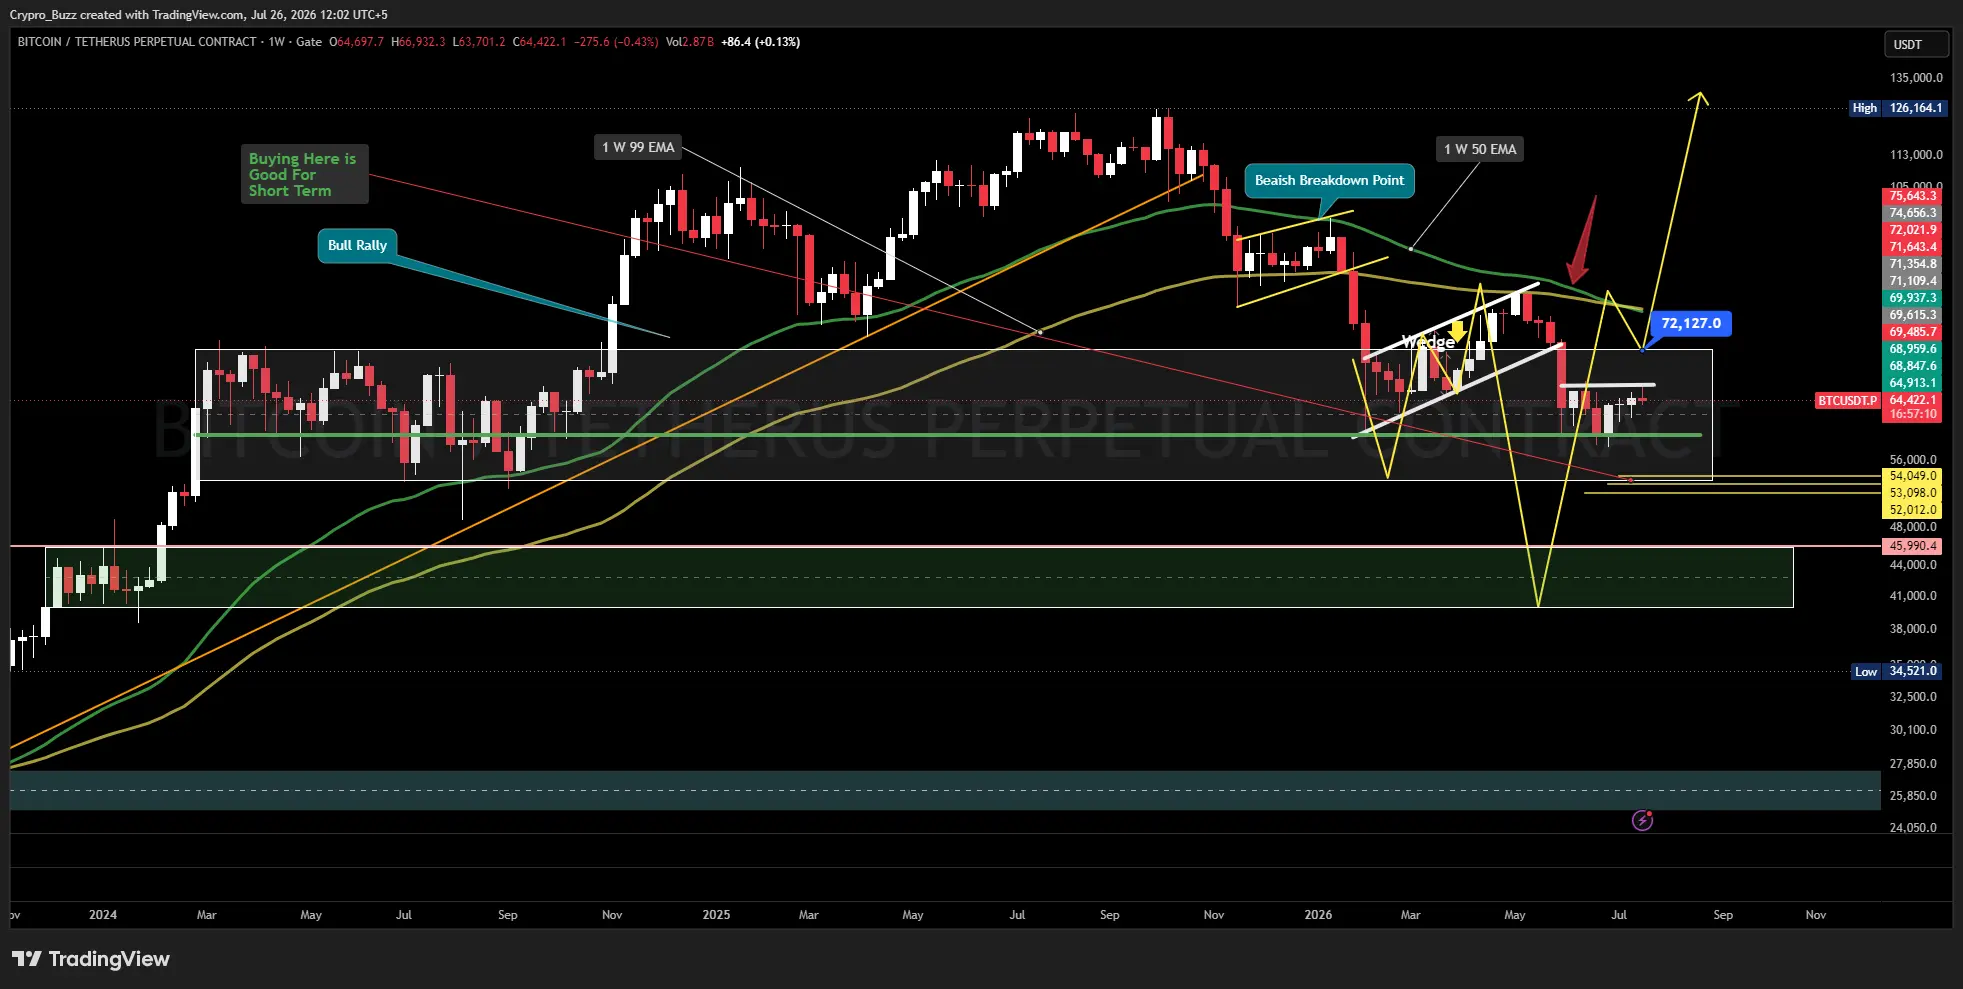
Market analysts have identified that a daily close above $78,000 would significantly alter the bullish outlook, potentially opening pathways toward the $88,000 to $92,000 resistance zone. However, the current bearish momentum suggests that traders should exercise caution. The Relative Strength Index indicates oversold conditions on shorter timeframes, which could support a technical bounce, but the broader trend remains under pressure due to external macro factors including Middle East tensions and their impact on global risk sentiment.
Ethereum Market Dynamics and Technical Outlook
Ethereum's decline to $1,662 reflects broader market weakness compounded by specific network concerns. The $170 million in liquidated leveraged long positions demonstrates the severity of the recent selloff and the high level of leverage present in the market. Current technical analysis places immediate support for Ethereum at $1,650, with critical support extending down to $1,600. Should this level fail to hold, the next significant support zone appears at $1,550.
Resistance levels for Ethereum are positioned at $1,720, followed by $1,800, and the more substantial barrier at $1,975. Analysts from various forecasting platforms suggest that Ethereum could trade within a range of $1,650 to $1,950 throughout June 2026, with some projections indicating potential recovery toward $2,040 by year-end. The formation of an inverted cup pattern on longer timeframes suggests continued caution is warranted, though whale accumulation patterns indicate that smart money may be positioning for longer-term recovery.
Price Forecasts and Market Predictions
For Bitcoin, near-term forecasts suggest continued volatility with potential tests of the $60,000 to $62,000 support zone. Medium-term projections indicate that if current support levels hold, Bitcoin could recover toward $70,000 by the third quarter of 2026, with more optimistic scenarios targeting $78,000 to $80,000 should macro conditions improve. Long-term forecasts remain bullish, with projections of $88,000 to $92,000 achievable if institutional adoption continues and regulatory clarity emerges.
Ethereum's price trajectory appears more constrained in the immediate term, with forecasts suggesting a trading range between $1,650 and $2,175 throughout June 2026. By year-end, projections place Ethereum at approximately $2,040, representing a potential recovery of 23% from current levels. Longer-term outlooks remain constructive, with forecasts of $2,835 by 2030 and $5,411 by 2040 reflecting continued confidence in Ethereum's fundamental value proposition despite current headwinds.
Strategic Recommendations for Investors
For long-term investors, the current market conditions present potential accumulation opportunities at discounted prices. Dollar-cost averaging strategies remain appropriate for those with extended investment horizons, with particular attention to the $60,000 to $62,500 zone for Bitcoin and the $1,600 to $1,650 range for Ethereum. Investors should maintain adequate cash reserves and avoid over-leverage, as volatility is likely to persist in the near term.
Risk management remains paramount, with position sizing appropriate to individual risk tolerance and portfolio allocation principles. The recent liquidation events serve as a reminder of the dangers of excessive leverage in volatile markets. Investors should consider staking opportunities and yield-generating strategies on platforms like Gate, which offers competitive returns for holding assets without active trading.
Trading Strategies for Active Traders
Active traders should focus on range-bound strategies until clearer directional momentum emerges. For Bitcoin, scalping opportunities exist between the $62,500 support and $63,300 resistance levels, with swing traders monitoring for potential breakdowns below $62,000 or breakouts above $64,100. Ethereum traders should watch the $1,650 support closely, with intraday opportunities between $1,660 and $1,720.
Stop-loss placement is critical in current conditions, with recommended stops below $62,000 for Bitcoin long positions and below $1,600 for Ethereum. Take-profit targets should be set at resistance levels, with partial position closures recommended as price approaches key technical barriers. Traders should reduce position sizes during periods of heightened volatility and avoid counter-trend trading until clearer reversal signals emerge.
Market Sentiment and External Factors
Market sentiment has shifted decidedly risk-off as geopolitical tensions in the Middle East create uncertainty across all risk assets. Unlike traditional markets that close on weekends, cryptocurrency markets trade continuously, meaning weekend price action often reflects real-time sentiment ahead of traditional market openings. Traders should monitor developments in Washington and Tehran, as escalation could trigger further risk-off moves.
Institutional flows remain a key factor to watch, with ETF outflows contributing to recent pressure on Ethereum. The Ethereum Foundation's recent restructuring, including a 20% staff reduction, has also weighed on sentiment. However, whale accumulation patterns and on-chain metrics suggest that smart money continues to accumulate during weakness, potentially setting the stage for future rallies.
The cryptocurrency market faces a challenging near-term outlook with Bitcoin at $62,595 and Ethereum at $1,662 both under pressure. Critical support levels at $62,500 for Bitcoin and $1,650 for Ethereum will determine whether the current decline extends or a base forms for recovery. Investors should focus on risk management and long-term positioning, while traders should employ range-bound strategies with strict stop-loss discipline. The fundamental value propositions of both Bitcoin and Ethereum remain intact, suggesting that current weakness may present opportunities for patient capital. As always, diversification and appropriate position sizing remain essential for navigating volatile cryptocurrency markets.
@Gate_Square #BTCAnalysis #ETHForecast #TradingStrategy
The cryptocurrency market is experiencing significant turbulence as Bitcoin trades at $62,595, marking a decline of 2.1% over the past 24 hours, while Ethereum has fallen to $1,662, down 3.7% with approximately $170 million in leveraged long positions liquidated. This comprehensive analysis examines the current market conditions, critical price levels, and strategic recommendations for investors and traders navigating this volatile environment.
Bitcoin Market Analysis and Price Action
Bitcoin has been under considerable pressure as geopolitical tensions and macroeconomic uncertainties weigh heavily on risk assets. The current price of $62,595 represents a critical juncture where bulls and bears are battling for control. Technical analysis reveals that immediate support lies at the $62,500 level, with a breach below this threshold potentially triggering further downside toward $61,800 and potentially $60,000. On the resistance side, Bitcoin faces immediate hurdles at $63,300, followed by stronger resistance at $64,100 and the psychological $65,000 level.
Market analysts have identified that a daily close above $78,000 would significantly alter the bullish outlook, potentially opening pathways toward the $88,000 to $92,000 resistance zone. However, the current bearish momentum suggests that traders should exercise caution. The Relative Strength Index indicates oversold conditions on shorter timeframes, which could support a technical bounce, but the broader trend remains under pressure due to external macro factors including Middle East tensions and their impact on global risk sentiment.
Ethereum Market Dynamics and Technical Outlook
Ethereum's decline to $1,662 reflects broader market weakness compounded by specific network concerns. The $170 million in liquidated leveraged long positions demonstrates the severity of the recent selloff and the high level of leverage present in the market. Current technical analysis places immediate support for Ethereum at $1,650, with critical support extending down to $1,600. Should this level fail to hold, the next significant support zone appears at $1,550.
Resistance levels for Ethereum are positioned at $1,720, followed by $1,800, and the more substantial barrier at $1,975. Analysts from various forecasting platforms suggest that Ethereum could trade within a range of $1,650 to $1,950 throughout June 2026, with some projections indicating potential recovery toward $2,040 by year-end. The formation of an inverted cup pattern on longer timeframes suggests continued caution is warranted, though whale accumulation patterns indicate that smart money may be positioning for longer-term recovery.
Price Forecasts and Market Predictions
For Bitcoin, near-term forecasts suggest continued volatility with potential tests of the $60,000 to $62,000 support zone. Medium-term projections indicate that if current support levels hold, Bitcoin could recover toward $70,000 by the third quarter of 2026, with more optimistic scenarios targeting $78,000 to $80,000 should macro conditions improve. Long-term forecasts remain bullish, with projections of $88,000 to $92,000 achievable if institutional adoption continues and regulatory clarity emerges.
Ethereum's price trajectory appears more constrained in the immediate term, with forecasts suggesting a trading range between $1,650 and $2,175 throughout June 2026. By year-end, projections place Ethereum at approximately $2,040, representing a potential recovery of 23% from current levels. Longer-term outlooks remain constructive, with forecasts of $2,835 by 2030 and $5,411 by 2040 reflecting continued confidence in Ethereum's fundamental value proposition despite current headwinds.
Strategic Recommendations for Investors
For long-term investors, the current market conditions present potential accumulation opportunities at discounted prices. Dollar-cost averaging strategies remain appropriate for those with extended investment horizons, with particular attention to the $60,000 to $62,500 zone for Bitcoin and the $1,600 to $1,650 range for Ethereum. Investors should maintain adequate cash reserves and avoid over-leverage, as volatility is likely to persist in the near term.
Risk management remains paramount, with position sizing appropriate to individual risk tolerance and portfolio allocation principles. The recent liquidation events serve as a reminder of the dangers of excessive leverage in volatile markets. Investors should consider staking opportunities and yield-generating strategies on platforms like Gate, which offers competitive returns for holding assets without active trading.
Trading Strategies for Active Traders
Active traders should focus on range-bound strategies until clearer directional momentum emerges. For Bitcoin, scalping opportunities exist between the $62,500 support and $63,300 resistance levels, with swing traders monitoring for potential breakdowns below $62,000 or breakouts above $64,100. Ethereum traders should watch the $1,650 support closely, with intraday opportunities between $1,660 and $1,720.
Stop-loss placement is critical in current conditions, with recommended stops below $62,000 for Bitcoin long positions and below $1,600 for Ethereum. Take-profit targets should be set at resistance levels, with partial position closures recommended as price approaches key technical barriers. Traders should reduce position sizes during periods of heightened volatility and avoid counter-trend trading until clearer reversal signals emerge.
Market Sentiment and External Factors
Market sentiment has shifted decidedly risk-off as geopolitical tensions in the Middle East create uncertainty across all risk assets. Unlike traditional markets that close on weekends, cryptocurrency markets trade continuously, meaning weekend price action often reflects real-time sentiment ahead of traditional market openings. Traders should monitor developments in Washington and Tehran, as escalation could trigger further risk-off moves.
Institutional flows remain a key factor to watch, with ETF outflows contributing to recent pressure on Ethereum. The Ethereum Foundation's recent restructuring, including a 20% staff reduction, has also weighed on sentiment. However, whale accumulation patterns and on-chain metrics suggest that smart money continues to accumulate during weakness, potentially setting the stage for future rallies.
The cryptocurrency market faces a challenging near-term outlook with Bitcoin at $62,595 and Ethereum at $1,662 both under pressure. Critical support levels at $62,500 for Bitcoin and $1,650 for Ethereum will determine whether the current decline extends or a base forms for recovery. Investors should focus on risk management and long-term positioning, while traders should employ range-bound strategies with strict stop-loss discipline. The fundamental value propositions of both Bitcoin and Ethereum remain intact, suggesting that current weakness may present opportunities for patient capital. As always, diversification and appropriate position sizing remain essential for navigating volatile cryptocurrency markets.
@Gate_Square #BTCAnalysis #ETHForecast #TradingStrategy