Square
Following
Hot
News
Profile

Crypto_Buzz_with_Alex

vip
Market Analyst
Futures Trading Strategist
Airdrop Hunter
Crypto enthusiast | Spot, Limit and Stop Loss trading made simple | Easy crypto lessons | Live streams to learn, grow, and trade smarter together
40
Following
4.2k
Followers
36.2k
Liked
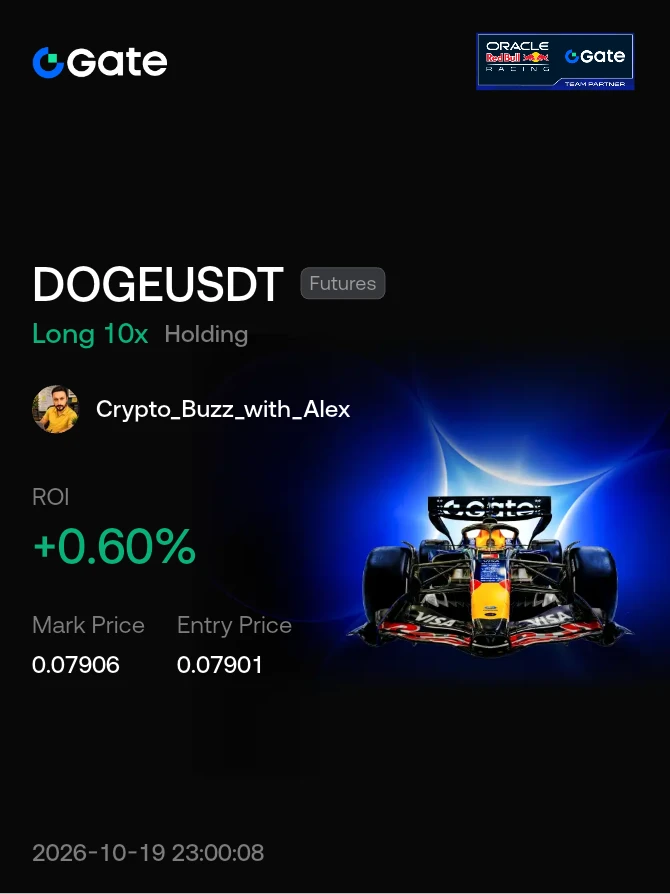
#Share My Holding Returns
Another Amazing Setup and still running 🤩
post-image
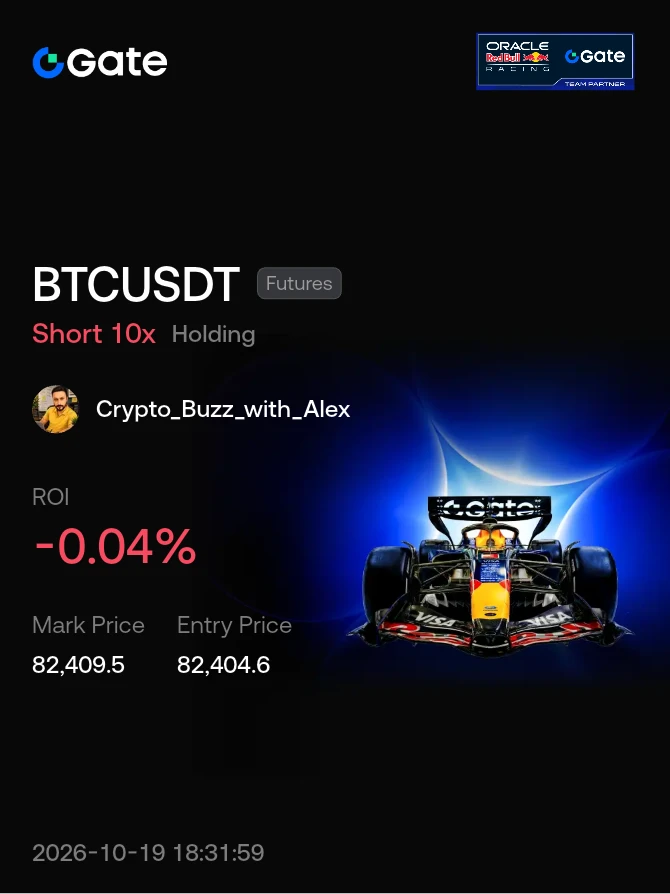
#Share My Holding Returns
This is Amazing 🤩
post-image
Market Analysis - September 30, 2026
live-replay-cover
618 views09-30 08:23
00:48:46
‍#ShareWeekly
‍#HowToPositionForAPullback $BTC
‍Bitcoin is showing weakness, and for me, $82K is the key level right now.
If BTC gets a daily close below $82K and fails to reclaim it, I think the current move can start looking very different. From there, $75K → $70K becomes the area I’ll be watching.
That doesn’t mean it has to happen tomorrow. Markets can move against you for weeks or even months before the bigger structure plays out. I’ve already learned that the hard way because BTC liquidated my short. I still see the recent move as potentially being a trap followed by heavy liquidation.
Crypto_Buzz_with_Alex
#ShareWeekly
‍#HowToPositionForAPullback $BTC $ETH
BTC Reclaims Liquidity, ETH Sets Up a Buy Zone: How I'm Positioning for This Pullback
BTC and ETH both pulled back hard after their recent rallies, and both are now showing signs of a bounce off key support. Gate Square's weekly topic is asking how people are positioning for a pullback, and honestly, I think both charts here answer that question well, if you read the structure carefully.
What's happening on BTC
Looking at my chart, BTC swept liquidity below the $76,000 to $75,000 zone in mid-September, marked clearly as a "Liquidity Grab" at the start of this move, then reversed hard and broke structure (BOS) on the way up. That liquidity sweep is important: it's the kind of move that clears out stop losses below a level before price actually turns higher, which is a common pattern before a real trend shift rather than a random dip.
From there, BTC pushed up through a CHOCH (change of character) around $80,000 to $82,000, ran into the FVG (fair value gap) zone, and eventually rallied to the PBOS (prior break of structure) high at $87,380. Since that high, price pulled back into the OB+FVG resistance zone around $84,050 to $84,950, got rejected multiple times, and has now retraced into the larger FVG zone between roughly $82,400 and $83,900.
The key detail on this chart is the "Retest" label near the current price around $83,986. Price dipped down toward $82,400 to $82,900, then bounced back up into this FVG zone, which is exactly the kind of retest you want to see after a liquidity grab and structure break, price returning to test a previous support zone from above and holding, rather than breaking straight through it.
What's happening on ETH
The ETH chart tells a very similar story with more precision, and it's marked with an actual trade idea: Buy limit at $2,585, stop loss at $2,540 (-1%), with take-profit targets at $2,621, $2,667, $2,718, $2,775 and $2,833.
The structure here shows ETH breaking through multiple BOS levels on the way up from the $2,356 low, hitting a CHOCH+ around $2,470, then a series of higher BOS levels leading to the PBOS high at $2,806.43. After that high, ETH pulled back into the IFVG (inverse fair value gap) zone around $2,565 to $2,600, which lines up closely with the Key Level Low marked at $2,565.
ETH is currently trading at $2,712.04, which means it has already moved up from that IFVG zone without needing to tag the exact $2,585 buy limit. That's actually a bullish sign on its own: the fact that ETH bounced before reaching the deepest part of the demand zone suggests buyers stepped in early rather than waiting for maximum discount, which often points to stronger underlying demand.
Reading these two charts together
Both charts show the same pattern: a strong impulsive move up, a pullback into a well-defined demand zone (FVG or IFVG), and early signs of a bounce rather than a breakdown. BTC's retest near $83,986 and ETH's move back above $2,700 both support the idea shared with me that Bitcoin rebounded after testing support and the market absorbed the liquidity on the way up. That's consistent with what I'm seeing on both charts, this isn't distribution, it looks like accumulation happening after the shakeout.
My trading plan
For ETH, I'm working directly from the levels on my chart: a buy limit at $2,585 with a stop at $2,540 gives a tight, defined risk of about 1%, and the take-profit ladder at $2,621, $2,667, $2,718, $2,775 and $2,833 lets me scale out as price moves through each old resistance level turned support. Since ETH is already trading well above the $2,585 entry at $2,712, that specific limit order may not fill unless there's a deeper retracement, and I'm fine with that. I'd rather miss an entry than chase price after it's already moved.
For BTC, my plan is built around the $82,400 to $83,900 FVG zone holding as support. If BTC holds this zone and reclaims the $84,050 to $84,950 resistance area with strength, that confirms the retest is complete and the structure remains bullish, with $87,380 as the next target to retest. If BTC breaks back below $82,400 and loses the retest, I'd treat that as invalidation of this specific bullish read, and I'd expect a deeper move toward the golden ratio and key MSS level near $80,000 to $80,900 that I've been tracking all week.
How I'm thinking about position sizing
Given both charts show tight, well-defined risk (BTC's invalidation around $82,400, ETH's stop at $2,540), I'd rather use those precise levels than a random percentage. A pullback like this is exactly the kind of setup where clear invalidation matters more than trying to guess the bottom. If either level breaks cleanly, I'm out, no exceptions, because a break of a defined demand zone changes the entire structure of the trade.
BTC and ETH versus higher-beta alts
Given how clean these bounce setups look on the majors right now, I'm leaning toward BTC and ETH over higher-beta alts for this particular pullback. Altcoins typically need BTC and ETH to show sustained strength before they follow, and both of these charts are still in the "confirming the bounce" stage rather than the "trend clearly resumed" stage. I'd rather see BTC clear $84,950 and ETH clear $2,806 with volume before rotating attention toward alts.
What I'm watching next
Whether BTC holds the $82,400 to $83,900 zone on any further retest and reclaims $84,950. Whether ETH holds above $2,650 to $2,700 and pushes toward the $2,775 to $2,833 target zone without needing to revisit the $2,585 buy limit. And whether both charts show the kind of steady, controlled price action that confirms accumulation, versus a sharp reversal that would suggest the liquidity grab was actually distribution in disguise.
Risks
Liquidity grabs and FVG retests are common patterns, but they aren't guarantees. A break below BTC's $82,400 zone or ETH's $2,540 stop level would invalidate this bullish structure and open deeper downside. Macro pressure, which has been cited as a factor weighing on BTC this week, can override clean technical setups at any time. And these are my own chart markups, so I'd encourage checking the structure yourself before acting on any of these levels.
My overall view
Both charts support the idea that this pullback found real buyers rather than just running out of sellers temporarily. BTC's retest into the FVG zone and ETH's bounce before even reaching its deepest demand zone both point toward accumulation. I'm positioning around the specific invalidation levels on each chart, $82,400 for BTC, $2,540 for ETH, rather than guessing a bottom, and I'd want to see both majors confirm strength before considering higher-beta alts for this particular move.
Discussion
Are you adding to positions here, or waiting for a deeper retest before committing? And for this pullback specifically, are you sticking with BTC and ETH, or do you think certain alts are set up better for a bounce right now? Feel free to share your own P&L or portfolio changes and strategy below.
Not financial advice. Always do your own research before making any trading or investment decision.
repost-content-media
BTC+1.31%
  • 3
#OpenAIAnnualRecurringRevenueNears$70B $OPENAI
OpenAI's Revenue Run Rate Just Jumped 70% in One Quarter, and the Chart Is Already Reflecting the Race With Anthropic
OpenAI's annualized revenue run rate is nearing $70 billion, up more than 70% since the start of Q3, with enterprise sales more than doubling since July and B2B revenue growing over 100% in the same window. On the consumer side, OpenAI added more new revenue in Q3 alone than it added across all of 2025. This is a genuinely sharp acceleration, and it's landing at a very specific moment: right as both OpenAI and Anthropic are prepar
OPENAI+3.24%
  • 3
  • 1
#BrentTops$106USTalksStall $XTIUSD $XBRUSD
Brent's Geopolitical Premium Is Back, and the Charts Show Oil Hasn't Fully Priced In "War Resumes After Midterms" Yet
Brent crude is trading in the $105 to $107 range on most benchmark feeds right now, though Gate's own XBRUSDT chart shows it closer to $100.64, a reminder that different venues and instruments can lag or lead the broader benchmark slightly. Either way, the direction is the same: oil has a real geopolitical risk premium back in it, and the reason is specific. Qatar's mediation between the US and Iran hasn't produced a breakthrough, and
XTIUSD+1.32%
XBRUSD+1.89%
  • 5
  • 1
#US30-YearTreasuryYieldHits5.595%,HighestSince2002 $TLT
The 30-Year Yield Just Hit a 24-Year High, and the Scariest Part Isn't the Number, It's Why It's Happening
The 30-year Treasury yield touched 5.612% yesterday before easing slightly to around 5.553% today, still the highest level this bond has seen since 2002. What actually worries me more than the level itself is the reasoning behind it. This isn't primarily a story about the Fed fighting inflation with rate hikes. It's a story about who's buying US government debt, and who's stopped.
What's actually driving this move
Multiple pieces l
TLT-0.53%
  • 4
  • 1
#MicronReportQ4Earnings $MU
Micron Reports Tonight With an 8-10% Move Priced In: How I'm Framing the Binary Risk
Micron reports fiscal Q4 2026 results after the close today, and the setup has sharpened since I last looked at this a couple of days ago. Consensus now sits at roughly $51 billion in revenue and about $31.5 in EPS, and options pricing is implying an 8% to 10% move on the print. That's a genuinely large expected swing for a stock already up several hundred percent over the past year, and it changes how I'd think about positioning around this specific event.
Why the implied move mat
MU+1.09%
  • 4
  • 1
#ETHEarningsUpTo5%BonusAPR $ETH
ETH Bonus APR Lands on Q3's Last Day, Right Before Today's Inflation Print
Gate's ETH Simple Earn bonus is still running, same terms as before: a net deposit of at least 0.3 ETH into the 7-day fixed-term product gets you a 3% bonus APR, and a net deposit of at least 3 ETH also unlocks a 10 USDT futures trial bonus for the first 1,000 participants. What makes today worth a fresh look isn't the campaign terms, it's the timing. This is the last day of Q3, and it's landing on the same day as the August core PCE release, one of the more consequential macro prints of
ETH+0.04%
  • 4
  • 1
#AnthropicDiscloses$84.5BComputeDealWithSpaceX $ANTHROPIC
Anthropic's SpaceX Bill Nearly Doubled to $84.5B, and the Real Story Is Where That Compute Actually Comes From
Anthropic's confidential IPO filing revealed a compute agreement with SpaceX worth up to $84.5 billion through 2029, almost double the roughly $45 billion figure disclosed back in May. SpaceX shares reacted well, up 2.59% to $149.24. What I find more interesting than the headline number is a detail that's easy to miss if you only read the summary: this deal actually runs through xAI, SpaceX's subsidiary, using its Colossus dat
ANTHROPIC+2.53%
  • 4
  • 1
#ThreeLaunchpoThreeLaunchpoolsLiveSimultaneously,ShareMillionsInAirdropsolsLiveSimultaneously,ShareMillionsInAirdrops
‍$XAUT $FOLD $LAPTOP
Day Three of the FOLD, LAPTOP and XAUT Pools: A Correction and What I'm Actually Watching Now
I want to start this one with a correction, because getting it right matters more than getting it out fast. Yesterday I referred to the LAPTOP token in this Launchpool as "Hunter Biden's Laptop," a meme coin that launched on Base in early September. That was wrong. That specific token crashed over 99% within hours of launch and is now trading at a tiny fraction o
XAUT+1.32%
FOLD+7.05%
LAPTOP+1.11%
  • 4
  • 1
#MarvellJumps4.5% $MRVL $ARM $COHR $MU
The AI Hardware Rally Isn't About Chips Anymore, It's About Everything Around Them
AI hardware had a strong session across the board today: Lumentum up over 5%, Corning and Marvell up over 4%, ARM and Coherent up over 3%, SK Hynix up over 2%, Micron and Broadcom up over 1%. What actually interests me here isn't the size of any single move, it's the composition of who's rallying. This isn't a pure "chipmakers are up" day. Optics, glass, and connectivity names are leading, and that tells a more specific story than just "AI stocks good."
Why I think this ma
MRVL+4.51%
ARM+3.67%
COHR+3.49%
MU+1.09%
  • 4
  • 1
#CorePCEandGDPFinalReading $XAUT $BTC $ETH $US500
Core PCE Day: Why I'm Watching XAUT and BTC's Opposite Reactions More Than the Number Itself
Today's the last day of Q3, and it's closing with a real catalyst: August core PCE and the final Q2 GDP print land at 12:30 UTC. The market is pricing core PCE at +0.3% month over month, +3.3% year over year, with headline PCE at +3.7% year over year. All of that sits well above the Fed's 2% target, and it's been sitting there for a while now. The question isn't really whether inflation is elevated, it clearly is, it's whether this print nudges the "hi
XAUT+1.32%
BTC+1.31%
ETH+0.04%
US500+0.28%
  • 4
  • 1
#OneGateWitnessProgram $GT
I'm Witness Number 2,157: My Take on Gate's "Hold Anything" Shift
Gate just launched the One Gate Witness Program, and I ended up as witness number 2,157. Before getting into what the event actually offers, I want to talk about the idea behind it, because "hold anything, one platform" is a bigger statement than it might look like at first glance.
What the program actually is
The event runs from September 30, 12:00 to October 15, 12:00 (UTC+8), built around three themes: hold freely, pay on the go, and trade anytime. The core idea being pushed is that a single accoun
GT+0.55%
  • 4
  • 1
My One Gate Moment: Trade Anytime. Witness Gate's biggest evolution in 13 years with me. One Gate, Everything Money. https://www.gate.com/activities/everything-money-ceremony?ref_type=165&ch=Direct&ref=VVNHBAXDBQ&utm_cmp=BIPdAc5p
post-image
  • 3
My One Gate Moment: Spend Anywhere. Witness Gate's biggest evolution in 13 years with me. One Gate, Everything Money. https://www.gate.com/activities/everything-money-ceremony?ref_type=165&ch=Direct&ref=VVNHBAXDBQ&utm_cmp=BIPdAc5p
post-image
  • 3
My One Gate Moment: Hold Anything. Witness Gate's biggest evolution in 13 years with me. One Gate, Everything Money. https://www.gate.com/activities/everything-money-ceremony?ref_type=165&ch=Direct&ref=VVNHBAXDBQ&utm_cmp=BIPdAc5p
post-image
  • 3
My Q3 Save Note: One Call I Got Right, One I'm Still Reviewing, and What I'm Watching Into Q4
Last day of the quarter always makes me go back through my notes and actually be honest with myself about what worked and what didn't. Here's my save file for Q3.
The call I'm most glad I made
Staying patient through the mid-quarter chop instead of forcing trades. There were multiple stretches this quarter where price sat in tight ranges for days, and every instinct said "do something." The times I sat on my hands and waited for a level to actually confirm, rather than guessing at a breakout early, we
Gate_Square
☀️ GM. Last day of Q3.
Time to hit save. 💾
📌 Today’s topic: If you had to leave one save note for Q3, what would it be?
A few angles to post about:
Your best call this quarter
One trade or idea worth reviewing
What you’ll keep watching in Q4
✨ The quarter may be over, but your take still matters.
Share your Q3 recap on Gate Square. Strong posts may get featured and receive extra exposure.
👇 Save your Q3 here:
https://www.gate.com/post
repost-content-media
BTC+1.31%
  • 4
  • 1
#Share My Holding Returns
Rising towards the moon.
this is why i always say you must have to join my live stream for such kind of entries it's not just asking for your support it's about to make some money together for free.
follow for more updates 😁
post-image
  • 15
⚡ CRYPTO VOLATILITY IS BACK! 🔥
live-replay-cover
1,153 views09-29 17:03
01:49:34