


#我的Gate交易时刻 U.S. stocks, two major warning signals emerge!
Recently, the U.S. stock market has sent out two signals worth warning about: on one side, tech giants are reducing or even reversing stock buybacks due to heavy AI investments; on the other side, the "Buffett Indicator," which measures overall market valuation, has hit a record high.
Stock Buyback Trend Reversal
According to the Financial Times of the UK on June 10, over the past few decades, U.S. companies have widely engaged in stock buybacks, and the buyback wave since 2016 has directly driven U.S. stocks to increase by more than double. Now, this trend has completely reversed. Goldman Sachs data shows that in 2026, the net supply of U.S. stocks (the number of new stocks entering the market minus the stocks reduced through buybacks or privatizations) will be roughly flat, ending a continuous negative pattern since 2003.
Meanwhile, as the lock-up periods for listed companies this year expire, the supply of new U.S. stocks in 2027 will further expand significantly, with ongoing upward pressure on market stock supply.
The core reason for this market upheaval is the comprehensive shift of U.S. tech giants into AI, with capital focus fully transferred. SpaceX, Anthropic, and OpenAI are all advancing IPO plans, and leading Wall Street tech giants are launching billion-dollar-level equity fundraising plans, pouring funds into AI R&D and industry deployment. "Companies are investing massive amounts of capital into AI, leaving little for stock buybacks. Many U.S. tech giants have shifted from being stock repurchasers to net issuers," said Barclays Global Research Chairman Ajay Rajadiyaksha. The landscape of the U.S. stock market is undergoing a fundamental change.
Currently, the enthusiasm for equity financing in the U.S. stock market has reached a new phase high. Data from Dealogic shows that, excluding blank check companies (SPACs), 60 U.S. companies have gone public this year, raising nearly $40 billion, the highest since 2021.
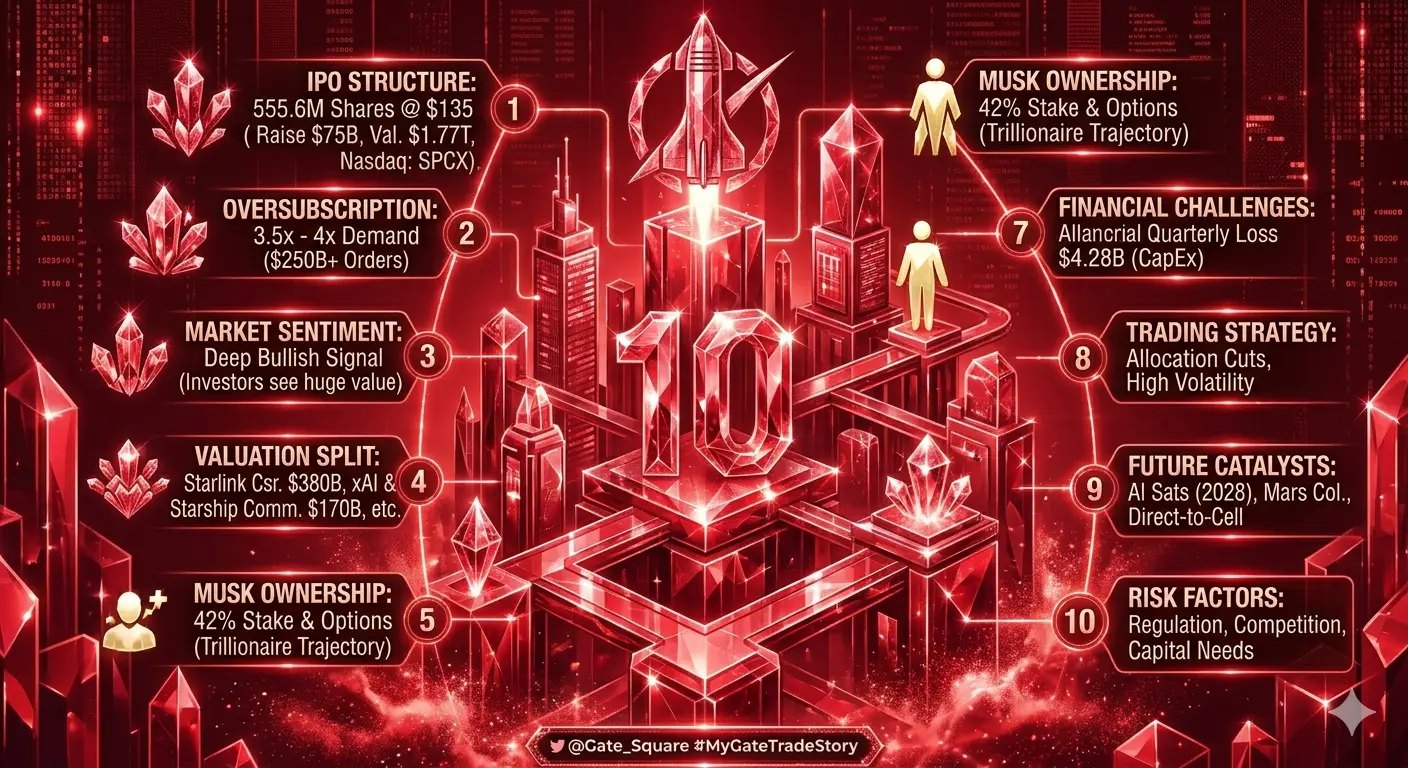
Goldman Sachs further predicts that with a large number of major companies going public successively, the total IPO fundraising in the U.S. this year could reach $225 billion, setting a record. Among them, SpaceX, owned by Elon Musk, is scheduled to go public this Friday, with a planned fundraising scale of up to $86 billion.
Capital Outflows! The "Seven Sisters" of U.S. stocks lose over $1 trillion in market value
Compared to new listings, large-scale equity issuance by already listed top tech companies has a more profound impact on the market and has directly triggered a valuation correction of core U.S. assets. Analyst George Pikes of Bespoke Investment Group pointed out that Alphabet, Google's parent company, completed a nearly $85 billion equity issuance last week to boost AI business, marking its first net issuance in 11 years.
Coincidentally, tech giant Meta is also planning an equivalent fundraising scheme to aggressively push AI deployment. Massive equity financing continues to drain market liquidity, causing a clear capital migration effect. Since SpaceX filed for an IPO, the combined market value of the seven major U.S. tech giants (commonly known as the "Seven Sisters") has evaporated over $1 trillion.
Market capital flow is clear: investors are selling high-flying tech stocks to raise funds for new stock subscriptions. Jordan Sturart, Managing Director of Federated Hermes Asset Management, said that everyone is chasing the next "Seven Sisters," and funds are mainly flowing out of these giants.
An international investment bank's head of equity capital markets said, "Undoubtedly, these massive IPOs will withdraw huge liquidity from the market. Such large-scale listings are unprecedented, involving enormous amounts of capital."
Reports indicate that some fund managers warn that historical experience shows that intense fundraising often occurs at market tops: insiders tend to sell at high valuations for cash, and the influx of new stocks can overwhelm the market.
Richard Bernstein, Chief Investment Officer of Bernstein Advisors, said, "The record scale of new stock issuance in the U.S. is a classic sign of a market bubble. Even after adjusting for inflation, the total fundraising of these three giant IPOs far exceeds the total during the internet bubble of 1999-2000."
Buffett Indicator at "Obvious Overvaluation" Besides the supply-demand reversal, the overall valuation of U.S. stocks also signals red lights. The Buffett Indicator, regarded by Buffett as "the best single measure of market valuation," has recently hit a new all-time high, fully exposing market overvaluation risks.
According to the latest data from GuruFocus, the Buffett Indicator is currently about 232.5%, up sharply by 13% from the low on March 30. Since GuruFocus started recording this indicator in 1970, it has never reached such a high level. At the current level, the indicator is in the "obvious overvaluation" zone.
Public information shows that the Buffett Indicator is the ratio of the total market capitalization of U.S. stocks (Wilshire 5000 Index) to the U.S. annual GDP, and is a globally recognized core measure of stock market overheating. The indicator gained fame after Warren Buffett and long-time Fortune magazine contributor Carol Loomis published an article in Fortune in 2001.
Generally, if the Buffett Indicator is below 50%, it indicates the stock market is severely undervalued; between 75% and 90% suggests a reasonable valuation; over 115% indicates severe overvaluation. Buffett once said in 2001, "When this ratio is between 70% and 80%, buying stocks is likely to bring good returns. If it approaches 200%, like in 1999 and some periods in 2000, you're playing with fire."
Recently, the U.S. stock market has sent out two signals worth warning about: on one side, tech giants are reducing or even reversing stock buybacks due to heavy AI investments; on the other side, the "Buffett Indicator," which measures overall market valuation, has hit a record high.
Stock Buyback Trend Reversal
According to the Financial Times of the UK on June 10, over the past few decades, U.S. companies have widely engaged in stock buybacks, and the buyback wave since 2016 has directly driven U.S. stocks to increase by more than double. Now, this trend has completely reversed. Goldman Sachs data shows that in 2026, the net supply of U.S. stocks (the number of new stocks entering the market minus the stocks reduced through buybacks or privatizations) will be roughly flat, ending a continuous negative pattern since 2003.
Meanwhile, as the lock-up periods for listed companies this year expire, the supply of new U.S. stocks in 2027 will further expand significantly, with ongoing upward pressure on market stock supply.
The core reason for this market upheaval is the comprehensive shift of U.S. tech giants into AI, with capital focus fully transferred. SpaceX, Anthropic, and OpenAI are all advancing IPO plans, and leading Wall Street tech giants are launching billion-dollar-level equity fundraising plans, pouring funds into AI R&D and industry deployment. "Companies are investing massive amounts of capital into AI, leaving little for stock buybacks. Many U.S. tech giants have shifted from being stock repurchasers to net issuers," said Barclays Global Research Chairman Ajay Rajadiyaksha. The landscape of the U.S. stock market is undergoing a fundamental change.
Currently, the enthusiasm for equity financing in the U.S. stock market has reached a new phase high. Data from Dealogic shows that, excluding blank check companies (SPACs), 60 U.S. companies have gone public this year, raising nearly $40 billion, the highest since 2021.
Goldman Sachs further predicts that with a large number of major companies going public successively, the total IPO fundraising in the U.S. this year could reach $225 billion, setting a record. Among them, SpaceX, owned by Elon Musk, is scheduled to go public this Friday, with a planned fundraising scale of up to $86 billion.
Capital Outflows! The "Seven Sisters" of U.S. stocks lose over $1 trillion in market value
Compared to new listings, large-scale equity issuance by already listed top tech companies has a more profound impact on the market and has directly triggered a valuation correction of core U.S. assets. Analyst George Pikes of Bespoke Investment Group pointed out that Alphabet, Google's parent company, completed a nearly $85 billion equity issuance last week to boost AI business, marking its first net issuance in 11 years.
Coincidentally, tech giant Meta is also planning an equivalent fundraising scheme to aggressively push AI deployment. Massive equity financing continues to drain market liquidity, causing a clear capital migration effect. Since SpaceX filed for an IPO, the combined market value of the seven major U.S. tech giants (commonly known as the "Seven Sisters") has evaporated over $1 trillion.
Market capital flow is clear: investors are selling high-flying tech stocks to raise funds for new stock subscriptions. Jordan Sturart, Managing Director of Federated Hermes Asset Management, said that everyone is chasing the next "Seven Sisters," and funds are mainly flowing out of these giants.
An international investment bank's head of equity capital markets said, "Undoubtedly, these massive IPOs will withdraw huge liquidity from the market. Such large-scale listings are unprecedented, involving enormous amounts of capital."
Reports indicate that some fund managers warn that historical experience shows that intense fundraising often occurs at market tops: insiders tend to sell at high valuations for cash, and the influx of new stocks can overwhelm the market.
Richard Bernstein, Chief Investment Officer of Bernstein Advisors, said, "The record scale of new stock issuance in the U.S. is a classic sign of a market bubble. Even after adjusting for inflation, the total fundraising of these three giant IPOs far exceeds the total during the internet bubble of 1999-2000."
Buffett Indicator at "Obvious Overvaluation" Besides the supply-demand reversal, the overall valuation of U.S. stocks also signals red lights. The Buffett Indicator, regarded by Buffett as "the best single measure of market valuation," has recently hit a new all-time high, fully exposing market overvaluation risks.
According to the latest data from GuruFocus, the Buffett Indicator is currently about 232.5%, up sharply by 13% from the low on March 30. Since GuruFocus started recording this indicator in 1970, it has never reached such a high level. At the current level, the indicator is in the "obvious overvaluation" zone.
Public information shows that the Buffett Indicator is the ratio of the total market capitalization of U.S. stocks (Wilshire 5000 Index) to the U.S. annual GDP, and is a globally recognized core measure of stock market overheating. The indicator gained fame after Warren Buffett and long-time Fortune magazine contributor Carol Loomis published an article in Fortune in 2001.
Generally, if the Buffett Indicator is below 50%, it indicates the stock market is severely undervalued; between 75% and 90% suggests a reasonable valuation; over 115% indicates severe overvaluation. Buffett once said in 2001, "When this ratio is between 70% and 80%, buying stocks is likely to bring good returns. If it approaches 200%, like in 1999 and some periods in 2000, you're playing with fire."