


#GateRanksNo2In24HourNetInflows
$57.97 Million in 24 Hours: What Second Place in Net Inflows Really Signals
Approximately $57.97 million in net capital inflow over a 24-hour window placed a leading centralized exchange second globally among CEXs. The reading is based on tracked on-chain wallet flows, a metric distinct from trading volume. It measures fresh capital entering the platform, not just turnover.
This is not an isolated print. Recent snapshots show consistent strength:
• October 23: ∼$184 million in 24-hour net inflow, ranking third globally • October 20: ∼$199 million+ over 30 days, ranking second globally • October 22: ∼$444 million over 30 days, ranking second globally • Latest reading: >$50.17 million in 24 hours, ranking second globally
A pattern of recurring top-two placement on DefiLlama data indicates structural inflow, not a one-off spike.
Why Net Inflow Matters More Than Volume
Trading volume can be inflated. Net inflow cannot. It represents users moving assets onto the platform with intent to hold or trade. When net inflow ranks second globally, it signals three things professional traders watch:
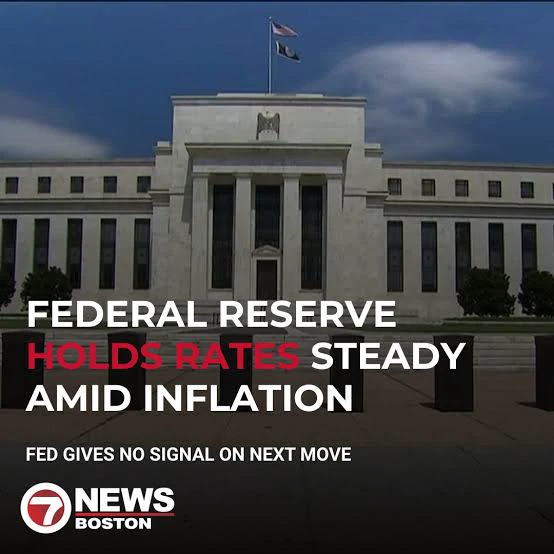
1. Trust and Custody Preference: In a period where Fed policy remains at 3.75%-4.00% with a 10-2 hawkish hold and BTC is consolidating around $80k after $356 million in long liquidations, users move funds to venues they trust for execution depth and risk management.
2. Pre-Positioning for Volatility: Net inflows often lead trading activity by 24-48 hours. Fresh capital on platform typically precedes higher spot and derivatives turnover. The exchange previously logged $1.6 billion in spot volume in a single day, ranking second globally, right after strong inflow prints.
3. Ecosystem Stickiness: Sustained 7-day and 30-day inflow rankings ( $147M, $199M, $444M ) show users are not just arbitraging. They stay. That creates deeper order books and lower slippage, which in turn attracts more inflow - a reflexive loop.
Can Sustained Inflows Boost Trading Activity?
Yes, but with a condition. Inflow is potential energy. Volume is kinetic energy. Conversion depends on market catalyst.
If PCE data and December hike expectations (currently 80-86% priced) drive volatility, that $57.97M becomes active trading fuel. If market stays range-bound between $79.6k - $81.7k, inflow will sit as idle balance, boosting reserves but not turnover.
For traders, the key metric to track next is inflow-to-volume conversion rate. When net inflow ranking stays top-two and spot volume also climbs to top-two, it confirms that new capital is trading, not just parking. That is the bullish confirmation for market depth.
In current market structure, second place in net inflows is a leading indicator of market share. It shows where liquidity wants to go before it trades.
#GateRanksNo2In24HourNetInflows
#ShareWeekly
#GateSquareHalloween