


💰 $XLM SWING TRADING SETUP
🔼 LONG
✳️ ENTRY: 0.2000 – 0.1930 – 0.1890
🎯 TARGETS: 0.2100, 0.22200, 0.2500, 0.300, 0.3600, 0.4200, 0.5000
🀄️ LEVERAGE: 10x
🔴 STOPLOSS: 0.1840
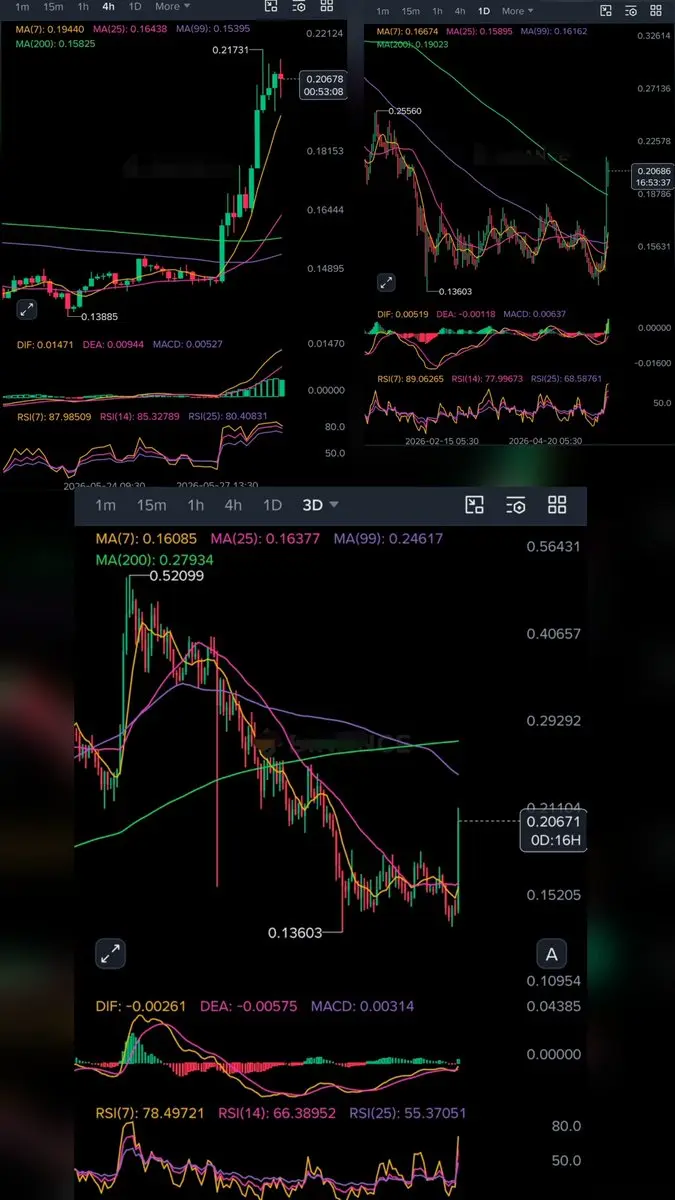
#XLM is finally showing signs of life after spending months in a broad accumulation range. The recent breakout candle pushed price above MA25 and MA99 while momentum indicators exploded higher. MACD has completed a bullish crossover with expanding histogram bars, while RSI has entered strong momentum territory, confirming aggressive buying pressure.
The most important level remains the 0.2200 resistance zone. A clean breakout and sustained close above this area would confirm the next bullish expansion phase. Until then, this move should be treated as an early recovery rather than a fully confirmed trend reversal.
On the higher timeframe, price is attempting to reclaim major moving averages after a long corrective period. This is often the stage where strong trend reversals begin, but healthy consolidation is still required. Ideally, bulls should hold the 0.1900–0.2000 region and build support before attempting another push higher.
⚠️ Patience is important here. Chasing green candles after a vertical move can increase risk significantly. The preferred approach is accumulating through the planned entry zone and allowing the market to confirm strength.
A healthy consolidation above 0.1900 followed by a breakout above 0.2200 would significantly strengthen the bullish case and open the path toward higher targets.
As long as price remains above the key support area and momentum indicators continue to hold positive structure, the probability favors continuation toward the upside. Manage risk carefully, scale entries through DCA, and consider protecting capital by moving stoploss to breakeven once early targets are secured. 🚀
🔼 LONG
✳️ ENTRY: 0.2000 – 0.1930 – 0.1890
🎯 TARGETS: 0.2100, 0.22200, 0.2500, 0.300, 0.3600, 0.4200, 0.5000
🀄️ LEVERAGE: 10x
🔴 STOPLOSS: 0.1840
#XLM is finally showing signs of life after spending months in a broad accumulation range. The recent breakout candle pushed price above MA25 and MA99 while momentum indicators exploded higher. MACD has completed a bullish crossover with expanding histogram bars, while RSI has entered strong momentum territory, confirming aggressive buying pressure.
The most important level remains the 0.2200 resistance zone. A clean breakout and sustained close above this area would confirm the next bullish expansion phase. Until then, this move should be treated as an early recovery rather than a fully confirmed trend reversal.
On the higher timeframe, price is attempting to reclaim major moving averages after a long corrective period. This is often the stage where strong trend reversals begin, but healthy consolidation is still required. Ideally, bulls should hold the 0.1900–0.2000 region and build support before attempting another push higher.
⚠️ Patience is important here. Chasing green candles after a vertical move can increase risk significantly. The preferred approach is accumulating through the planned entry zone and allowing the market to confirm strength.
A healthy consolidation above 0.1900 followed by a breakout above 0.2200 would significantly strengthen the bullish case and open the path toward higher targets.
As long as price remains above the key support area and momentum indicators continue to hold positive structure, the probability favors continuation toward the upside. Manage risk carefully, scale entries through DCA, and consider protecting capital by moving stoploss to breakeven once early targets are secured. 🚀