emilyvuong

vip
Age 4.8 Year
Peak Tier 1
No content yet
🔥Strategy raises an additional $467M, third consecutive week without buying Bitcoin
An 8-K filing on 13/07 confirmed that Strategy continues to stay out of the BTC market, focusing all efforts on strengthening its cash reserve fund:
- Sold 4.8M MSTR shares via the ATM channel in the week of 06–12/07, netting $466.7M — all deployed into the USD Reserve, lifting the fund from $2.55B to $3B (+18% in just 1 week)
- Did not buy more BTC for the third consecutive week. The most recent purchase was on 22/06 with only 520 BTC (~$35M)
- The $3B fund is currently sufficient to cover 20.4 months of pre
MSTR0.89%
BTC2.19%
View Original
post-image
  • Reward
  • Comment
  • Repost
  • Share
🔥Short-term holders are willing to let go with $BTC : 32.8K BTC pushed to exchanges at a loss
🔴In just the past 24 hours, the short-term holder group (STH — holding $BTC <155 days) transferred 32,800 BTC to trading exchanges at a loss, equivalent to about $2B based on the current price. This is the largest stop-loss event in the last 2 weeks (previously, ~50K BTC was sold at a loss when BTC broke below the $60K range).
🔴The average cost basis of the STH group is ~$69K , while the LTH group’s is still around ~$49.7K and has not yet been threatened.
🔴What’s important is that this sell-
BTC2.19%
View Original
  • Reward
  • Comment
  • Repost
  • Share
🔥U.S. CPI in June beats expectations unexpectedly well
🔴BLS has just released June inflation data, which is so good for the market it’s almost unbelievable:
- Headline falls 0.4% MoM (forecast -0.2%), bringing annual inflation back to 3.5% from 4.2% in May—the sharpest month-over-month decline since April 2020
- Core CPI is flat at 0.0% MoM (forecast +0.2%), taking the 12-month increase to 2.6% from 2.9%
- Energy tumbles 5.7% during the month; gasoline falls 9.7% after crude oil drops more than 20% thanks to the U.S.-Iran ceasefire order on 17/6
- Especially, Shelter rises only 0.1%, food +0
View Original
post-image
  • Reward
  • Comment
  • Repost
  • Share
🔥Korea’s stock market goes through a “black Monday,” with KOSPI shedding nearly 9%
KOSPI fell 669 points (-8.95%) to 6,806.93, wiping out ~$310B of market capitalization. South Korea’s stock market triggered the trading halt mechanism for the 7th time this year—in the history of KOSPI, it has only been triggered a total of 13 times.
Focus on SK Hynix
- Down 15.37%—its worst session in 17 years—losing ~$200B in value, and down 38% from the peak on 25/06
- The plunge came just 3 days after its ADR debuted on Nasdaq, raising $26.5B—the largest-ever U.S. IPO by a non-U.S. company.
-> The price
SKHY-10.11%
SKHYV-0.98%
View Original
post-image
  • Reward
  • Comment
  • Repost
  • Share
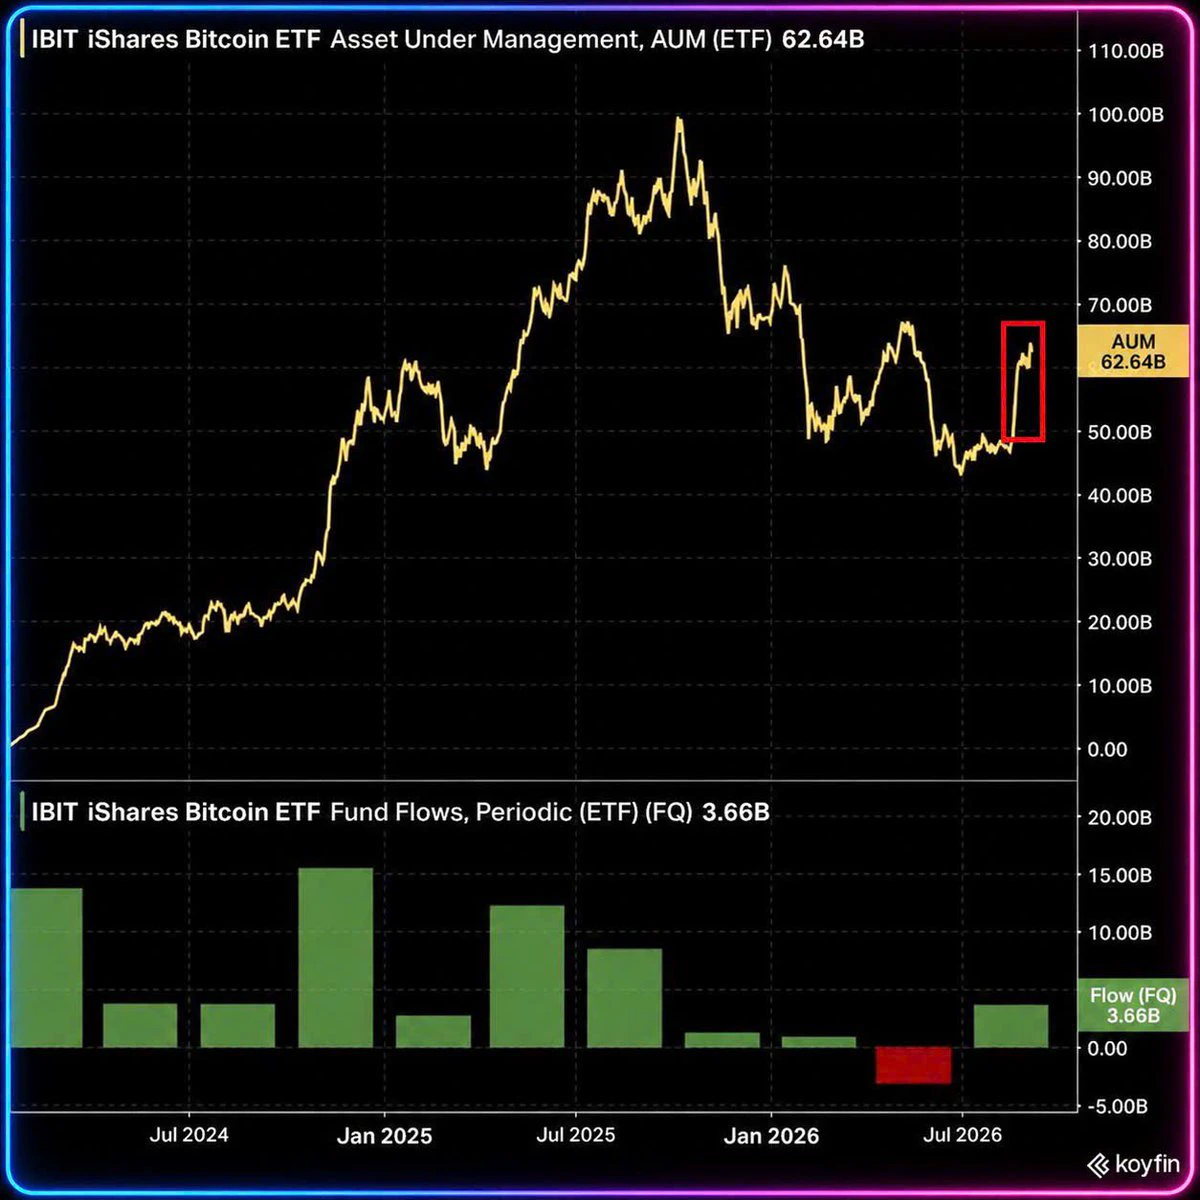
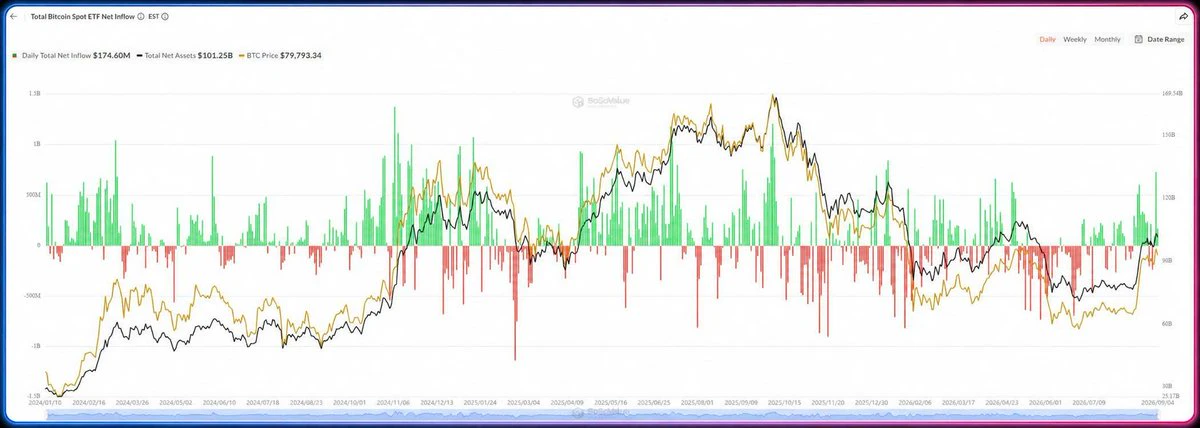
🔥Bitcoin and Ethereum ETF inflows return after 8 weeks: Has the bottom come close?
For the week ending 10/07, spot ETF flows in the US officially turned positive again after a streak of long, record-breaking capital outflows:
- BTC ETF: +$197.4M — first positive week since early May, ending an 8-week consecutive negative streak (the longest since launch)
- ETH ETF: +$84.4M — also ends an 8-week outflow streak
-> Total net assets rebound: BTC ETF up to $77.42B, ETH ETF up to $9.59B as Fed Warsh signals that inflation risks are cooling, alongside a weaker jobs report that reinforces expectation
BTC1.29%
ETH2.88%
View Original
post-image
  • Reward
  • Comment
  • Repost
  • Share
🔥Top 10 US stocks now account for 43% of the S&P 500
The current top 10 largest companies account for 43% of the S&P 500’s market cap, near the all-time high. This figure has stayed above 40% for the past 12 months.
A decade ago, this share was only about 18–20%, meaning it has doubled within just 1 decade. By contrast, the smallest 250 companies in the index now account for only ~7% of market cap, the lowest since at least 2014, down by half versus 10 years ago.
-> The top 10 are valued at more than 6 times the total of the smallest 250 companies combined. At the peak of the dot-com bubble i
SPX500-0.01%
View Original
post-image
  • Reward
  • Comment
  • Repost
  • Share
🔥Bitcoin breaks a record as it trades at a level far below gold: The signal that previously marked the start of a 660% surge in $BTC
the BTC/Gold ratio has just hit the deepest oversold level in history:
- The BTC/Gold oscillator is at -1.81 standard deviations from its long-term trend—lower than the 4-year average (-1.42), and the deepest since 2010.
- 1 BTC currently buys only ~15.9 oz of gold, versus more than 30 oz at the start of 2025 and a long-term average of ~63 oz.
-> The double cause is that BTC is down ~32% since the start of the year (with June alone down 20%—the worst in 4 years)
BTC2.19%
View Original
  • Reward
  • Comment
  • Repost
  • Share
🔥Is the Fed doing “stealth QE”?
The Fed’s balance sheet has risen again:
- The latest peak ~$6.74T at the end of June — the highest since April 2025, up ~$200B (+3.1%) from the trough ~$6.53T at the beginning of December 2025
- Before that was 3.5 years of QT: From the peak ~$8.97T (04/2022) down to $6.53T, withdrawing ~$2.4T from the system
-> Official QT ended on 01/12/2025. From 12/12/2025, the Fed began buying T-bills via the “Reserve Management Purchases” (RMP) program, starting at $40B/month. The reason is that in Q4/2025 the repo market was under strain, the SRF was withdrawn sharply
View Original
  • Reward
  • Comment
  • Repost
  • Share
🔥BTC and the July effect: Price-up history supports it
July is one of the best months for BTC, with average returns of ~7.5-8%, a median of ~8%, and green closes in 11/15 of the most recent years
In particular, July stays green even in bear markets: +21% in 2018, +17.7% in 2022—both after very red June months
The 2026 scenario is repeating that structure: June fell 20.5% (the worst month of the year), BTC formed a bear-market bottom at $57.7K at the end of June, then rebounded ~11% to the $63-64K zone.
If it repeats the 17-21% gain from 2018/2022 from the current level, BTC would return to $7
BTC2.19%
View Original
post-image
  • Reward
  • Comment
  • Repost
  • Share
🔥Gauntlet: Risk governance infrastructure for on-chain finance
DeFi has built lending markets, stablecoins, and tokenized assets. But for institutional capital flows to operate on blockchain, the market still needs an important layer of infrastructure: risk governance.
Gauntlet was founded in 2018 and specializes in developing quantitative models, simulation tools, and self-custody vault systems. On 9/7/2026, the company announced it had completed a $125M Series C round led by SBI Holdings.
🔴How does Gauntlet operate?
Gauntlet uses on-chain data to assess liquidity, price volatility, the qu
COMP0.47%
UNI-1.38%
MORPHO3.21%
KMNO-1.24%
DRIFT0.26%
View Original
post-image
  • Reward
  • Comment
  • Repost
  • Share
🔥Fed Williams: Committed to bringing inflation back to 2%, energy prices have peaked
Statements by New York Fed Chair Williams:
- Not expecting energy prices to rise for the rest of the year, even if Middle East conflict flares up again. “The market still expects oil prices to fall over the next 6-12 months; that is a reasonable baseline scenario. Energy prices are likely around their peak and will cool over time”
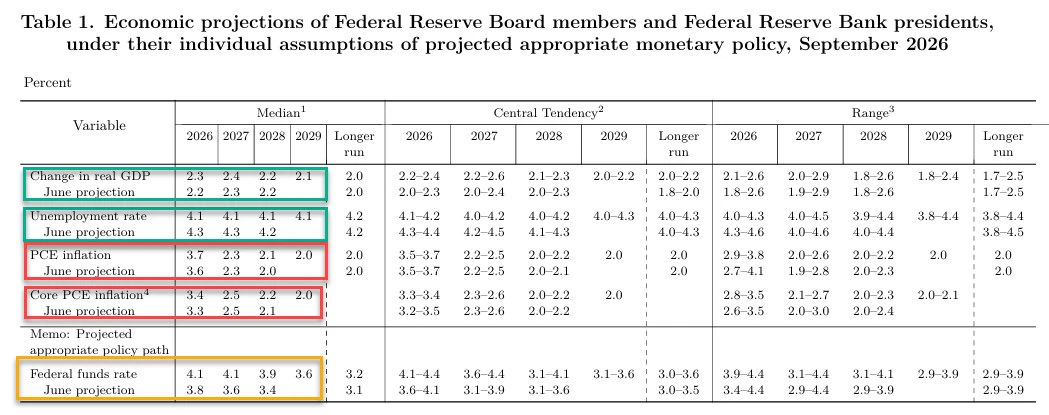
- Stressed that inflation is still “too high”; the Fed focuses on the risk of keeping prices stable. May PCE: 4.1%, core PCE: 3.4% — far above the 2% target
- The Fed is closely mon
View Original
post-image
  • Reward
  • Comment
  • Repost
  • Share
🔥Robinhood Chain: A Wall Street-style craze explodes just 1 week after mainnet
🔴The chain went live on 01/07 and is designed for tokenized stocks and RWA. After 1 week, the most viral thing is the memecoin $CASHCAT.
New data on-chain:
- DEX volume 24h: ~$483–563M, nearly 1/3 of Solana ($1.83B)
- 193K active addresses/day, nearly 200K accumulated wallets
- TVL: ~$234M
- After CEO Vlad Tenev’s tweet “this chain runs memes too, and it’s great,” volume jumped from $32M to $433M —up 1,200% in 24h
🔴However, we need to see the truth clearly:
- The biggest inflow is not memes, but Ethena depositin
HOOD-0.52%
RWA0.17%
MEME-0.47%
SOL1.41%
ENA0.41%
View Original
  • Reward
  • Comment
  • Repost
  • Share
🔥BNB Chain's new Layer 1: Expanding the ecosystem or competing with itself?
🔴BNB Chain has just announced its H2/2026 roadmap, focusing on a brand new layer-1 for high-frequency AI Agent transactions. Testnet end of 2026, mainnet early 2027.
🔴Target specifications:
- Over 100,000 TPS via parallel execution, with a long-term target of 1 million TPS
- Pre-confirmation under 50ms, finality under 1 second
- TxStream: remove public mempool, block MEV and front-running from the root
- PriorityLane: dedicated bandwidth for oracles, bridges, liquidations
🔴Will the new chain drain liquidity from BS
BNB0.08%
SOL1.41%
View Original
post-image
  • Reward
  • Comment
  • 1
  • Share
🔥Retail is buying the dip more aggressively than ever before
The net stock purchases by U.S. retail investors during S&P 500 down sessions have reached a record 3.5 times the daily average since 2020. This figure is 56% higher than the peak of the meme stock frenzy in 2021
Since the beginning of the year, the volume of purchases during down sessions is 2.3 times that of up sessions. Even during up sessions, retail still buys nearly 1.5 times the average - double that of 2025
This is the 7th consecutive year that retail has bought more during down sessions than up sessions. The "buy the dip" m
View Original
  • Reward
  • Comment
  • Repost
  • Share
🔥Big Tech's AI CapEx is about to surpass US defense spending
AI CapEx of Alphabet, Amazon, Meta, Microsoft, and Oracle is expected to reach 2.5% of US GDP in 2026, up from 1.5% in 2025.
By 2027, this figure is expected to rise to 3.2% of US GDP - surpassing US defense spending (~2.7% of GDP) for the first time in history.
5 tech CEOs are deciding to allocate capital for AI infrastructure on a scale larger than the national defense budget - a sign that the AI race has moved beyond the ordinary "corporate spending" category, becoming a factor shaping the structure of US GDP.
AMZN2.63%
META1.51%
MSFT2.46%
ORCL2.41%
View Original
post-image
  • Reward
  • Comment
  • Repost
  • Share
🇻🇳Vietnam launches AI model V-LLM: Leading in political analysis, topping V-Bench ranking
On July 6, VinUni announced V-Bench - a benchmark set evaluating Vietnamese language capability of LLMs, built on over 40,000 questions. Initial results with 15 models:
- V-LLM v1 (Vingroup): 68.00 points - ranked first
- Gemini-2.5-Flash (Google): 58.80
- Qwen3-235B Thinking (Alibaba): 58.23
Vietnam officially has a name on the LLM map. Detailed scorecard
- Basic Politics: 99.7 - near perfect, highest in the table
- Logic: 32.9 - lowest in the top 7.
The model is nearly perfect in textbook knowledge, b
View Original
  • Reward
  • Comment
  • Repost
  • Share
🇻🇳Vietnam joins the AI model race: V-LLM launches, tops V-Bench ranking
On July 6, VinUni announced V-Bench - a benchmark set to evaluate the Vietnamese language capabilities of LLMs, built on over 40,000 questions. Initial results with 15 models:
- V-LLM v1 (Vingroup): 68.00 points - ranked first
- Gemini-2.5-Flash (Google): 58.80
- Qwen3-235B Thinking (Alibaba): 58.23
Vietnam officially has a name on the LLM map. Detailed score card
- Basic Politics: 99.7 - near perfect, highest in the table
- Logic: 32.9 - lowest in the top 7.
The model is nearly perfect on curriculum content, but reasoni
View Original
post-image
  • Reward
  • Comment
  • Repost
  • Share
🔥Lean Ethereum - Vitalik has truly gotten serious about reviving $ETH
Vitalik announces the 'Lean Ethereum' roadmap update - a fan calls it the third biggest 'protocol overhaul' in Ethereum history, after only The Merge.
🔴Three core changes:
- Verification switches to recursive STARKs instead of direct re-execution, becoming an official core component of the protocol - while all parts vulnerable to quantum computers will be replaced with post-quantum secure solutions. The priority for quantum security has increased sharply; quantum-safe blob design becomes an urgent item.
- State structure i
ETH2.99%
SOL1.41%
View Original
post-image
  • Reward
  • Comment
  • Repost
  • Share
🔥US stock market capitalization reached a record $81T, accounting for 48% of global total capitalization ($167T)
For comparison, this figure:
- 4.8 times larger than China (the second largest market, $17T)
- Larger than the next 18 markets combined
- The Mag7 group alone has a market cap ($22T) exceeding the entire Chinese market
The US economy accounts for only ~26% of global GDP but holds 48% of world stock market capitalization - this gap reflects that global capital is overly concentrated in a small group of tech stocks, creating concentration risk for international investment funds that
View Original
  • Reward
  • Comment
  • Repost
  • Share
🔥Foreign capital inflows into U.S. stocks hit an unprecedented pace in 24 years
Inflows from global investment funds into U.S. stocks since the start of 2026 have reached approximately 2.5% of total assets under management (AUM)—an abnormally high level compared to history.
This figure has more than doubled since the end of May, when the inflow rate was only around 1-1.2% of AUM. The acceleration has been pronounced since mid-June—the 2026 inflow curve nearly vertical during this period, diverging sharply from the relatively steady upward trajectory seen earlier.
If we exclude the 10% of year
View Original
  • Reward
  • Comment
  • Repost
  • Share
  • Pinned