Futures
Access hundreds of perpetual contracts
TradFi
Gold
One platform for global traditional assets
Options
Hot
Trade European-style vanilla options
Unified Account
Maximize your capital efficiency
Demo Trading
Introduction to Futures Trading
Learn the basics of futures trading
Futures Events
Join events to earn rewards
Demo Trading
Use virtual funds to practice risk-free trading
Launch
CandyDrop
Collect candies to earn airdrops
Launchpool
Quick staking, earn potential new tokens
HODLer Airdrop
Hold GT and get massive airdrops for free
Pre-IPOs
Unlock full access to global stock IPOs
Alpha Points
Trade on-chain assets and earn airdrops
Futures Points
Earn futures points and claim airdrop rewards
Promotions
AI
Gate AI
Your all-in-one conversational AI partner
Gate AI Bot
Use Gate AI directly in your social App
GateClaw
Gate Blue Lobster, ready to go
Gate for AI Agent
AI infrastructure, Gate MCP, Skills, and CLI
Gate Skills Hub
10K+ Skills
From office tasks to trading, the all-in-one skill hub makes AI even more useful.
GateRouter
Smartly choose from 30+ AI models, with 0% extra fees
RAVE confirms a high-level sideways rally signal! Clear resistance above 0.95, a short-term pullback structure is forming.
Current Price: 0.94912
First, the conclusion: RAVE has entered a high-level consolidation and weakening phase after a continuous rally, with short-term momentum clearly diminishing. Intraday, it is more inclined towards “sharp rise followed by pullback + oscillating downward structure,” but it still operates within a high-volatility range.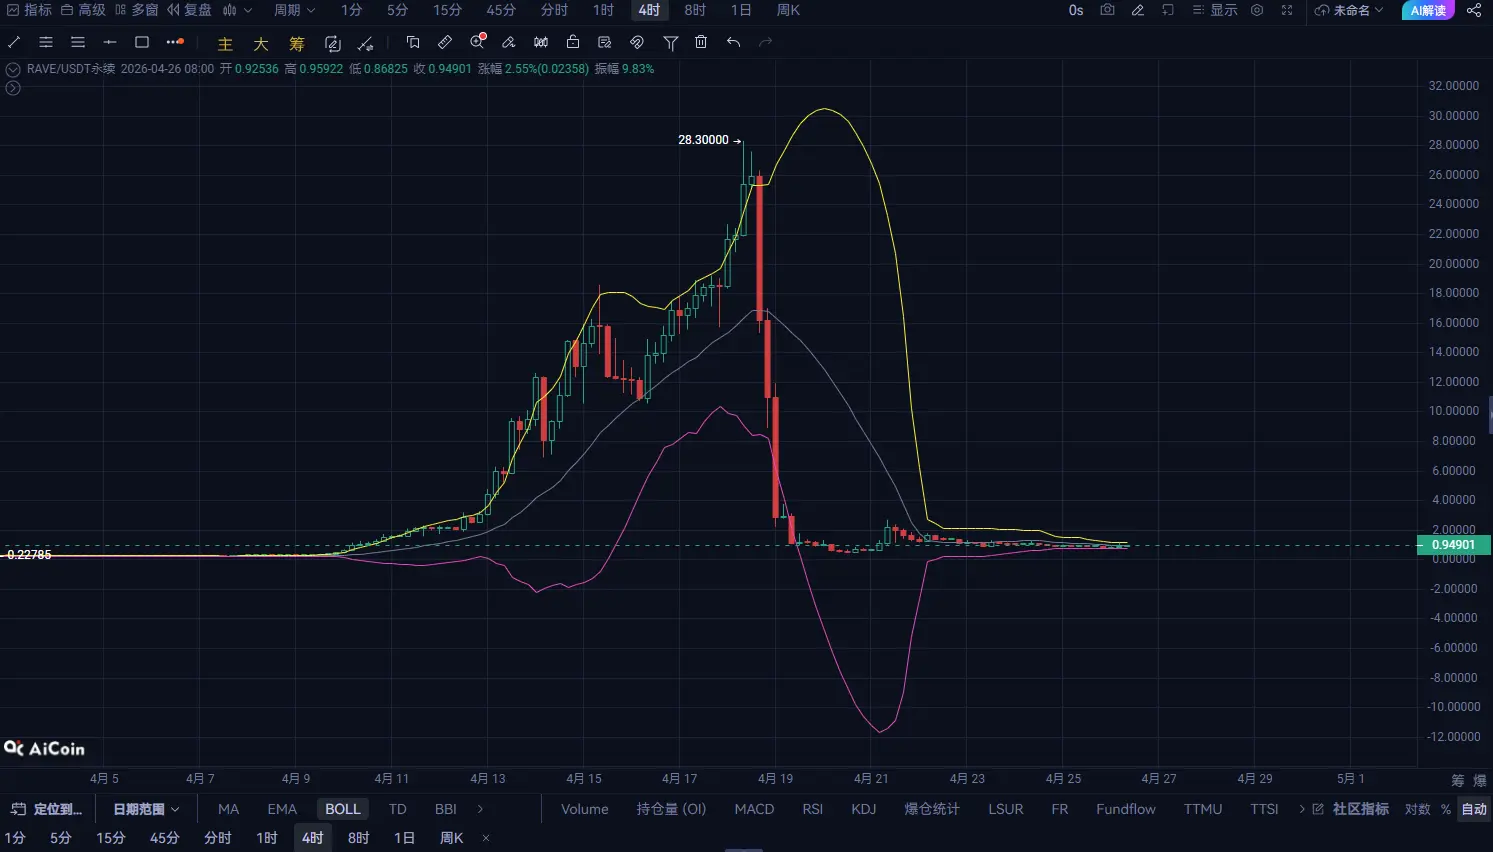
Rapid upward movement earlier failed to sustain increased volume High-level continuous oscillation, showing signs of stagnation MACD at high levels becoming dull, momentum beginning to contract Bollinger Bands expanding then flattening, entering consolidation
Core judgment: The 4-hour chart is in a divergence consolidation phase after an upward move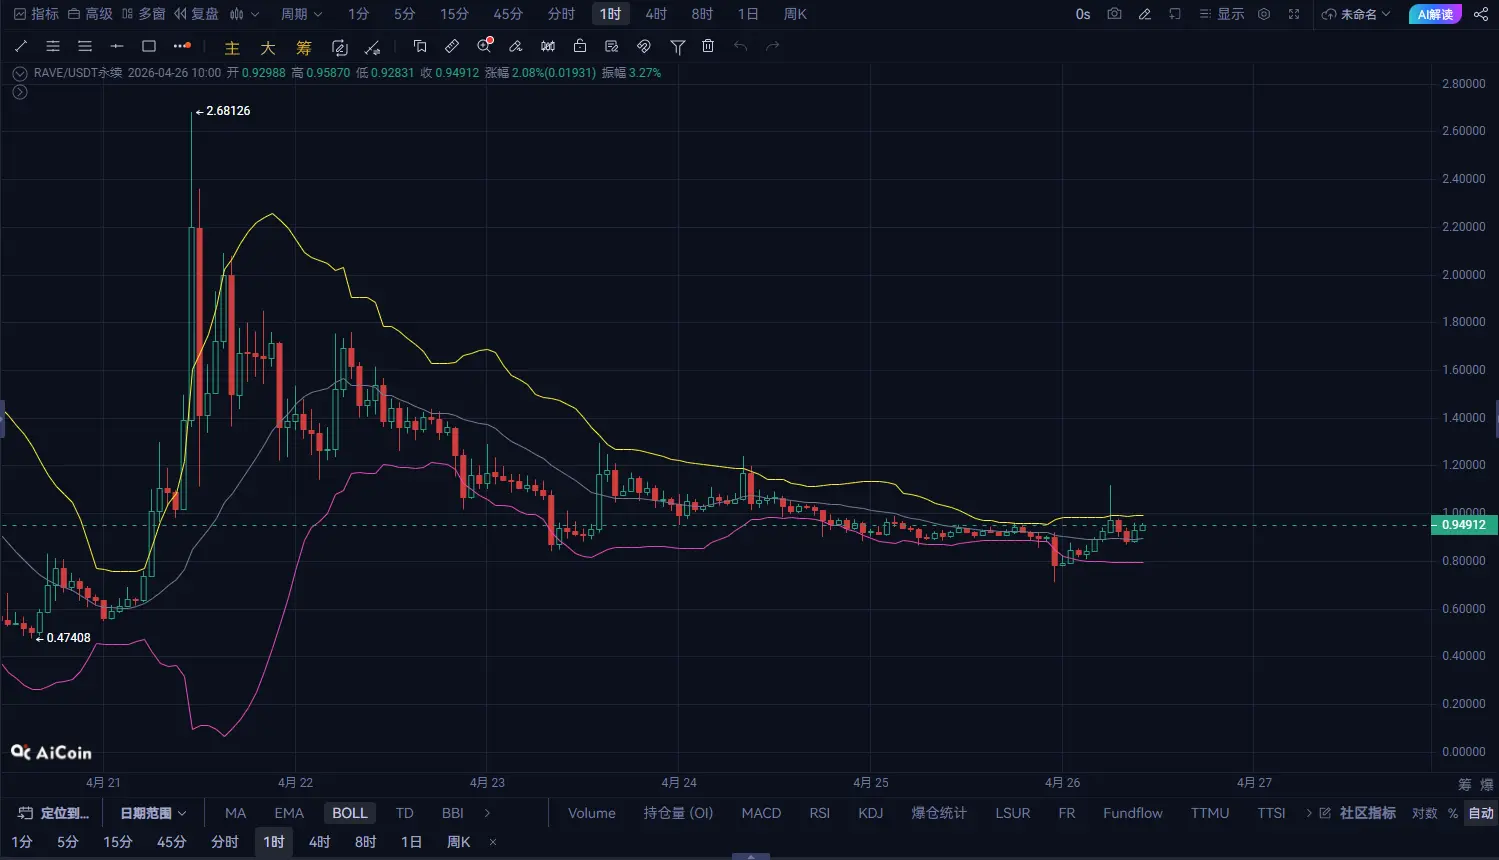
Multiple failed attempts to break through the 0.96-0.98 zone Upward momentum significantly weakened, turning into sideways oscillation Moving averages flattening and slightly turning MACD bearish momentum beginning to dominate
Short-term rhythm: Rise → Sideways → Increased expectation of pullback
If unable to regain stability above the 0.96-0.98 range:
More inclined towards oscillating pullback intraday First support around 0.93 If broken, may extend further toward 0.91
Direction: Short (market order to open position)
Entry price: around 0.94912
Take profit:
First take profit: 0.93963 (about -1%) Second take profit: 0.93014 (about -2%)
Stop loss:
Stop loss level: 0.96335 (about +1.5%)
If the price breaks through strongly and stabilizes above 0.97 → bearish logic invalidated If it falls below 0.93 → pullback may accelerate