🔥 Gate Hot Chat|Event Contract Order Posting & Sharing Is Now Open!
In the next 5 minutes, do you think BTC will go up or down?
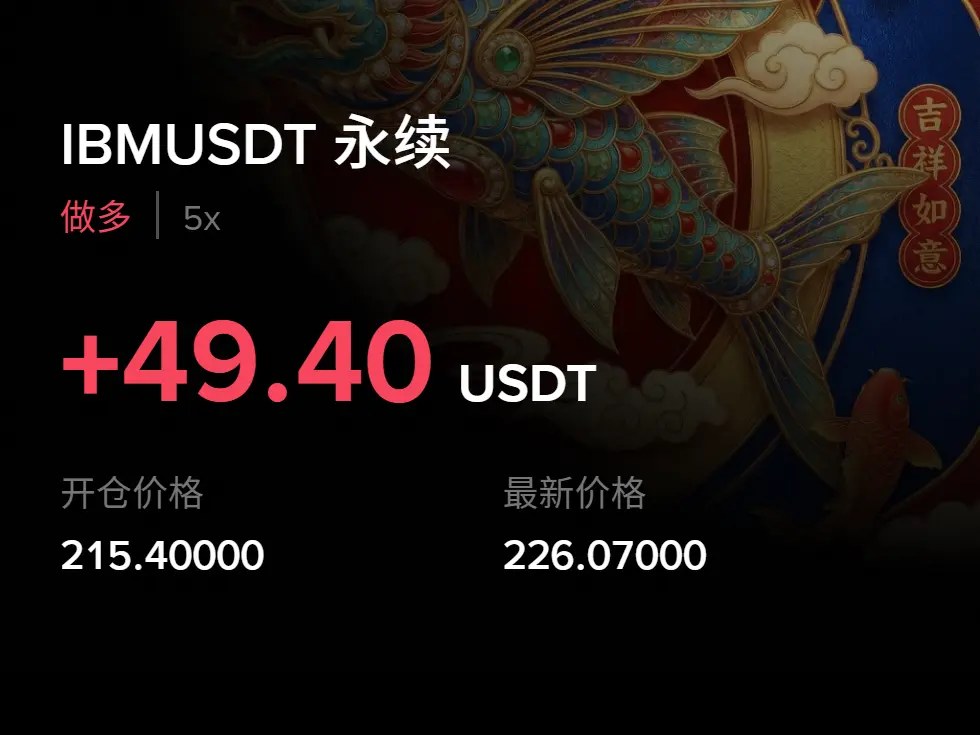
During the event, complete any single Gate event contract trade and share your order screenshot or trading card in the Gate prediction market hot chat group to be eligible for a daily raffle.
🎁 Daily draws for 10 users
Each user receives a 50 USDT BTC contract position experience voucher
How to participate:
1️⃣ Complete an event contract trade
2️⃣ Share your order screenshot or trading card in the group
Gate event contract official first-order protection (compensated for losses), profit doubled, and a trading sprint campaign are also running simultaneously—community rewards can be additionally claimed.
📢 Gate event contract launch frenzy contest:
https://www.gate.com/zh/announcements/article/100750 📢 Join Gate Hot Chat now:
https://gate.onelink.me/Hls0/group?chatroom=mOLmaY4TpB