Luna_Star

vip
Active for: 1.7y
Peak Tier 5
No content yet
#SECApprovesLimitedOnChainTradingOfTokenizedStocks
Wall Street is moving another step onto the blockchain.
The U.S. Securities and Exchange Commission has approved a temporary, conditional Innovation Exemption allowing certain Tokenized Securities Venues to facilitate limited on-chain trading of tokenized U.S. stocks. The order was issued on September 17, 2026.
The framework is designed for selected National Market System stocks and allows qualifying venues to use permissioned automated market makers and liquidity pools for trading.
This is an important development because it brings blockchai
#GateTrenchesExclusive0GasTrading
Zero-gas trading is bringing a new dimension to on-chain trading as Gate expands its Trenches ecosystem with an exclusive 0-gas trading experience.
For traders exploring emerging tokens and fast-moving on-chain opportunities, transaction costs can become an important part of the overall trading experience. By removing gas fees within the eligible Trenches trading environment, Gate is addressing one of the friction points that can affect frequent on-chain transactions.
The idea behind Trenches is closely connected to the rapidly changing world of on-chain mark
#GateSquareMidAutumnReunion
Mid-Autumn is a season of reunion, and this year Gate Square is bringing that spirit into the crypto community through its Mid-Autumn Creation Season.
The campaign combines creativity, market discussion, community participation, and rewards, giving Gate Square creators a chance to turn their ideas into original content while celebrating the festival together.
With more than 15,000 USDT in total rewards, the campaign offers multiple ways for participants to get involved. The focus is not only on trading content, but also on sharing perspectives and creating conversa
  • 1
#USHouseAdvancesBitcoinReserveBill
A major Bitcoin policy development is moving through Washington as the U.S. House Financial Services Committee advances the American Reserve Modernization Act of 2026, H.R. 8957.
The committee approved the bill by a 28–21 vote on September 16, moving the legislation forward for consideration by the full House.
The proposed legislation would establish a Strategic Bitcoin Reserve within the U.S. Treasury, alongside a separate Digital Asset Stockpile for other federally held digital assets acquired through criminal or civil forfeiture.
One of the central provis
BTC0.00%
  • 1
#ZECKeepsRisingBreaking1500
Zcash is back in price discovery as ZEC breaks above the $1,500 level and reaches a new all-time high around $1,535, putting the privacy-focused asset at the center of market attention.
The move is especially notable because ZEC has climbed rapidly through several major psychological levels in September. Breaking $1,500 represents another major milestone after the token pushed through $1,000 and then accelerated toward four-digit territory.
Market structure has also become increasingly active. ZEC open interest reached approximately $3.47 billion, while around $26.
ZEC+0.36%
  • 1
#BOJHikesTo1.25%31YearHigh
The Bank of Japan has taken another major step in its monetary-policy normalization, raising its benchmark interest rate to 1.25%, marking the highest policy rate in more than three decades.
The September decision represents another significant shift for Japan after years of exceptionally loose monetary policy. The BOJ raised its short-term policy rate from 1.00% to 1.25%, with the decision reflecting continued attention to inflation, wages, economic activity, and financial conditions.
Japan’s monetary-policy transition is closely watched because the country spent a
#GateTopsStockPerpetualCoverage
The boundary between traditional equities and digital-asset trading continues to become thinner as stock perpetual contracts gain more attention across the global trading market.
Gate is expanding its stock perpetual coverage, giving traders access to price movements across a broader range of equity-related markets through a crypto-native trading environment.
Stock perpetuals offer a different way to participate in equity price movements. Unlike traditional stock ownership, perpetual contracts are designed around price exposure and can remain open without a con
#USAIConceptStocksRally
AI-related stocks are back in focus as U.S. markets continue to react to shifting expectations around artificial intelligence spending, infrastructure demand, and the next phase of the technology cycle.
Recent trading has shown that the AI theme is becoming more selective. While some software and cybersecurity names have rallied, chip and infrastructure stocks have also experienced sharp swings as investors assess whether the pace of AI investment can remain strong.
The broader AI ecosystem now extends far beyond semiconductor manufacturers. It includes cloud platforms
NDAQ+2.44%
#JapanRealEstatePowerChipStocksRise
Japan’s equity market is showing strength across two very different but increasingly important themes: real estate and semiconductor-related stocks.
Japanese real estate shares gained attention after official data showed land prices increased for a fifth consecutive year. National land prices rose 1.5% in the year through July 1, while Tokyo metropolitan land prices increased 5.4%. The data supported renewed interest in property developers and related companies.
At the same time, Japan’s technology sector is benefiting from strong demand for AI and semicond
  • 1
#SECApprovesLimitedOnChainTradingOfTokenizedStocks
ONDO/USDT: Institutional RWA Giant at Critical Inflection Point
Current Price: ~$0.3511 (+0.63%)
Timeframe: 4H Chart Analysis
Ondo Finance has quietly become the largest tokenized RWA platform with $3.68B TVL, yet ONDO trades ~84% below its all-time high. Is this a deep-value opportunity or a value trap? Let's analyze.
📊 Technical Setup (4H Chart)
ONDO is trading in a tight range between $0.34 support and $0.36 resistance, with Bollinger Bands squeezing — signaling an imminent breakout. Price sits right at the EMA30 ($0.3539), a key pivot le
Little_Star
#SECApprovesLimitedOnChainTradingOfTokenizedStocks 🚀 ONDO/USDT: Institutional RWA Giant at Critical Inflection Point
Current Price: ~$0.3511 (+0.63%)
Timeframe: 4H Chart Analysis
Ondo Finance has quietly become the largest tokenized RWA platform with $3.68B TVL, yet ONDO trades ~84% below its all-time high. Is this a deep-value opportunity or a value trap? Let's analyze.
📊 Technical Setup (4H Chart)
ONDO is trading in a tight range between $0.34 support and $0.36 resistance, with Bollinger Bands squeezing — signaling an imminent breakout. Price sits right at the EMA30 ($0.3539), a key pivot level. The MACD is flat near zero (DIF: -0.0042, DEA: -0.0047), reflecting indecision. OBV remains suppressed at -119M, suggesting distribution pressure. The recent structure shows lower highs from the $0.4284 peak, but the $0.3000 floor held firmly.
Key Levels:
· Resistance: $0.36 → $0.40 → $0.4284
· Support: $0.34 → $0.3256 → $0.3000
🏛️ Fundamental Catalysts
DTCC Pilot Success: Ondo became the first to launch tokenized stock representations backed by DTCC's DTC Tokenized Entitlements, joining BlackRock, JPMorgan, and Goldman Sachs. Full commercial launch targeted for October 2026.
SBI Group Partnership: Expanded into Japanese asset tokenization with yen-denominated settlements, pushing ONDO up 15% on announcement.
Citi's Onchain Move: Citi's plans for 24/7 tokenized cross-border payments signal growing institutional adoption — exactly the market ONDO is building for.
⚠️ The Bear Case
Massive Token Unlock: ~1.94 billion ONDO (19.4% of supply) unlocks January 18, 2027. The equivalent 2026 unlock dropped price ~10%.
Fee Switch Uncertainty: A pending governance vote could redirect protocol revenue to stakers — if it passes, ONDO transforms from pure governance to yield-bearing.
Team-Linked Selling: Multisig addresses tied to Ondo deposited ~$4.42M to exchanges, with suspicions of ~$29.94M sold over 30 days.
🔮 Scenarios
🟢 Bullish: Break above $0.36 triggers momentum toward $0.40-$0.42. Fee switch approval + DTCC commercial launch could fuel a rally to $0.60-$1.00 by year-end.
🔴 Bearish: Loss of $0.34 support opens door to $0.30 retest. January 2027 unlock overhang could pressure price toward $0.24-$0.30 range.
⚖️ Neutral: Continued consolidation between $0.34-$0.36 until a clear catalyst emerges.
💡 Verdict
ONDO offers rare institutional validation — DTCC, BlackRock, JPMorgan, and SBI Group partnerships don't come easy. The RWA sector's largest platform trading at a fraction of its peak is compelling. But the January 2027 unlock is a real, dateable risk that cannot be ignored. For long-term believers, current levels near $0.35 may offer accumulation zones. For traders, wait for a confirmed breakout above $0.36 with volume.
Disclaimer: Not financial advice. Crypto is highly volatile — always DYOR and manage risk.
$ONDO
#ONDO #RWA #Altcoins #Tokenization
ONDO+7.59%
RWA+0.44%
#GateTrenchesExclusive0GasTrading
Gate Trenches Expands to Arc With Exclusive 0-Gas Trading
Gate is expanding its Web3 trading infrastructure around the newly launched Arc ecosystem, bringing Arc support to Gate Trenches, Gate Wallet and on-chain market data.
The key update is simple but important: Gate Trenches now supports Arc ecosystem assets with an exclusive 0-Gas trading experience, allowing users to explore and trade emerging Arc tokens without paying the usual on-chain gas fee. Gate announced the Arc integration alongside Circle's Arc mainnet launch on September 16, 2026.
For me, the
Jiaa_Insights
#GateTrenchesExclusive0GasTrading
Gate Trenches Expands to Arc With Exclusive 0-Gas Trading
Gate is expanding its Web3 trading infrastructure around the newly launched Arc ecosystem, bringing Arc support to Gate Trenches, Gate Wallet and on-chain market data.
The key update is simple but important: Gate Trenches now supports Arc ecosystem assets with an exclusive 0-Gas trading experience, allowing users to explore and trade emerging Arc tokens without paying the usual on-chain gas fee. Gate announced the Arc integration alongside Circle's Arc mainnet launch on September 16, 2026.
For me, the most interesting part is not just the 0-Gas headline. It is the combination of asset discovery, market tracking and trading inside one flow.
Normally, trading a newly launched ecosystem token can involve several steps: finding the token, setting up a wallet, moving funds, keeping the correct network asset for gas, connecting to a DEX and then executing the transaction.
With Arc support in Gate Trenches, the process is more integrated.
Users can explore Arc assets, check their market information and trade supported tokens through the Trenches interface. Gate also says Arc assets can be accessed through Gate Wallet and Gate Web3, including market and limit trading, Pro Trading and Quick Trading.
WHAT DOES 0 GAS ACTUALLY MEAN?
There is an important distinction here.
0 Gas does NOT mean every cost associated with trading is zero.
The current 0-Gas benefit refers specifically to the applicable on-chain gas cost. Gate's current Arc trading information states that this is separate from the platform trading fee, which is currently offered at a limited-time 0.5% rate for Arc-chain asset trading.
So traders should understand the difference:
0 Gas = no applicable Arc on-chain gas charge under the promotion
Trading fee = separate platform fee
This distinction matters, especially for short-term traders who may make several entries and exits.
WHY THIS MATTERS FOR ARC
Arc is a new blockchain ecosystem, so early asset discovery and liquidity can be extremely important.
New ecosystems often experience rapid token launches, sudden liquidity changes and large price movements. Having a simpler route from discovery to execution can reduce some of the operational friction involved in exploring a new chain.
Gate says Trenches supports discovery and trading of popular and newly issued Arc assets, while Gate Web3 has also integrated major Arc ecosystem protocols including Uniswap V2, V3 and V4 to provide additional liquidity connectivity.
That creates an interesting setup for traders watching early Arc projects.
WHAT I WOULD WATCH
The first thing I would watch is liquidity.
A 0-Gas environment can reduce one part of the trading cost, but it does not eliminate slippage or volatility.
A token with thin liquidity can still move sharply even when gas costs are zero.
The second thing I would watch is volume.
If an Arc token is attracting increasing volume while maintaining reasonable liquidity and tighter execution, that gives a clearer picture of whether activity is developing beyond the initial launch hype.
The third factor is price structure.
I would rather see a token establish support, form a higher low and then reclaim resistance than chase a vertical candle simply because it is trending on the new chain.
ARC ECOSYSTEM VOLATILITY
The timing of this integration is particularly interesting because Arc ecosystem tokens have already experienced significant volatility following the mainnet launch.
ARGUS, LONG and COOL all experienced sharp moves during the initial period of price discovery, demonstrating how quickly liquidity and sentiment can change in a new ecosystem.
That makes risk management even more important.
0 Gas can reduce transaction friction, but it does not reduce market risk.
If a token falls 40%, 50% or 70%, the absence of gas fees does not protect the trading position.
This is why I would separate execution efficiency from investment risk.
TRADING APPROACH
For me, the biggest advantage of the 0-Gas setup is flexibility.
It can make it easier to monitor smaller Arc assets and wait for a better technical setup rather than feeling pressure to enter immediately.
If a token breaks resistance with strong volume, I would watch for a retest.
If support holds after a pullback, I would look for a higher-low structure.
If liquidity suddenly disappears or selling volume accelerates, I would rather reduce exposure or wait for a new base.
I would also avoid all-in entries on newly launched tokens.
A staged approach can be more controlled:
30% on an initial confirmed setup
30% after breakout or retest confirmation
40% kept in reserve
For high-volatility assets, I would keep total account risk around 1–2% where appropriate and define invalidation before entering.
THE BIGGER ARC OPPORTUNITY
Arc is designed around stablecoin-native financial infrastructure, with USDC used as the network's native gas asset.
Gate's integration means users can now access Arc assets through several parts of its Web3 ecosystem rather than relying entirely on separate wallets and external trading interfaces.
Gate Wallet supports Arc asset management, while Gate Web3 provides market data, swaps and trading functionality. Trenches adds a dedicated discovery and trading route for popular and newly issued Arc assets.
This combination could become particularly relevant as the Arc ecosystem expands and more assets launch.
But the next stage is still about adoption.
More tokens alone do not guarantee sustainable liquidity.
The important metrics will be:
Trading volume
Liquidity depth
Number of active users
New applications
Stablecoin activity
Transaction activity
DEX liquidity
Token retention after launch hype
Execution quality
If these metrics continue developing, Arc's ecosystem could become much more active over time.
FINAL TAKEAWAY
#GateTrenchesExclusive0GasTrading is not simply about removing gas costs.
The bigger story is the integration of Arc asset discovery, market data and on-chain trading into Gate's Web3 infrastructure.
The current limited-time 0-Gas benefit can remove one layer of trading friction, while the separate 0.5% trading fee should still be considered when calculating the real cost of a trade.
For me, the key idea is to use the lower execution friction as a tool, not as a reason to overtrade.
New Arc tokens can move extremely quickly, so liquidity, volume, support/resistance and position sizing remain more important than the 0-Gas headline itself.
I would watch how Arc's trading volume and liquidity develop, which new assets gain sustainable activity, and whether the ecosystem can convert its initial launch excitement into longer-term on-chain usage.
#NEARSurgesOver21Breaking3
Why $NEAR is Positioning Itself as the Infrastructure for Chain Abstraction and On Chain AI
While most Layer 1 networks continue to compete purely on raw throughput, $NEAR Protocol is executing on a dual thesis targeting two of the highest potential vectors in Web3: Chain Abstraction and User Owned AI.
Multi Layer Demand: $NEAR serves as the native asset for validator staking, transaction gas, state storage, cross chain execution, and AI agent inference queries.
Fee Burn Mechanics: A percentage of transaction fees generated across the network is burned, aligning
CryptoBigBoss
#NEARSurgesOver21Breaking3
Why $NEAR is Positioning Itself as the Infrastructure for Chain Abstraction and On Chain AI
While most Layer 1 networks continue to compete purely on raw throughput, $NEAR Protocol is executing on a dual thesis targeting two of the highest potential vectors in Web3: Chain Abstraction and User Owned AI.
Multi Layer Demand: $NEAR serves as the native asset for validator staking, transaction gas, state storage, cross chain execution, and AI agent inference queries.
Fee Burn Mechanics: A percentage of transaction fees generated across the network is burned, aligning token value accrual directly with ecosystem activity.
Dynamic Resharding: Automatically adds or merges shards based on network load, ensuring the blockchain scales dynamically as throughput demand grows without increasing hardware requirements for validators.
Sub-Second Finality & Minimal Fees: Near instant settlement and low transaction costs make micro payments and high frequency agent interactions economically viable.
Unified Execution: Users and agents can interact with assets across 35+ networks, including Bitcoin, Solana, Ethereum, and Zcash from a single account without manually managing network RPCs or switching wallets.
NEAR Intents: Allows users to specify a desired financial outcome (e.g., swapping BTC to an EVM asset) while decentralized intent solvers execute the transaction path under the hood.
Private Inference & Confidential Compute: Utilizing hardware, enforced enclaves (such as Intel TDX and NVIDIA GPU TEEs) to keep AI agent execution, prompts, and sensitive user data private.
The Agent Economy: Positioning $NEAR as the settlement layer and execution currency for autonomous AI agents operating across decentralized networks.
$NEAR ‌
repost-content-media
BTC0.00%
SOL-2.45%
ETH-0.25%
ZEC+0.46%
#GateSquareMidAutumnReunion
🎁 15,000 USDT Mid-Autumn Festival gifts continue—today we're talking about the $ARC chain!
New users can claim a red packet worth 100%, up to 5 USDT, plus an exclusive 1,000 USDT prize pool!
👉 Sign up now: https://www.gate.com/campaigns/6260
🔥 Day 3: #ArcEcosystemHotTokensSeeIncreasedVolatility
Post with #Arc生态热门代币波动加剧 + #Gate广场中秋团圆局 , share your views and win rewards!
📢 Today's Hot Topic
Interest in the Arc ecosystem has surged since the Arc mainnet launch, but ecosystem token volatility has intensified. On September 17, ARGUS fell over 40% in 12 hours, LONG
GateSquare
🎁 15,000 USDT Mid-Autumn Festival gifts continue—today we're talking about the $ARC chain!
New users can claim a red packet worth 100%, up to 5 USDT, plus an exclusive 1,000 USDT prize pool!
👉 Sign up now: https://www.gate.com/campaigns/6260
🔥 Day 3: #ArcEcosystemHotTokensSeeIncreasedVolatility
Post with #Arc生态热门代币波动加剧 + #Gate广场中秋团圆局 , share your views and win rewards!
📢 Today's Hot Topic
Interest in the Arc ecosystem has surged since the Arc mainnet launch, but ecosystem token volatility has intensified. On September 17, ARGUS fell over 40% in 12 hours, LONG fell over 70%, and COOL fell over 75%. Can the Arc ecosystem's momentum continue? Will you buy the dip or stay on the sidelines?
Post now: https://www.gate.com/post
Event details: https://www.gate.com/announcements/article/101723
repost-content-media
ARC-9.21%
ARGUS+26.68%
#ZECKeepsRisingBreaking1500
ZEC BREAKS KEY LEVELS
$ZEC is showing powerful momentum after breaking key levels and pushing toward a recent monthly high. The move has attracted strong attention across social media, with ZEC sentiment reaching a monthly peak. The overall market tone remains bullish, but after such a sharp rally, traders should also be prepared for higher volatility and possible profit taking.
KEY PRICE LEVELS
ZEC is trading around 1,585, with 1,588 acting as an important immediate resistance. A clean breakout and hold above this level could keep the bullish structure intact and
Repanzal
#ZECKeepsRisingBreaking1500
ZEC BREAKS KEY LEVELS
$ZEC is showing powerful momentum after breaking key levels and pushing toward a recent monthly high. The move has attracted strong attention across social media, with ZEC sentiment reaching a monthly peak. The overall market tone remains bullish, but after such a sharp rally, traders should also be prepared for higher volatility and possible profit taking.
KEY PRICE LEVELS
ZEC is trading around 1,585, with 1,588 acting as an important immediate resistance. A clean breakout and hold above this level could keep the bullish structure intact and support another move higher.
On the downside, 1,520 is an important support level. Holding above this zone would help maintain the current bullish structure, while a break below it could increase the risk of a deeper correction.
FUNDING AND OPEN INTEREST
Open interest is around 3.27 billion dollars, showing that positioning in the derivatives market is very high.
The market wide long short ratio is 0.45, meaning short positions are clearly dominant. The taker buy sell ratio is around 1.0076, showing a slight buying bias.
Funding is also marginally negative at -0.000586%.
This creates an interesting setup. If ZEC continues moving higher, crowded short positions could be forced to close. Short covering could then create additional buying pressure and accelerate the upside move.
However, high open interest also means volatility can increase quickly in either direction.
MARKET SENTIMENT
The overall market sentiment remains supportive.
The Fear and Greed Index is at 74, showing a strong risk on environment. ZEC social sentiment is around 0.709, indicating a bullish bias.
Trend strength is also visible across multiple timeframes. The 1 hour ADX is 28.62. The 4 hour ADX is 54.05. The daily ADX is 61.32.
These readings indicate that the current trend has meaningful strength across short term and higher timeframes.
OVERBOUGHT RISK
Despite the strong trend, traders should not ignore the possibility of a pullback.
The 4 hour and daily RSI have entered overbought territory, while the 1 hour RSI is around 60.07.
Price is also trading close to the upper Bollinger Band near 1,603.65. This does not necessarily mean the trend will reverse, but it does increase the possibility of short term consolidation or profit taking.
WHALE ACTIVITY
On chain activity is another factor worth monitoring.
A whale recently deposited approximately 15 million dollars worth of ZEC to Coinbase after around 10 months of inactivity. This could represent profit taking, although one transaction alone does not confirm that a major sell off is coming.
Further large exchange inflows would be important to monitor because continued deposits could increase potential selling pressure.
NARRATIVE RISK
There is also some risk around the broader privacy coin narrative. Recent discussions involving KOL promotions and accusations around fake privacy coins have created debate within the community.
These discussions do not directly determine ZEC price, but they can influence short term sentiment and confidence around the privacy coin sector.
KEY LEVELS TO WATCH
Resistance: 1,588
Upper Bollinger Band: 1,603.65
Support: 1,520
The main bullish signal would be a sustained move above 1,588 with strong buying volume. On the other hand, losing 1,520 would weaken the current structure and increase the risk of a deeper pullback.
FINAL VIEW
ZEC remains in a strong bullish structure, supported by strong trend indicators, positive social sentiment and heavily crowded short positions.
At the same time, high open interest, overbought conditions and recent whale activity mean volatility could increase sharply.
The trend is strong, but chasing an already extended move carries higher risk. Position size should be controlled carefully, and traders should watch 1,588 resistance and 1,520 support closely before making decisions.
ZEC+0.36%
#BOJHikesTo1.25%31YearHigh
🔥 BOJ Raises Rates to 1.25%: Japan’s Monetary Policy Enters a New Era
The Bank of Japan has taken another major step away from its decades-long ultra-low-rate environment.
On September 18, the BOJ raised its policy rate by 25 basis points, from 1.00% to 1.25%, bringing rates to their highest level in 31 years. The decision passed by a 7–2 vote, with two policymakers dissenting.
But the headline rate is only part of the story.
The bigger question for markets is how quickly Japan continues normalizing policy — and how that changes the yen, Japanese equities, global l
BeautifulDay
#BOJHikesTo1.25%31YearHigh
🔥 BOJ Raises Rates to 1.25%: Japan’s Monetary Policy Enters a New Era
The Bank of Japan has taken another major step away from its decades-long ultra-low-rate environment.
On September 18, the BOJ raised its policy rate by 25 basis points, from 1.00% to 1.25%, bringing rates to their highest level in 31 years. The decision passed by a 7–2 vote, with two policymakers dissenting.
But the headline rate is only part of the story.
The bigger question for markets is how quickly Japan continues normalizing policy — and how that changes the yen, Japanese equities, global liquidity and risk assets.
Why 1.25% Matters
Japan has spent decades operating with exceptionally low interest rates. Now, inflation, wage growth, currency movements, commodity prices and changing corporate pricing behavior are becoming increasingly important to the BOJ.
Governor Kazuo Ueda has indicated that the central bank remains focused on keeping underlying inflation consistent with its 2% price-stability target, while leaving room for further policy adjustments if economic and price conditions warrant them.
The BOJ has also highlighted several factors that could influence the inflation outlook:
• AI-related demand
• Semiconductor prices
• Yen movements
• Crude-oil prices
• Wage growth
• Corporate pricing behavior
• Global economic conditions
The interesting part is that AI and semiconductor demand can simultaneously support economic activity while contributing to inflationary pressure.
🇯🇵 The Yen Reaction
One of the most interesting market reactions was that the yen weakened rather than strengthened following the rate hike.
USD/JPY remained around the 156–157 area, showing why markets cannot be analyzed simply by looking at the headline decision.
Markets price the expected future path of policy, not just today's rate.
If traders believe future BOJ hikes will remain gradual while U.S. rates stay relatively high, the interest-rate differential can continue supporting USD/JPY.
However, a more aggressive BOJ tightening path or stronger Japanese currency intervention could produce a very different reaction.
For me, USD/JPY remains one of the most important charts to watch after this decision.
📈 Japanese Stocks
The BOJ hike did not automatically trigger a broad Japanese equity selloff.
The Nikkei 225 gained around 1.38% on September 18, while semiconductor and AI-related stocks attracted strong attention.
A weaker yen can also benefit export-heavy companies because overseas earnings translate into more yen.
That creates a complicated market environment:
Higher rates → higher financing costs
Weaker yen → potential exporter support
AI demand → semiconductor and technology support
Higher energy prices → additional inflation pressure
Higher rates → potentially greater support for financial institutions
This is why I would watch sector rotation rather than treating the entire Japanese stock market as one trade.
🧠 Semiconductors and AI
Japanese semiconductor companies remain particularly interesting because they are connected to the global AI supply chain.
Key factors to monitor include:
• AI infrastructure spending
• Memory and HBM demand
• Data-center investment
• Yen movements
• U.S. technology stocks
• Global bond yields
If global AI demand remains strong while the yen stays relatively weak, Japanese semiconductor exporters could continue attracting attention.
But if U.S. technology valuations experience a sharp correction, Japanese semiconductor stocks could also face increased volatility.
🏦 Real Estate vs Financials
Higher rates create a very different environment for domestic sectors.
Highly leveraged companies and real estate businesses can become more sensitive to rising borrowing costs, while banks and financial institutions may benefit from a higher-rate environment through improved lending economics.
So another potential rotation to monitor is:
Higher rates → pressure on leveraged businesses
Higher rates → potential support for financials
Weak yen → exporter support
AI demand → technology and semiconductor support
The Nikkei therefore needs to be viewed through its individual sectors rather than as a single macro trade.
🌍 Why Global Markets Should Care
This is where the BOJ decision becomes much bigger than Japan.
For years, the yen has been an important funding currency because Japanese interest rates were extremely low.
As Japanese yields rise, the economics of yen-funded positions can gradually change.
If the yen strengthens significantly, leveraged positions funded through cheap yen could become more expensive to maintain.
That does not mean every global risk asset should immediately fall after a BOJ hike. The actual impact depends on the pace of Japanese tightening, U.S. Treasury yields, currency movements and investor positioning.
That is why I’m watching these markets together:
USD/JPY | Nikkei | U.S. Treasury yields | Nasdaq | Gold | Bitcoin
🥇 Gold
Gold remains another important macro indicator.
Higher real yields can create pressure on gold, but inflation concerns, geopolitical risks, central-bank demand and currency movements can work in the opposite direction.
XAU/USD has been trading around the $4,380 area, making $4,400 an important short-term decision zone for me.
A sustained move above $4,400 could keep higher levels in focus, while rejection combined with stronger Treasury yields could increase the probability of a deeper pullback.
₿ Bitcoin
Bitcoin also remains highly sensitive to global liquidity.
The current environment is particularly interesting because both the Federal Reserve and BOJ are influencing expectations around global financial conditions.
BTC has remained relatively resilient around the $77K–$81K region during recent macro volatility.
For Bitcoin, I’m watching whether liquidity conditions continue supporting risk assets or whether higher yields begin creating renewed pressure.
My key downside area remains around $77K–$75K, while reclaiming and holding higher levels would improve the short-term structure.
📊 Levels I’m Watching
USD/JPY: 156–157
Important zone for assessing continued yen weakness or a potential reversal.
Nikkei:
Watching whether post-BOJ strength continues and whether semiconductors remain the leadership group.
Gold: $4,400
Major short-term resistance/decision area.
BTC: $77K–$75K
Important downside zone during continued macro volatility.
🔎 What Comes Next?
Two broad paths are worth monitoring.
If the BOJ remains cautious about the pace of additional tightening, the yen could remain relatively weak, potentially supporting exporters and parts of Japan’s technology sector.
If inflation remains persistent and the BOJ signals a faster tightening path, Japanese yields and the yen could become much more important drivers of global positioning.
The next BOJ policy meeting is scheduled for October 29–30, 2026, giving markets several weeks of inflation, wage, currency and economic data to digest.
For me, the biggest lesson from this decision is simple:
The rate itself is only one part of the trade. The future path matters more.
I would rather watch the second-order reaction than chase the first headline move — especially across USD/JPY, Japanese semiconductors, U.S. Treasury yields, gold and Bitcoin.
In a high-volatility environment, my own approach is to scale exposure rather than enter everything at once: 30% initial exposure, 30% after confirmation and 40% reserved for a potential retest, while keeping total account risk around 1–2%.
Japan has now moved its policy rate to 1.25%, taking monetary policy further away from the ultra-low-rate era.
The next major question is not simply whether the BOJ can raise rates again.
It is how the yen, Japanese equities, global liquidity and risk assets respond as markets adjust to a Japan with meaningfully higher interest rates.
#BOJHikesTo1.25%31YearHigh #JapanStocks #GlobalMarkets
JPN225+0.23%
XAUUSD+0.83%
BTC0.00%
#GateTopsStockPerpetualCoverage
🔥 Gate Leads Stock Perpetual Coverage — The Equity Derivatives Market Is Expanding Fast
The line between traditional markets and crypto trading continues to blur, and stock perpetuals are becoming an increasingly important part of that transition.
According to recent DefiLlama data, as of September 7, Gate had 385 equity-linked perpetual contracts, the largest coverage among the six venues compared in the report.
But what caught my attention is that this is not only about the number of contracts.
Liquidity matters.
Across five of the most actively traded stock
BeautifulDay
#GateTopsStockPerpetualCoverage
🔥 Gate Leads Stock Perpetual Coverage — The Equity Derivatives Market Is Expanding Fast
The line between traditional markets and crypto trading continues to blur, and stock perpetuals are becoming an increasingly important part of that transition.
According to recent DefiLlama data, as of September 7, Gate had 385 equity-linked perpetual contracts, the largest coverage among the six venues compared in the report.
But what caught my attention is that this is not only about the number of contracts.
Liquidity matters.
Across five of the most actively traded stock-perpetual markets — SNDK, SKHYNIX, SPCX, SOXL and MU — Gate showed the deepest 0.1% order-book depth across the group, with an advantage ranging from approximately 5% to 28%. The report also found that Gate maintained the strongest 1% depth for SOXL and MU throughout the 14-day period examined.
That is an important distinction.
A platform can list hundreds of markets, but traders also need sufficient liquidity to enter and exit positions efficiently, particularly when trading leveraged perpetual contracts.
Gate’s stock-perpetual market has also been seeing strong activity. Recent data cited by ChainCatcher puts average daily stock-perpetual trading volume at around $1.15 billion, with average open interest around $738 million, both ranking within the top three in the cited comparison.
And the expansion is happening across different sectors.
From semiconductors and memory to technology, energy, financials and other equity-linked markets, stock perpetuals give traders another way to express both bullish and bearish views without waiting for traditional market hours.
Gate has also continued expanding its broader TradFi ecosystem. Its August transparency report says stock coverage exceeded 12,800 stocks and ETFs, while stock derivatives covered more than 360 underlying assets. The report also said stock-perpetual trading volume increased 308% month-on-month in August.
For me, this is the bigger story.
The market is moving beyond the idea that crypto exchanges are only for crypto.
Today, traders can follow:
📈 U.S. technology
🇯🇵 Japanese equities
🇰🇷 South Korean companies
💻 AI & semiconductor stocks
💾 Memory & storage
⚡ Energy and infrastructure
₿ Crypto and digital assets
And stock perpetuals add another layer by allowing traders to position around both upside and downside moves.
Of course, leverage also increases risk. A larger market does not remove the need for position sizing, stop levels and disciplined risk management.
My focus is therefore not simply on how many contracts are listed.
I’m watching coverage + liquidity + volume + open interest together.
That combination gives a much clearer picture of whether a stock-perpetual market is actually becoming useful for active traders.
Gate’s latest numbers suggest that this part of the platform is expanding rapidly.
The next question is how far this convergence between TradFi and crypto-native trading can go.
For traders watching AI, semiconductors, U.S. equities and global markets, stock perpetuals are becoming a theme worth keeping on the radar.
More markets. More flexibility. More ways to express a trade — but also more responsibility to manage risk.
#GateTopsStockPerpetualCoverage #GateSquareMidAutumnReunion #GateMeme
SNDK+2.58%
SKHYNIX-1.46%
SPCX-0.22%
SOXL+0.76%
MU+0.11%
#USAIConceptStocksRally
🔥 US AI Stocks Are Heating Up Again — Is Another Semiconductor Rotation Starting?
U.S. AI-related stocks are attracting fresh buying interest again, with semiconductors and AI infrastructure names leading the latest rebound.
The move is interesting because it is not being driven by just one company.
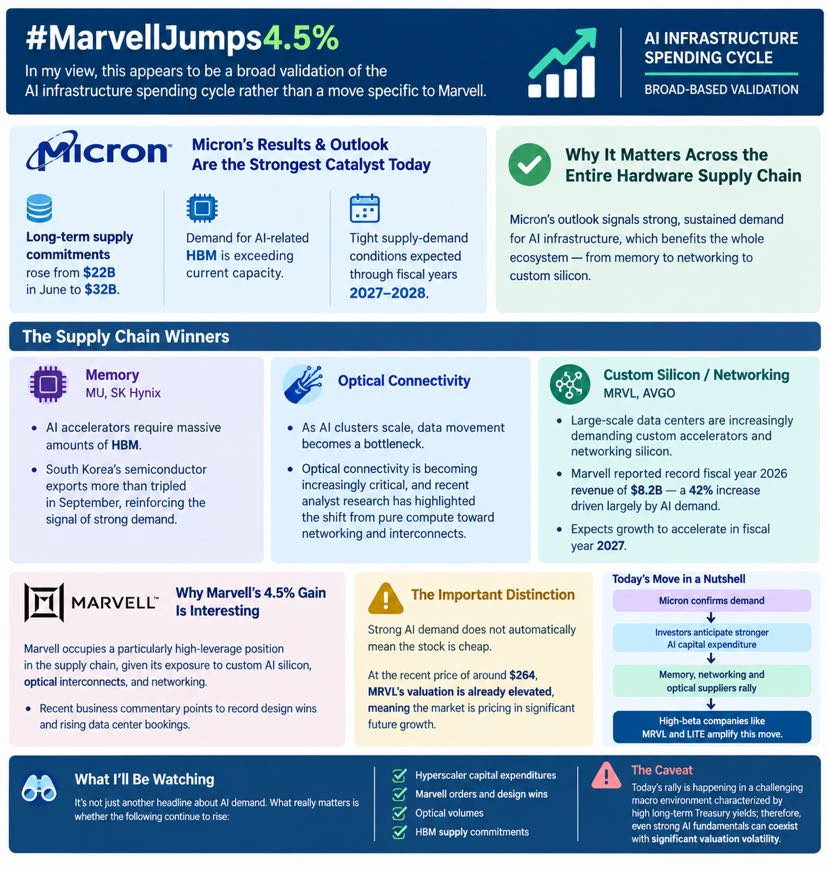
On September 17, the semiconductor ETF SOXX gained around 3.4%, while Intel jumped approximately 7.7%, AMD gained 6.5%, Nvidia added 2.5%, Marvell rose 4.8%, Micron gained 5.5%, and SanDisk advanced around 6.2%.
The Nasdaq also climbed roughly 1.7% during that session.
The
BeautifulDay
#USAIConceptStocksRally
🔥 US AI Stocks Are Heating Up Again — Is Another Semiconductor Rotation Starting?
U.S. AI-related stocks are attracting fresh buying interest again, with semiconductors and AI infrastructure names leading the latest rebound.
The move is interesting because it is not being driven by just one company.
On September 17, the semiconductor ETF SOXX gained around 3.4%, while Intel jumped approximately 7.7%, AMD gained 6.5%, Nvidia added 2.5%, Marvell rose 4.8%, Micron gained 5.5%, and SanDisk advanced around 6.2%.
The Nasdaq also climbed roughly 1.7% during that session.
Then on September 18, the Nasdaq added another 0.4% to close at 26,522.55, while the S&P 500 gained around 0.2% to 7,650.50.
So the question I’m watching is not simply:
“Are AI stocks going up?”
The bigger question is:
👉 Is this just another short-term bounce, or is capital beginning another rotation into AI chips, memory, networking and data-center infrastructure?
🚀 The Semiconductor Rotation
Semiconductors are currently giving the clearest signal.
Nvidia and AMD remain major AI processor names, but the latest move is also reaching Intel, Micron, Marvell and SanDisk.
That matters because the AI infrastructure story is much bigger than GPUs.
The broader ecosystem includes:
• Semiconductors
• High-bandwidth memory
• Storage
• Networking
• Data centers
• Power infrastructure
• Cloud computing
• AI software
• Enterprise AI
This creates multiple areas where capital can rotate as AI investment continues.
🟢 Nvidia
Nvidia remains one of the most important names in the AI semiconductor trade.
My focus is not simply on the percentage gain. I want to see whether NVDA can maintain its strength while other semiconductor names continue participating.
If Nvidia remains strong while AMD, Micron, Marvell and other chip stocks also hold their gains, that would provide better evidence of breadth across the AI trade.
🔵 AMD
AMD has also become one of the key higher-beta names in the latest semiconductor rebound.
A 6%+ daily move shows how quickly capital can rotate into AI-related names.
Personally, I would rather avoid chasing a large green candle. My preferred setup is:
Breakout → controlled pullback → retest → confirmation → entry
If former resistance becomes support, the trade structure becomes easier to manage.
⚙️ Intel
Intel was one of the strongest movers in the latest session, gaining approximately 7.7%.
What makes INTC interesting is that its story is different from Nvidia and AMD.
The market is not only trading AI demand. It is also watching U.S. semiconductor manufacturing, CPU supply and broader supply-chain developments.
That makes volume and follow-through especially important for Intel.
💾 Micron, SanDisk & Marvell
The latest move also shows why I’m watching the supporting layers of the AI infrastructure chain.
MU represents memory exposure.
SNDK brings storage exposure.
MRVL provides exposure to networking and data-center connectivity.
AI data centers need far more than processors. They require memory, storage, networking, interconnects, power, cooling and physical infrastructure.
That means the AI investment cycle can potentially create opportunities across a much wider group of companies.
👀 My AI Watchlist
My current watchlist includes:
NVDA — AI accelerator leadership
AMD — AI processors and data centers
INTC — U.S. semiconductor manufacturing
MU — Memory and AI infrastructure
SNDK — Storage exposure
MRVL — Networking and connectivity
PLTR — Enterprise AI and software
The reason I track them together is simple:
I want to know whether the AI rally is broadening.
📊 My Position Framework
I would not treat every AI stock the same because volatility varies significantly.
My preferred position structure:
30% — Initial entry after confirmation
30% — Breakout + successful retest
40% — Reserve for a pullback or stronger confirmation
For total account exposure, I would keep planned risk around 1–2% rather than allowing one volatile AI position to damage the overall account.
For profit management, my framework is:
+5% — First partial
+8–10% — Second partial area
+15% — Stronger momentum target
+20%+ — Only while trend and volume remain supportive
These are my trading framework, not guaranteed price targets.
🐂 Bullish Scenario
The setup becomes more interesting if:
✅ NVDA remains strong
✅ AMD continues participating
✅ MU and SNDK maintain momentum
✅ MRVL confirms strength
✅ INTC holds its breakout
✅ Nasdaq remains above the 26,000 area
If several parts of the AI ecosystem continue moving together, the rally would have broader participation than a single-stock move.
⚠️ Pullback Scenario
I’m equally prepared for a correction.
After a strong semiconductor session, profit-taking is completely normal.
I would rather see:
Breakout → Pullback → Retest → Volume confirmation → Entry
than chase a vertical move simply because AI stocks are trending higher.
🌎 Macro Risk Still Matters
AI stocks remain sensitive to the broader macro environment.
Treasury yields, inflation expectations, oil prices, Fed policy, earnings guidance and AI spending expectations can all influence high-growth technology valuations.
So even with a strong long-term AI narrative, short-term volatility can remain significant.
That is why I don’t want to chase every large green candle.
🎯 My Trading Rules
My approach is straightforward:
• Wait for confirmation
• Use partial entries
• Keep capital in reserve
• Take partial profits into strength
• Define invalidation before entering
• Keep account risk controlled
• Never go all-in on one AI stock
The goal is not to predict the exact top or bottom.
The goal is to participate while controlling downside.
🔥 Final View
The latest U.S. AI rally is becoming broader.
Semiconductors are once again leading, with Intel, AMD, Nvidia, Marvell, Micron and SanDisk all showing strong recent participation.
Now I want to see whether that strength continues into the next sessions and whether capital expands into memory, networking, cloud infrastructure and AI software.
My framework remains:
30% initial → 30% confirmation → 40% reserve
Risk:
1–2% planned account risk
Profit management:
+5% → +8–10% → +15% → +20%+ only with continued confirmation
The AI theme remains powerful, but I want price action to prove the trend.
The biggest signal I’m watching is not one individual stock.
It is whether the entire AI supply chain continues moving together.
If chips, memory, networking and AI software all participate, this becomes a much more interesting market structure to watch.
#NVDA #AMD #INTC
#JapanRealEstatePowerChipStocksRise
Kioxia Holdings (285A) is trading at 54,570 JPY as of September 18, 2026, and has gained 9.40% intraday, making it one of the top performing stocks in the Nikkei 225 index. The intraday trading range was between 50,600 and 54,570 JPY, with a market capitalization of 29.4 trillion JPY (approximately $188 billion).
The company's recent price movement is driven by exceptional financial results announced for the first quarter of fiscal year 2026 (April-June). Kioxia's revenue increased by 415.5% year-over-year to 1.767 trillion JPY. Operating profit increased 2
User_any
Kioxia Holdings (285A) is trading at 54,570 JPY as of September 18, 2026, and has gained 9.40% intraday, making it one of the top performing stocks in the Nikkei 225 index. The intraday trading range was between 50,600 and 54,570 JPY, with a market capitalization of 29.4 trillion JPY (approximately $188 billion).
The company's recent price movement is driven by exceptional financial results announced for the first quarter of fiscal year 2026 (April-June). Kioxia's revenue increased by 415.5% year-over-year to 1.767 trillion JPY. Operating profit increased 28-fold to 1.33 trillion JPY, while net profit increased 45-fold to 842.2 billion JPY. The gross profit margin reached 80%. The primary driver of this performance was the explosion in demand for NAND flash memory for AI servers and the resulting rapid price increase due to the inability of supply to keep up with this demand.
The company is projecting an operating profit of 3.16 trillion JPY for fiscal year 2026. It has also launched an 800 billion JPY share buyback program and will conduct a 3:1 stock split on September 30th.
In terms of key indicators, the stock's 30-day exponential moving average (EMA30) is at 54.069 JPY, while the 60-day EMA is at 56.098 JPY and the 120-day EMA is at 52.983 JPY. The SuperTrend indicator is at 62.178 JPY, well above the current price.
On the Japanese economic front, the Bank of Japan (BOJ) raised its policy interest rate by 25 basis points from 1.00% to 1.25% on September 18, 2026. This is the highest level since April 1995. The BOJ revised its core CPI forecast for fiscal year 2026 to 2.8%, indicating inflationary pressure significantly above the target. BOJ Governor Ueda's messages at the press conference are critical for the yen's trajectory and carry trade positions.
Meanwhile, Kioxia is reportedly in talks with Bank of America, Goldman Sachs, and JPMorgan for a US IPO of at least $100 billion. The company also stated that it has no plans to merge its NAND business or conduct joint research with its main shareholder, SK hynix.
Analyst opinions are divided. According to a survey of 16 analysts, the stock has a "Buy" consensus with an average target price of 110,594 JPY. However, Bernstein maintained its "Sell" recommendation with a target price of 40,000 JPY in its report published on September 8th.
This content does not constitute investment advice; it is merely an unbiased summary of current information compiled from publicly available sources.
#JapanRealEstatePowerChipStocksRise
#日股地产电力半导体板块走强
repost-content-media
BAC-0.79%
GS-0.97%
SK Hynix+6.41%
SKHY+2.61%
SKHYV-0.98%
Join the weekly posting event to post, earn points and win big rewards! https://www.gate.com/campaigns/6244?ref=VLIXXFKJAQ&ref_type=132
post-image
🎉 Up to 100 USDT per week! Gate Square’s “Weekly Share” campaign is in full swing!
📌 How to participate
① Sign up for the campaign 👉 https://www.gate.com/campaigns/6244
② Make a post with the #每周来晒 and #周末行情你看涨还是看跌 hashtags
③ Share your market outlook, earn points, climb the leaderboard, and win rewards!
💬 Weekend highlights
The market never sleeps on weekends! How bullish or bearish are you on crypto and stock tokens? Share your weekend trading outlook and the assets you’re watching.
💡 Discussion topics
1️⃣ Are you overall bullish or bearish on the weekend market?
2️⃣ Which side are yo
GateSquare
🎉 Up to 100 USDT per week! Gate Square’s “Weekly Share” campaign is in full swing!
📌 How to participate
① Sign up for the campaign 👉 https://www.gate.com/campaigns/6244
② Make a post with the #每周来晒 and #周末行情你看涨还是看跌 hashtags
③ Share your market outlook, earn points, climb the leaderboard, and win rewards!
💬 Weekend highlights
The market never sleeps on weekends! How bullish or bearish are you on crypto and stock tokens? Share your weekend trading outlook and the assets you’re watching.
💡 Discussion topics
1️⃣ Are you overall bullish or bearish on the weekend market?
2️⃣ Which side are you more bullish on: crypto or stock tokens?
3️⃣ If you could trade only one asset, which coin or stock token would you choose?
Share now: https://www.gate.com/post
Campaign details: https://www.gate.com/announcements/article/101691
repost-content-media