The True Strength Index indicator tracks the direction and relative strength of price movement through its true strength index line. Its calculation compares double-smoothed price changes with double-smoothed absolute price changes, reducing the influence of short-term price fluctuations while showing whether bullish or bearish momentum is strengthening, weakening, or shifting. Professional traders often combine the reading with trend lines, support and resistance levels, the Relative Strength Index, the MACD indicator, or other indicators to confirm whether momentum supports a strong trend or may be vulnerable to sudden market movements.
TSI indicator can be useful for traders evaluating trend continuation, momentum crossovers, and divergence. However, its smoothing creates lag, so TSI signals should be confirmed with price structure, trading volume, or another technical indicator rather than treated as automatic entry or exit instructions.
TL;DR
-
The True Strength Index measures price momentum through double-smoothed price changes.
-
Positive readings generally indicate bullish momentum, while negative readings suggest bearish momentum.
-
Zero-line crosses, signal-line crossovers, slope changes, and divergence provide different types of information.
-
The commonly referenced calculation uses 25-period and 13-period exponential smoothing, although settings vary.
-
TSI reduces some market noise but can lag and produce false crossovers in sideways conditions.
What Is the TSI Momentum Oscillator Indicator?
The TSI indicator is a momentum oscillator developed by William Blau in the early 1990s to evaluate the direction and strength of price trends. It moves above and below a central zero line, with positive values reflecting upward momentum and negative values reflecting downward momentum.
TSI differs from a basic Momentum indicator, which directly compares the current price with a price from an earlier period. The True Strength Index TSI instead double-smooths directional price changes and normalizes them against double-smoothed absolute changes, a structure traders use across financial markets and on different timeframes to filter short-term noise and judge momentum more reliably.
This design gives the oscillator a steadier line. Small price fluctuations have less immediate influence, while sustained movements gradually push the indicator further above or below zero. In practice, that can help traders and investors spot trend continuation, momentum crossovers, and divergence with fewer false signals, though smoothing does not eliminate market noise and can delay signals.
The Relative Strength Index also measures momentum, but RSI compares recent gains with recent losses on a bounded 0–100 scale. TSI focuses on double-smoothed price change rather than fixed 70 and 30 thresholds, and the rest of this guide explains how it is calculated, how to read its signals, which settings and timeframes to consider, how it fits into trading strategies, and where its risks and limits compare with RSI and MACD.
How Is the True Strength Index Calculated?
The True Strength Index divides double-smoothed price change by double-smoothed absolute price change and multiplies the result by 100, making it a measure of double smoothed momentum:
TSI = 100 × Double-Smoothed Price Change ÷ Double-Smoothed Absolute Price Change
The calculation can be understood in five steps:
-
Use the previous closing price and current closing price to calculate daily momentum.
-
Smooth the resulting price changes with an exponential moving average.
-
Apply a second EMA to the first smoothed result.
-
Repeat both smoothing stages using the absolute value of the price changes.
-
Divide the double-smoothed directional change by the double-smoothed absolute change and multiply by 100.
This smoothing process uses two exponential moving averages as a double smoothing technique, which helps filter noise but means the TSI can lag slightly behind rapid price changes.
A commonly referenced configuration uses a 25-period EMA for the first smoothing stage and a 13-period EMA for the second. Some charting systems also add a shorter EMA of the TSI value as a signal line. These parameters are conventions rather than universal settings and may be adjusted for different assets or timeframes.
The smoothing method follows the same principle as the EMA indicator, which assigns more weight to recent data than a simple moving average. Applying EMA smoothing twice gives TSI greater stability but also increases its lag.
How to Interpret TSI Indicator Readings
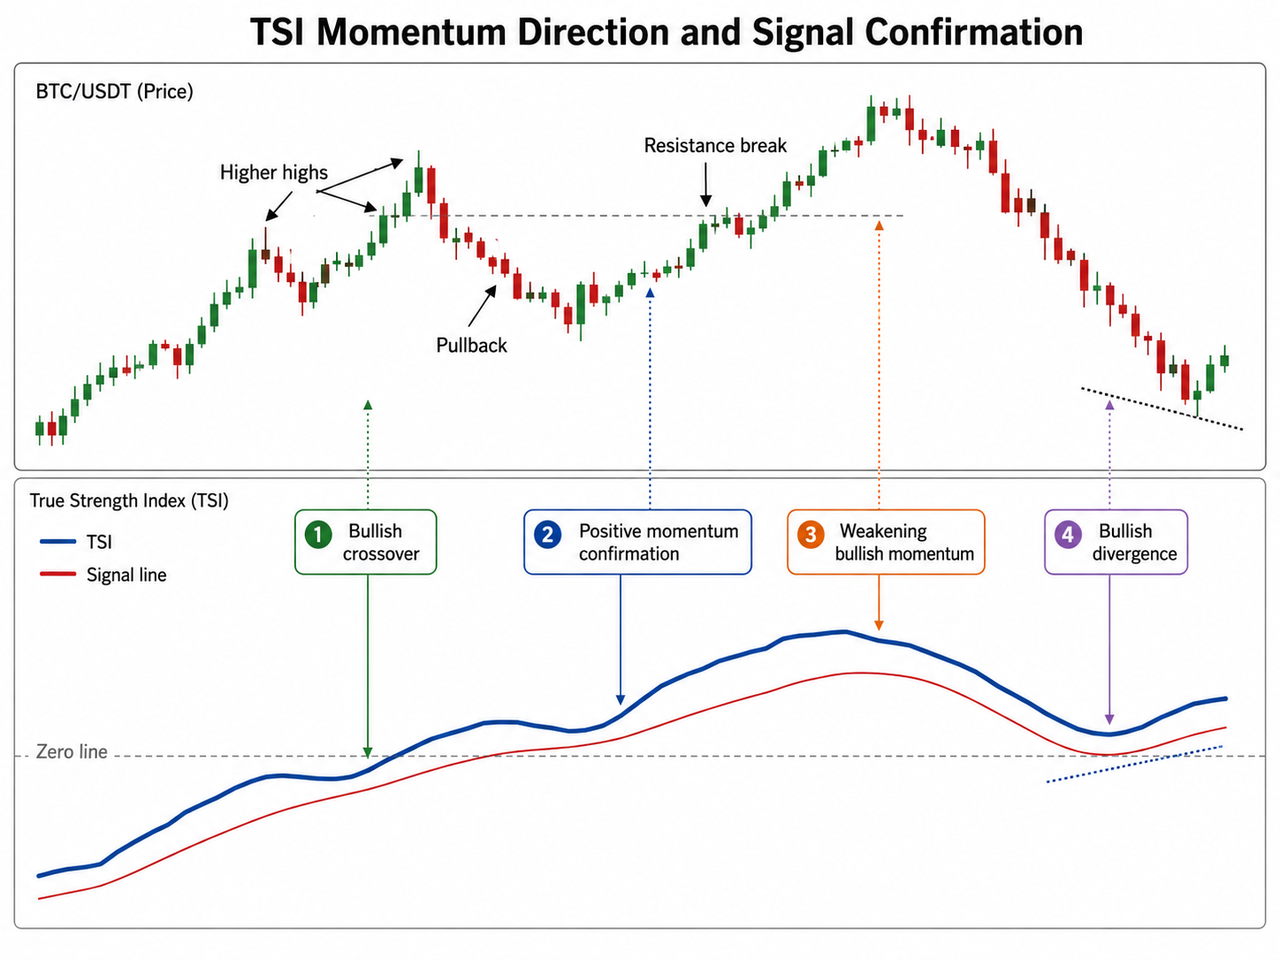
The zero line is the main reference for determining momentum direction in technical analysis, and the TSI helps identify trends within broader market trends. A TSI reading above zero generally means positive price movements dominate after smoothing, and a cross above zero is a bullish signal, while a reading below zero indicates that negative price movements are stronger and a cross below zero is a bearish signal.
Direction and slope also matter. A rising TSI above zero suggests that bullish momentum is strengthening. A falling TSI that remains above zero shows that bullish momentum is weakening, but it does not yet establish bearish control. Below zero, a falling line reflects strengthening bearish momentum, while a rising line suggests that selling pressure is losing force.
The distance from zero can indicate how extended momentum has become relative to the asset’s recent behaviour. TSI does not have universally dependable overbought and oversold levels, however. Historical extremes may differ considerably across cryptocurrencies, chart intervals, and volatility regimes. Even so, traders often define asset-specific overbought or oversold conditions, with common reference points near +25 for overbought conditions and -25 for oversold conditions. Some also watch extreme TSI values such as +50 or +70 on the upside and -50 or -70 on the downside for stronger exhaustion signals. High volatility stocks often need wider threshold ranges, while low volatility stocks may use lower ranges.
The CCI indicator also uses positive and negative readings to evaluate momentum extremes, but CCI measures the deviation of typical price from its statistical average. TSI instead evaluates smoothed directional price change relative to total absolute movement.
What Do TSI Signal Line Crossovers and Divergence Mean?
A zero-line crossover indicates possible potential reversals in the dominant momentum direction and can mark potential turning points. A move from below zero to above zero may suggest that bullish momentum is gaining control, while a move below zero may indicate increasing bearish momentum. Because of double smoothing, these centerline crossovers can occur after the underlying price move has already started.
Signal-line crossovers respond more quickly. A signal line, often an EMA of the indicator, helps generate signals for trade management. A bullish crossover occurs when TSI rises above its signal line, and that buy signal can be used among entry signals or exit points when confirmed, while a bearish crossover forms when TSI falls below it. In practice, TSI crosses aligned with the zero line may carry more context: a bullish crossover above zero supports an existing positive-momentum environment, whereas repeated crosses near zero often reflect an indecisive or range-bound market.
Divergence appears when price and TSI move in opposing directions. Bullish divergence forms when price records a lower low while TSI produces a higher low. Bearish divergence develops when price reaches a higher high while TSI forms a lower high. Divergences between price and TSI can signal trend reversals, especially when price action stops confirming the move, but they do not guarantee an immediate reversal.
The ROC indicator can reveal similar disagreement between price and momentum. ROC is generally more direct and responsive, whereas reading the TSI line visually provides a steadier but slower view of the oscillator.
How Traders Can Use the TSI Indicator
TSI is most useful when several pieces of evidence point in the same direction. Traders can build a trading strategy around TSI signals, but the indicator generally works better when combined with price action, volume, and a separate trend-strength tool. A bullish crossover becomes more meaningful when price also forms a higher low, breaks resistance, or closes above a relevant trend reference.
For example, a trader wants to trade based on a bullish TSI crossover. He opens a cryptocurrency exchange such as Gate.com and examines the live BTC/USDT chart. Before entering a position, he checks whether TSI has crossed above its signal line, price has closed above resistance, and trading volume has expanded. If only the crossover appears while price remains below resistance, he may wait for stronger confirmation instead of acting on the oscillator alone.
The same process can help with managing an open position. Suppose TSI remains above zero but begins to slope downward while BTC continues rising. The trader may interpret this as weakening bullish momentum rather than an immediate sell signal. He can then monitor whether price loses support, forms a lower high, or shows declining volume before deciding whether to reduce the position. This approach can help avoid exiting a winning trade too early solely because momentum has started to slow.
Trend-strength indicators provide another confirmation layer. The ADX indicator measures trend strength without determining direction, helping traders distinguish a meaningful momentum move from a weak crossover. The Aroon indicator can show whether recent highs or lows support the direction implied by TSI. Traders may adapt these combinations according to their preferred timeframe, risk tolerance, and trading style.
The MACD indicator is another useful comparison because both tools use exponential smoothing and may include signal lines. MACD measures the difference between two moving averages, while TSI normalizes double-smoothed price changes against absolute price movement. The MACD vs. RSI comparison also illustrates why trend-following and momentum indicators can produce different signals from the same market data.
The Awesome Oscillator compares short-term and long-term momentum using median-price moving averages. TSI instead relies on closing-price changes and double smoothing, making it more focused on normalized directional momentum.
TSI can also support day trading on intraday charts. For example, a trader using a 15-minute BTC/USDT chart may watch for a bullish signal-line crossover below zero, followed by a move above the zero line and a breakout from a short-term range. Faster settings can identify these shifts earlier, but they also increase noise and the likelihood of false crossovers.
TSI Indicator Settings and Timeframes
Shorter TSI settings react more quickly to price changes but also increase sensitivity to market noise. They may suit traders seeking earlier momentum shifts, although frequent crossovers can make interpretation difficult during volatile or sideways trading.
Longer settings produce a smoother oscillator and may be more suitable for identifying broader trend direction. The trade-off is slower confirmation, which can lead to later entries or delayed recognition of weakening momentum.
Timeframe selection changes the meaning of the signal. A bullish crossover on a five-minute chart may reflect only a brief recovery, while the same pattern on a daily chart can represent a broader momentum transition. Comparing the trading timeframe with a higher-timeframe TSI reading can help identify whether the shorter signal aligns with the larger market structure.
Risks and Limitations of the TSI Indicator
Double smoothing reduces some short-term noise but cannot remove false signals. During range-bound markets, TSI may repeatedly cross its signal line or the zero line without producing a sustained price move.
Lag is another limitation. By the time TSI confirms a momentum change, price may already have advanced or declined substantially. Sudden news-driven movements can also make earlier oscillator readings less relevant because the indicator is based entirely on historical price data.
Divergence can persist while price continues in the existing direction, and extreme readings do not establish that an asset must reverse. Settings also require adjustment: parameters that appear effective on one cryptocurrency or timeframe may perform poorly under different volatility and liquidity conditions.
Conclusion
The TSI indicator measures trend direction and momentum strength by comparing double-smoothed price changes with double-smoothed absolute price changes. Its zero line identifies the dominant momentum direction, while signal-line crossovers, slope changes, and divergence can reveal shifts in buying or selling pressure.
TSI is particularly useful for filtering some short-term noise and evaluating whether price momentum supports an existing trend. Its signals become more meaningful when confirmed by market structure, volume, or trend-strength tools. Because double smoothing creates lag and sideways markets can generate false crossovers, TSI should not be used as a standalone trading signal.
FAQ
Who developed the TSI indicator?
William Blau developed the True Strength Index as a smoothed momentum oscillator. The indicator was designed to retain information about directional price movement while reducing sensitivity to minor fluctuations.
What are the common TSI settings?
A commonly referenced configuration uses a 25-period EMA followed by a 13-period EMA. Signal-line settings and default parameters may vary across charting platforms.
Is the TSI indicator bounded?
The TSI formula is normalized by absolute price movement, and its theoretical limits are approximately −100 and +100. In normal market conditions, readings usually remain much closer to zero.
Is TSI a leading or lagging indicator?
TSI is primarily a lagging momentum indicator because it uses historical price changes and two smoothing stages. Divergence may warn that momentum is weakening, but it cannot predict the exact timing of a reversal.
Is TSI better than RSI or MACD?
No indicator is universally better. TSI emphasizes smoothed directional momentum, RSI focuses on the balance of gains and losses, and MACD evaluates the relationship between moving averages. Their usefulness depends on the market environment, timeframe, and confirmation method.







