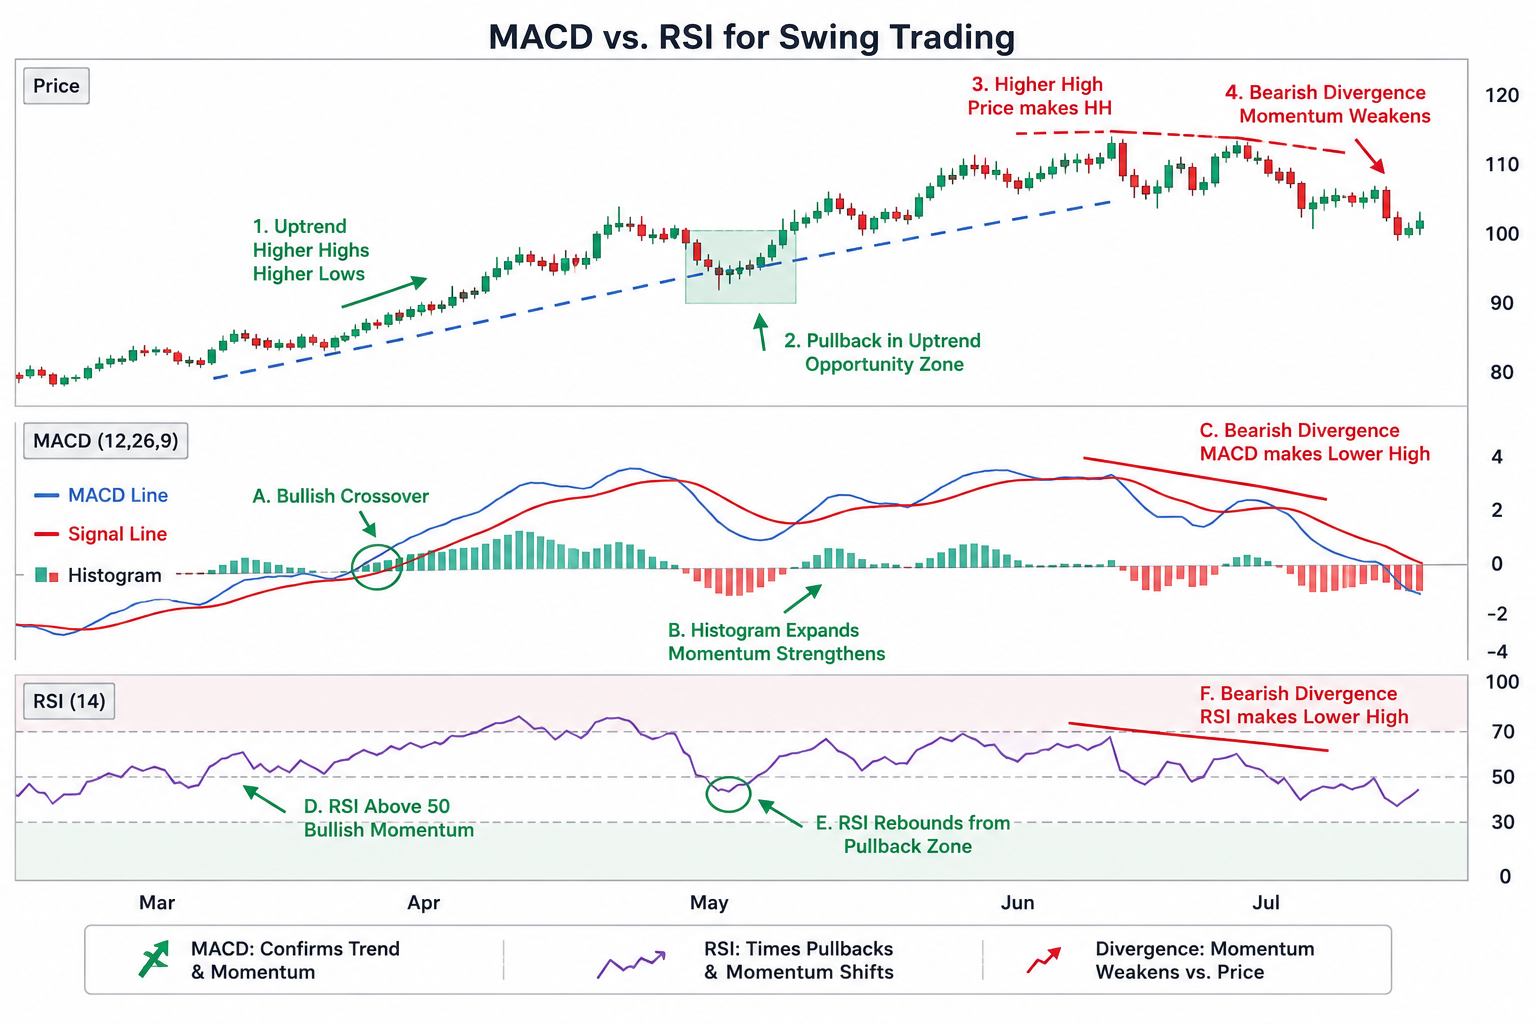
MACD is generally better for tracking trend momentum, while RSI is better for identifying short-term momentum exhaustion. Together, they show how signal speed and divergence influence trade interpretation and help traders choose the indicator setup that best matches different swing-trading strategies.
For swing traders and cryptocurrency traders, that difference affects how you read momentum, confirm trend strength, and decide when to enter or wait in volatile markets.
TL;DR
-
MACD is generally better for confirming trend direction, momentum changes, and continuation setups.
-
RSI is generally better for measuring short-term momentum and identifying stretched price conditions.
-
MACD signals often develop more slowly because the indicator is calculated from exponential moving averages.
-
RSI may react earlier, but overbought and oversold readings do not automatically signal a reversal.
-
Swing traders can combine MACD for directional confirmation with RSI for entry timing; both are technical analysis tools, and any use of them still requires proper risk management strategies alongside price structure and risk.
| Comparison factor |
MACD |
RSI |
| Primary purpose |
Trend and momentum confirmation |
Momentum and price-condition measurement |
| Standard calculation |
12-period EMA, 26-period EMA, and 9-period signal line |
14-period average gains and losses |
| Main signals |
Crossovers, zero-line position, histogram changes, divergence |
30/70 zones, centerline movement, failure swings, divergence |
| Responsiveness |
Generally slower |
Generally faster |
| Strongest environment |
Directional or developing trends |
Ranges, pullbacks, and momentum extremes |
| Main limitation |
Signals may arrive after price has moved |
Extreme readings may persist during strong trends |
The central difference is that MACD evaluates the relationship between trend-sensitive moving averages, whereas RSI normalizes recent price momentum onto a scale from 0 to 100. That makes MACD more suitable for assessing directional structure and RSI more suitable for evaluating the intensity of recent buying or selling.
What Is the MACD Indicator?
The Moving Average Convergence Divergence indicator is a trend following momentum indicator that measures changes in trend momentum by comparing two exponential moving averages. The MACD calculation subtracts the 26-period EMA from the 12-period EMA, so MACD measures the gap between those averages and plots a 9-period EMA of that result as the signal line.
The three main MACD components are:
-
MACD line: The difference between the faster and slower EMAs.
-
Signal line: A smoothed average of the MACD line.
-
Histogram: The distance between the MACD line and signal line.
A signal line cross occurs when the MACD line crosses above or below the signal line. These MACD line crosses can act as potential trade entries and exits, and traders often treat them as buy and sell signals within a broader set of trading signals. Movement above or below the zero line also helps show whether shorter-term momentum is stronger or weaker than the broader moving-average trend.
Because the indicator is built from moving averages, MACD is one of the lagging indicators, so it tends to confirm trend strength rather than identify the exact turning point. In practice, macd crosses are often used for confirmation instead of trying to catch reversals at the first tick. The underlying role of EMA responsiveness is also visible in the EMA 20 indicator, where recent prices receive greater weight than older observations.
The full construction and interpretation of the Moving Average Convergence Divergence indicator provide the foundation for evaluating MACD crossovers, histogram changes, and zero-line behavior.
What Is the RSI Indicator?
The Relative Strength Index RSI is a momentum oscillator that measures the speed and change of price movements by comparing the magnitude of recent gains with recent losses. The result is displayed as RSI values on a bounded scale from 0 to 100, commonly using a 14-period lookback.
RSI readings above 70 are traditionally described as overbought, while readings below 30 are described as oversold. These overbought or oversold levels indicate momentum extremes, with the lower zone marking oversold territory, not guaranteed reversal points. A cryptocurrency can remain above 70 during a sustained uptrend or below 30 during a persistent decline.
Swing traders can also interpret:
-
The 50 centerline: Movement above 50 suggests improving bullish momentum, while movement below 50 suggests weakening or bearish momentum.
-
Bullish and bearish ranges: RSI may hold between approximately 40 and 80 during an uptrend or between 20 and 60 during a downtrend.
-
Divergence: A disagreement between price structure and RSI momentum may indicate that a move is losing strength.
-
Failure swings: RSI may reverse before price confirms a change in market structure.
RSI usually reacts faster than MACD because it measures recent price gains and losses directly rather than waiting for two moving averages and a signal line to change their relationship. For that reason, it is often treated as a leading indicator for spotting potential reversals, even though faster signals can also produce more noise.
MACD vs. RSI: What Are the Main Differences?
MACD and RSI both measure momentum, but they describe different aspects of momentum. MACD evaluates market momentum and helps confirm the overall direction and strength of a market trend, giving traders a clearer view of the overall trend within broader market trends. RSI evaluates how strongly price has moved relative to its recent gains and losses.
Calculation and Output
MACD is an unbounded indicator, meaning its values do not remain within a fixed numerical range. The interpretation depends on crossovers, distance from the zero line, histogram expansion, and the indicator’s relationship with price.
RSI is bounded between 0 and 100. Its fixed scale makes it easier to compare present momentum with established zones such as 30, 50, and 70.
This structural difference matters for swing trading. MACD supplies more information about trend development, while RSI presents clearer short-term momentum thresholds.
Signal Speed
RSI is generally the faster indicator. A sharp sequence of gains or losses can move RSI rapidly, sometimes before the chart forms a confirmed reversal.
MACD is generally slower because EMA-based signals require enough price movement to change the relationship between the fast average, slow average, and signal line. MACD’s lagging nature can delay entry and exit points during fast market moves. That delay can reduce premature entries but may also produce a less favorable entry after a reversal has already begun.
The EMA 20 vs. EMA 50 comparison reflects the same responsiveness trade-off: shorter calculations detect changes earlier, while slower calculations provide smoother trend confirmation.
Trend Identification
MACD is usually stronger for trend identification. A MACD line above the signal line and zero line supports bullish momentum, particularly when the histogram expands and price maintains higher highs and higher lows.
RSI can confirm trend conditions through centerline behavior and momentum ranges, but an isolated reading above 70 does not determine whether the broader market trend remains bullish.
Swing traders needing a direct measurement of trend strength can also evaluate the ADX indicator. ADX addresses a limitation shared by MACD and RSI by focusing on the strength of directional movement rather than relying only on momentum position.
Overbought and Oversold Conditions
RSI is stronger for identifying stretched short-term conditions because its 0-to-100 scale creates consistent reference zones. However, “overbought” means buying momentum has been unusually strong, not that price must immediately decline. “Oversold” similarly describes unusually strong selling rather than a guaranteed bottom.
MACD has no equivalent fixed overbought or oversold thresholds. Traders may observe unusually wide separation from the zero line, but the meaning depends on the asset, volatility, and timeframe.
Divergence
Both indicators can produce bullish and bearish divergence.
A bullish divergence forms when price records a lower low while the indicator forms a higher low. A bearish divergence forms when price records a higher high while the indicator forms a lower high.
RSI divergence may appear earlier because RSI responds quickly to changes in recent momentum. MACD divergence may carry more trend context because it reflects changes in the relationship between two moving averages. Neither divergence confirms a reversal by itself. Price should still break a relevant swing level, trendline, or support and resistance zone.
MACD generally performs better in trending markets, while RSI often provides more useful timing information in ranges and pullbacks.
| Market condition |
More useful indicator |
Reason |
| Established uptrend |
MACD |
Confirms whether positive trend momentum remains intact |
| Established downtrend |
MACD |
Tracks negative momentum and continuation |
| Sideways range |
RSI |
Highlights momentum shifts near range boundaries |
| Trend pullback |
RSI with MACD confirmation |
RSI measures the pullback while MACD checks broader direction |
| Early reversal attempt |
RSI |
May detect momentum deterioration sooner |
| Confirmed trend transition |
MACD |
Crossovers and zero-line movement provide broader confirmation |
| Highly volatile market |
Neither alone |
Both can produce rapid or misleading signals |
MACD may generate repeated crossovers when price moves sideways because the underlying averages converge and separate without establishing direction. RSI can also move repeatedly between momentum zones during unstable conditions.
A trend-following overlay such as the SuperTrend indicator can help traders check whether volatility-adjusted price direction agrees with a MACD or RSI signal. Indicator agreement still cannot remove false breakouts, slippage, or market risk.
Is MACD or RSI Better for Swing-Trading Entries?
Using MACD for trend direction and RSI for timing can improve trading strategies, because this division of roles helps traders refine entry and exit points without losing sight of the broader setup.
Consider a bullish swing-trading setup:
-
Price remains above a rising trend average and continues to form higher swing lows.
-
MACD stays above zero or begins turning upward, supporting the broader bullish structure.
-
RSI falls during a temporary pullback without breaking its bullish range.
-
RSI then turns upward as price rejects support.
-
Price closes above a short-term resistance level before an entry is considered.
In this framework, MACD answers, “Is the broader trend still pointing in the right direction?” RSI answers, “Has the pullback created a better timing window for the setup?”
The same logic can be reversed for bearish setups. MACD may confirm a negative trend, while an RSI rebound toward a resistance zone identifies where selling pressure could resume.
Should Swing Traders Combine MACD and RSI?
Combining rsi and macd can help confirm each other's signals, reduce false signals, and create higher-probability trades, but using both macd still does not automatically improve accuracy.
A practical confirmation framework is:
-
Use price structure to define the trend.
-
Use MACD to judge whether momentum supports that trend.
-
Use RSI to identify overbought or oversold conditions and the timing of a pullback.
-
Require a price-based trigger before acting.
-
Define invalidation and position risk before entering.
Traders should avoid treating MACD and RSI as two completely independent confirmations. Confluence is most useful when signals align with price action, not when they simply echo the same move. Adding more other indicators can create the appearance of confirmation without adding genuinely new information.
Volume, volatility, support and resistance, and market structure may provide more diverse evidence than stacking several momentum oscillators. A broader review of trading indicators separates trend, momentum, volatility, and volume tools according to the market information they measure.
MACD vs. RSI: Which Should Swing Traders Choose?
MACD is the stronger standalone choice when the primary objective is following directional trends. RSI is the stronger choice when the primary objective is evaluating pullbacks, momentum extremes, or potential turning points.
Choose MACD when:
-
The market is forming a visible directional trend.
-
Trend confirmation matters more than receiving the earliest signal.
-
The setup depends on crossovers, zero-line behavior, or momentum expansion.
-
The trader wants to avoid acting on every short-term price fluctuation.
Choose RSI when:
-
The market is ranging between identifiable support and resistance.
-
The trader needs a faster measure of momentum.
-
The setup depends on pullback timing or momentum divergence.
-
Overbought, oversold, or centerline behavior is relevant.
Use both when:
-
MACD defines the directional bias and RSI times the pullback.
-
Price structure confirms the signal.
-
Each indicator has a clearly different role in the trading process.
Neither indicator predicts price with certainty. Crypto markets can move sharply because of liquidity changes, news, liquidations, or broader risk sentiment before a technical signal confirms the move. Stop-loss placement, position sizing, and predefined invalidation remain more important than choosing a universal indicator winner.
Educational disclaimer: Technical indicators cannot guarantee trading outcomes. Digital assets are volatile, and indicator signals may fail during rapid price changes, low-liquidity conditions, or sideways markets. Traders should independently evaluate position size, leverage, execution risk, and invalidation levels.
Conclusion
MACD and RSI each provide valuable but different insights for swing trading. MACD is generally more effective for confirming trend direction and momentum continuation, while RSI responds faster to short-term momentum changes and potential exhaustion. Rather than choosing one as universally better, swing traders often achieve stronger analysis by selecting the indicator that matches the current market environment or by combining both with price action, support and resistance, and sound risk management.
FAQ
Is MACD more accurate than RSI?
MACD is not universally more accurate than RSI. MACD may provide more reliable trend context in directional markets, while RSI may respond more effectively to momentum changes in ranges or pullbacks. Accuracy depends on timeframe, market structure, settings, and confirmation rules.
Which timeframe is best for MACD and RSI swing trading?
Daily and four-hour charts are commonly used to assess multi-session swing setups, although the appropriate timeframe depends on the intended holding period. A higher timeframe can establish direction, while a lower timeframe can refine an entry without replacing the broader trend analysis.
Can MACD and RSI give opposite signals?
MACD and RSI can give opposite signals because they measure momentum differently. RSI may show an overbought condition while MACD continues to confirm a strong uptrend. The disagreement often indicates stretched short-term momentum within an intact broader trend rather than a calculation error.
What are the best MACD and RSI settings?
The common defaults are 12, 26, and 9 for MACD and 14 periods for RSI. These settings provide a consistent starting point, but faster settings increase sensitivity and false signals, while slower settings reduce noise and delay confirmation.
Can MACD and RSI predict a reversal?
MACD and RSI can indicate weakening momentum; RSI may act as a leading indicator for potential reversals, while MACD usually confirms after momentum has already begun to shift. A bearish crossover or divergence can show fading upward momentum, while bullish divergence may suggest downward momentum is weakening. When both indicators align, traders may treat that as a bullish signal or use it to refine sell signals and exit points, but neither can predict a reversal with certainty. Divergence, crossovers, and extreme readings become more meaningful when price also breaks an important swing level or confirms a change in market structure.







