The Aroon indicator measures how recently price recorded its highest high and lowest low within a selected period, helping swing traders identify emerging trend direction, evaluate changes in market control, and distinguish developing trends from sideways conditions.
Abstract
-
Aroon Up measures how recently price formed the highest high within the selected period.
-
Aroon Down measures how recently price formed the lowest low.
-
A line near 100 indicates a recent price extreme, while a line near zero indicates an older extreme.
-
Crossovers can signal changing market control, but they require confirmation from price structure.
-
Sideways markets can produce frequent crossovers and unreliable signals.
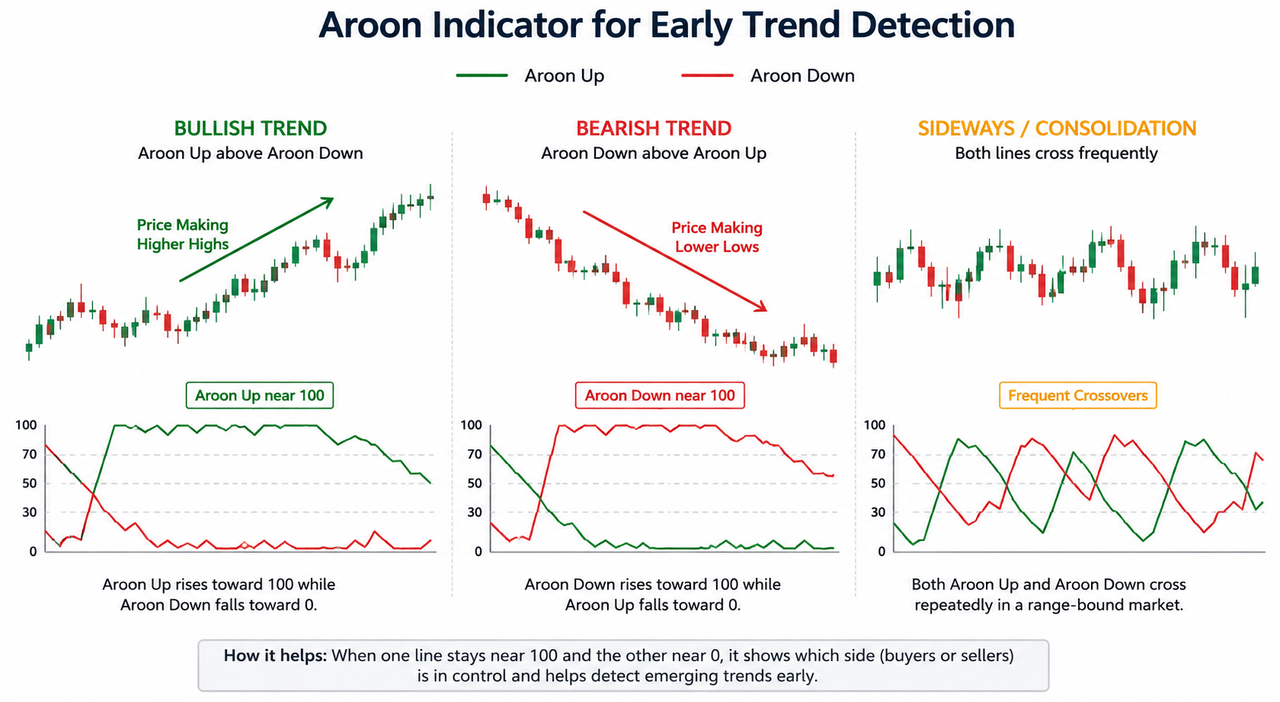
What Is the Aroon Indicator and Aroon Oscillator?
The Aroon indicator is one of the technical analysis tools traders use to identify trend direction and trend strength by measuring how recently price set its highest high and lowest low within a chosen lookback period. Developed by Tushar Chande in 1995, the name refers to “dawn’s early light,” which fits its purpose: spotting the start of a new trend as market control begins to shift.
For swing traders and other technical analysts, this guide explains how the Aroon indicator works, how the Aroon indicator system uses two separate indicators Aroon Up and Aroon Down, as a two-line signal, and how to interpret its settings, trade signals, combinations with other tools, and limitations in practice. The default look-back period is typically 25 periods, though some platforms use a different default period such as 14; in the standard 25-period version, Aroon Up measures the days since a 25-day high and Aroon Down measures the days since a 25-day low.
In direct terms, the Aroon indicator is a range bound oscillator that runs from 0 to 100 and helps show whether buyers or sellers are gaining control by highlighting the recency of highs and lows. It does not predict price on its own, but it can help detect emerging trends, consolidations, and potential reversals earlier than many price-based indicators.
You’ll see how to calculate and read the separate indicators, what common crossover and level-based signals mean, how to adjust settings for different trading styles, when to combine Aroon with other indicators, and where the tool can produce weak signals in range-bound markets.
How Is the Aroon Indicator Calculated?
The Aroon indicator formula converts the number of periods since a recent high or low into a percentage.
Aroon Up = [(N − periods since highest high) ÷ N] × 100
Aroon Down = [(N − periods since lowest low) ÷ N] × 100
In these formulas, N represents the selected lookback period and measures how many periods have passed since the highest high or lowest low within the specified period for the chosen time period.
Suppose a trader applies a 25-period setting. If the highest high occurred one period ago, Aroon Up equals 96, which means the aroon up value is showing a very recent high. If the lowest low occurred 20 periods ago, Aroon Down equals 20. The result suggests that bullish price structure is more recent than bearish structure.
A new highest high pushes Aroon Up to 100. Values near 100 indicate a very recent high or low and can point to a strong trend, while values near 0 show that the high or low occurred much farther back and suggest weaker conditions. The line then declines as more candles pass without another highest high. Aroon Down behaves in the same way when price records a new lowest low. The exact middle is 50, so a reading above 50 indicates a recent high or low within the lookback window.
The calculation differs from the EMA 20 indicator, which gives greater weight to recent closing prices. EMA 20 shows the direction of the recent average price, while Aroon shows how recently the market produced an important high or low.
How Do Traders Read Aroon Up and Aroon Down?
Aroon readings become more useful when traders evaluate the level of each of the aroon lines, which line is higher, and whether the relationship persists.
| Aroon condition |
Common interpretation |
What traders should verify |
| Aroon Up near 100 and above Aroon Down |
Recent highs support a strong uptrend |
Higher highs, higher lows, and breakout continuation |
| Aroon Down near 100 and above Aroon Up |
Recent lows support a bearish trend |
Lower highs, lower lows, and continued selling pressure |
| Both lines below 50 |
Price is often in a trading range or trading flat, and Aroon signals consolidation periods |
Consolidation or weakening trend structure |
| Frequent line crossovers |
Directional control is unstable |
Sideways trading or repeated false breakouts |
Reference levels such as 70, 50, and 30 are guidelines rather than fixed trading rules. For example, Aroon Up above 70 and Aroon Down below 30 often point to a strong uptrend, while Aroon Down above 70 and Aroon Up below 30 often point to a strong downtrend. When both lines are below 50, Aroon signals consolidation, which means price is often moving sideways without a clear trend; on a 25-period setting, readings below 50 mean no new high or low has occurred for 13 periods, and readings below 20 can highlight a trading range. Even so, traders should remain cautious in range trading conditions.
A single move to 100 may also result from a marginal new high that immediately fails. Persistent line separation combined with clear price structure generally provides stronger evidence than one isolated reading.
How Does Aroon Detect an Emerging Trend?
The Aroon indicator can reveal an emerging trend when one line rises toward 100 while the opposite line declines. This separation suggests that one side of the market is producing newer price extremes more consistently.
A developing bullish sequence may involve:
-
Aroon Up rising from a low or middle range.
-
Aroon Up crosses above Aroon Down.
-
Price breaking a previous swing high or resistance level.
-
Aroon Up remains elevated while Aroon Down remains low.
-
Price beginning to form higher highs and higher lows.
A bearish transition follows the opposite pattern. Aroon Down crosses above Aroon Up, price breaks support, and lower highs and lower lows begin to develop.
Crossovers should be treated as alerts rather than automatic entries, because Aroon signals are not standalone trading signals. A crossover can occur when an old high or low leaves the calculation window, even when price has not begun a meaningful trend.
Price confirmation is therefore important. A bullish crossover carries more weight when price also closes above resistance, which may support a long position; these crossovers can also flag potential reversals and trend changes, but they still need further confirmation from the price chart. A bearish crossover becomes more meaningful when price breaks support and fails to recover, which can support a sell signal.
Which Aroon Settings Work for Swing Trading?
The default period is the standard 25-period setting for swing trading, but no single setting works equally well across every asset and timeframe.
| Setting |
Potential advantage |
Main limitation |
| Shorter lookback |
Detects changes earlier |
Produces more false signals |
| Standard 25 periods |
Balances sensitivity and filtering |
Can lag fast reversals |
| Longer lookback |
Filters short-term noise |
Detects trends later |
A 25-period setting on a daily chart covers a much longer market interval than the same setting on a four-hour chart, so the chosen time period affects how the indicator responds across charts. Cryptocurrency also trades continuously, so calendar interpretations borrowed from traditional markets may not transfer directly.
Traders should test one setting across trending, ranging, and volatile conditions. An extended period or longer setting can be a better fit in trending markets, while shorter settings react faster but may add more noise as market conditions change. Constantly changing the lookback after unsuccessful trades can create curve-fitting rather than a reliable process.
How Can Aroon Be Combined With Other Indicators?
Aroon works best when combined with other technical analysis tools that measure a different aspect of market behaviour.
The MACD indicator can provide momentum confirmation. Aroon may show that bullish highs are becoming more recent, while MACD can indicate whether upward momentum is expanding. Traders often use both to assess momentum shifts and possible trend reversals within broader trading strategies.
The SuperTrend indicator adds a volatility-adjusted trend filter. An Aroon crossover may identify an early transition, while SuperTrend can help confirm whether price has established a clearer directional structure. Moving averages can offer further confirmation when reading aroon indicator signals.
Useful confirmation in confirmation-based setups may also come from:
-
Higher highs and higher lows during bullish conditions.
-
Lower highs and lower lows during bearish conditions.
-
Support or resistance breaks.
-
Increased trading volume around a breakout.
-
Momentum that agrees with the Aroon direction.
Using several indicators does not eliminate risk. Different indicators may respond to the same underlying price movement and fail together during an abrupt reversal.
What Are the Limitations of the Aroon Indicator?
The Aroon indicator does not measure the size or strength of a price move. A minor new high and a major breakout can both push Aroon Up to 100.
The indicator can also generate repeated crossovers in sideways, range bound markets. As older highs and lows leave the lookback window, small price movements may cause the lines to change position without producing a sustained trend, which can help distinguish trending markets from range-bound markets, though aroon performs better in trending markets than in range-bound conditions.
Aroon is based on historical data, so it is a lagging indicator and a signal may appear after part of the price movement has already occurred, especially in fast-moving market conditions. Crossovers can consequently be early in relation to slower moving averages but still late relative to the initial breakout.
Swing traders should consider liquidity, volatility, market direction, support and resistance, and position risk alongside the indicator. No Aroon reading guarantees an entry, exit, continuation, or reversal, and overbought and oversold conditions should not be inferred from Aroon alone without added context.
Is the Aroon Indicator Useful for Swing Traders?
The Aroon indicator is a technical analysis tool that helps swing traders identify trend structure and measure trend strength. Its main advantage is that it can identify trend shifts clearly in trending markets, though it is less decisive when price stays trapped in a narrow range.
The strongest signals usually combine sustained separation between Aroon Up and Aroon Down, a confirmed price break, consistent swing structure, and independent momentum evidence. Repeated crossovers inside a narrow range generally do less to confirm emerging trends and usually point to a weaker trading opportunity.
FAQ
What does Aroon Up at 100 mean?
Aroon Up at 100 means the highest high in the selected lookback period occurred on the latest candle. It indicates maximum recency but does not guarantee continued price appreciation. At 100, the aroon up line shows that most recent high happened on the latest candle and can support a strong bullish trend if that reading holds for an extended period.
What does an Aroon crossover mean?
When Aroon Up crosses above Aroon Down, it suggests recent highs are occurring more recently than recent lows; when Aroon Down crosses above Aroon Up, it suggests the reverse. These aroon signals may point to a new trend, but traders usually wait for further confirmation from the price chart.
Is the Aroon indicator leading or lagging?
The Aroon indicator is often used for early detection, but it is generally treated as a lagging indicator because it remains based on historical highs and lows. It may identify a structural change before slower indicators, although it cannot independently predict future price, and late signals are more common in fast-moving market conditions.
What is the difference between Aroon and MACD?
Aroon measures the time since recent highs and lows. MACD measures the relationship between exponential moving averages and is primarily used to evaluate trend momentum. A related single-line variant is the aroon oscillator, calculated by subtracting Aroon Down from Aroon Up, with the zero line serving as the key reference for interpreting shifts.
Can traders use the Aroon indicator alone?
Traders can use the Aroon indicator on its own, but it generally works better as part of broader trading strategies that use other indicators, since relying on it alone increases exposure to false signals. The aroon indicator works through two separate indicators, Aroon-Up and Aroon-Down, and is usually more reliable when paired with moving averages or similar confirmation tools. Price structure, momentum, support and resistance, and risk controls provide necessary context.







