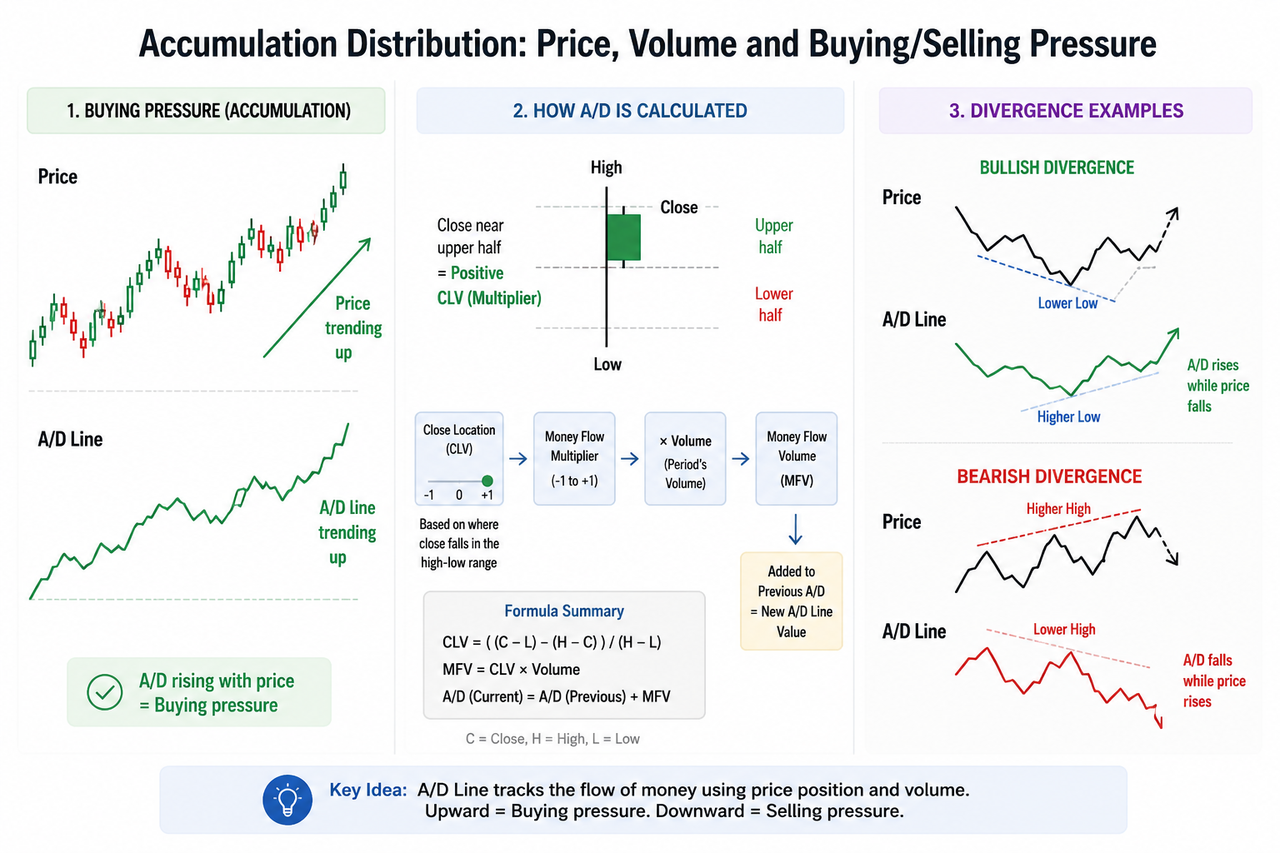
The Accumulation Distribution indicator, commonly called the A/D line or Accumulation Distribution Line, is a volume-based technical analysis tool that estimates buying and selling pressure by combining trading volume with where each period’s closing price sits inside its high-low range. An A/D line trending upward generally points to buying pressure, while a declining line points to selling pressure.
For traders trying to judge whether a price trend has meaningful volume behind it, that extra information can be useful. Unlike price-only indicators, A/D asks whether volume is occurring when price closes toward the upper or lower part of each trading range. It can therefore help with trend confirmation, identifying bullish or bearish divergences, and spotting situations where price movements and underlying money flow tell different stories.
The catch is that Accumulation Distribution doesn’t directly identify who is buying or selling, and it doesn’t guarantee a potential reversal. It estimates the general flow of money from price and volume data. That makes it most useful as confirmation alongside price action and other indicators rather than as a standalone trading signal.
Key Takeaways
The Accumulation Distribution Line tracks cumulative money flow by combining the closing position within each high-low range with the period’s trading volume.
An A/D line moving upward generally indicates buying pressure; a line moving downward suggests selling pressure.
Bullish divergence occurs when price makes lower lows while A/D rises or holds higher lows, suggesting underlying buying pressure may be improving.
Bearish divergence appears when price makes higher highs while A/D falls, which can reveal weakening volume support behind an upward trend.
A/D differs from On-Balance Volume (OBV) because it considers the close location inside the period’s range rather than simply whether the closing price rose or fell.
What Is the Accumulation Distribution Indicator?
The Accumulation Distribution indicator is a cumulative indicator developed by Marc Chaikin to measure the flow of money into and out of an underlying security. It uses both price and volume, rather than relying on price changes alone.
The underlying idea is straightforward. If an asset repeatedly closes near the upper half of its trading range on relatively higher volume, the activity is interpreted as accumulation, or stronger buying pressure. If it repeatedly closes near the bottom of its range, particularly on increased volume, the indicator interprets that activity as distribution and stronger selling pressure.
This doesn't mean every close near the high represents literal institutional or “smart money” buying. A/D can't identify individual market participants. Instead, it converts the relationship between the high, low, closing price, and volume of each period into a cumulative flow measure.
That distinction makes A/D useful when price alone leaves an incomplete picture. A rising market accompanied by a rising A/D line has better volume confirmation than one where price rises while A/D moves downward.
Trading volume itself provides context about how actively an asset is changing hands, and volume-based tools such as A/D, OBV, VWAP, and Chaikin Money Flow use that information in different ways. Gate Learn's explanation of trading volume and volume indicators
How the Accumulation Distribution Line Calculates Money Flow
The A/D calculation has three main parts: the Close Location Value, Money Flow Volume, and the cumulative A/D line.
Calculate the Close Location Value
The Close Location Value, also called the Money Flow Multiplier, measures where the closing price sits within the period’s high-low range:
If price closes exactly at the period high, the value approaches +1. If it closes at the period low, the value approaches -1. A close near the midpoint produces a value around zero.
The close was well inside the upper half of the range, so the multiplier is positive.
If the high and low are equal, implementations generally need to handle the zero denominator rather than applying the normal formula directly.
Calculate Money Flow Volume
Next:
Money Flow Volume = Money Flow Multiplier × Period Volume
If the previous example had trading volume of 10,000 units:
0.6 × 10,000 = 6,000
Higher volume therefore gives the period greater influence on the A/D line, while low volume has less impact.
The multiplier adjusts volume according to price position. A close near the high assigns more positive volume; a close near the low assigns more negative volume.
Build the Cumulative A/D Line
Finally:
Current A/D = Previous A/D + Current Money Flow Volume
Each new period is added to the previous cumulative total. This is why the indicator is called a cumulative line.
A/D rising over several periods indicates that positive Money Flow Volume is dominating. A falling cumulative line indicates that negative money flow is dominating.
Rather than focusing on the indicator’s absolute numerical value, traders normally pay more attention to its direction, trend changes, and relationship with price.
How Buying and Selling Pressure Appears on the A/D Line
An Accumulation Distribution Line trending upward suggests that volume is increasingly associated with closes toward the upper part of each period’s range. That is generally interpreted as buying pressure or accumulation.
A declining line suggests the opposite. More volume is being weighted toward closes in the lower part of the range, pointing to greater selling pressure or a distribution phase.
The clearest trend confirmation occurs when price and A/D move in the same direction:
Price Action
A/D Line
Common Interpretation
Moving upward
Moving upward
Upward trend has volume confirmation
Moving downward
Moving downward
Downward trend has volume confirmation
Moving upward
Moving downward
Possible bearish divergence
Moving downward
Moving upward
Possible bullish divergence
Moving sideways
Strong A/D trend
Buying or selling pressure may be changing before price breaks range
Trend confirmation isn't the same as prediction. If price and A/D are both trending upward, the indicator confirms that the recent price move has been accompanied by favorable money-flow readings. It doesn't establish how long the upward trend will last.
Price-oriented tools can add another layer. For example, an EMA can help identify trend direction, while A/D asks whether price and volume behavior support that trend. Similarly, Donchian Channels can define a trading range or breakout level while A/D helps judge whether underlying volume pressure agrees with the price move.
Bullish Divergence and Bearish Divergence in Accumulation Distribution
Divergence is one of the most common ways traders interpret the Accumulation Distribution indicator because it exposes situations where price and volume move in opposite directions.
Bullish Divergence
A bullish divergence occurs when price makes lower lows while the A/D line makes higher lows or begins moving upward.
Imagine a token falling from $100 to $92 and later making another low at $88. If A/D stops declining and instead forms a higher low, the second price decline isn't receiving the same degree of negative money-flow confirmation.
That can indicate hidden buying pressure or weakening selling pressure.
It is a potential reversal clue, not proof that price must rise. A trader may still look for price to reclaim resistance, break a downward trend line, or produce another bullish signal before drawing a stronger conclusion.
Bearish Divergence
A bearish divergence occurs when price makes higher highs while the A/D line makes lower highs or trends downward.
Suppose price advances from $100 to $115 and later reaches $120, but A/D peaks during the first advance and then falls. The higher price isn't being confirmed by the cumulative flow of volume.
That can be interpreted as underlying distribution or weakening buying pressure and may become a bearish signal if price action also starts deteriorating.
Divergence can persist for several periods, though. Acting on it immediately can create false signals because price may continue trending before an actual reversal develops.
Momentum indicators can provide a different confirmation layer. RSI measures the magnitude of recent price changes rather than cumulative volume flow, while Bollinger %B shows where price sits relative to volatility-adjusted Bollinger Bands.
Accumulation Distribution vs. On-Balance Volume
A/D and On-Balance Volume are both cumulative volume indicators, but they account for price differently.
OBV adds the entire period’s volume when the closing price is higher than the previous close and subtracts the entire volume when the close is lower. A/D instead examines the close location inside the current high-low range and weights volume using a multiplier between approximately -1 and +1.
Feature
Accumulation Distribution
OBV
Uses volume
Yes
Yes
Cumulative indicator
Yes
Yes
Uses current high-low range
Yes
No
Uses previous close to classify volume
No
Yes
Volume weighting
Variable from negative to positive
Entire volume added or subtracted
Main focus
Close location and money flow
Directional volume flow
This difference matters during unusual price action.
A cryptocurrency can gap downward from its previous closing level but finish the new period near the top of that period’s high-low range. OBV sees a lower close and subtracts volume. A/D may assign positive Money Flow Volume because the closing position is near the current bar’s high.
Neither interpretation is automatically correct. They measure different things.
That gap behavior is also one of A/D’s limitations: because its formula concentrates on the current period’s high, low, and close, it does not directly account for the size or direction of a gap from the previous period.
How Traders Use Accumulation Distribution in Practice
A/D works best as a confirmation tool rather than a mechanical instruction to buy or sell.
One practical approach is to identify the price trend first. A trader might use SMA, moving averages, support and resistance, or market structure to determine whether price is trending upward, downward, or moving sideways. A/D then shows whether cumulative money flow agrees with that direction.
For a breakout, the same principle applies. If price breaks above a Donchian Channel while A/D is also reaching higher levels, volume behavior supports the breakout. If price reaches a new high while A/D moves lower, confirmation is weaker.
Volatility tools answer a different question. ATR measures the size of price movement, while Keltner Channels place volatility-based envelopes around a moving average. A/D isn't a volatility indicator, so combining these tools can keep traders from asking one indicator to do several jobs.
For example, a trader analyzing Bitcoin can open the BTC/USDT market on Gate.com, compare the A/D line with price structure and trading volume, and check whether a breakout or pullback has corresponding money-flow confirmation. The indicator should inform the analysis rather than determine the trade by itself.
Limitations of the Accumulation Distribution Indicator
The first limitation is price gaps. A/D uses the current period’s high-low range, so a large gap between periods isn't directly incorporated into the Money Flow Multiplier. A gap down can therefore produce positive A/D flow if price subsequently closes near the top of the new period’s range.
Volume quality matters too. A sudden increase in reported trading volume can move the cumulative line sharply even when that activity isn't representative of a lasting trend. This is particularly relevant when comparing crypto markets across exchanges because reported volume and liquidity can differ between venues.
A/D can also lag. Because it is a cumulative indicator based on completed periods, trend changes may already be underway before the line creates a clear confirmation signal.
Sideways markets create another problem. When price closes repeatedly at different positions inside a narrow trading range, A/D may move up and down without producing a useful directional signal.
Finally, divergence doesn't specify timing. A bearish divergence may continue while price keeps rising, just as bullish divergence can persist throughout an extended downward trend. Combining A/D with price structure, MACD, moving averages, volatility indicators, or other tools can provide more context for informed trading decisions.
Conclusion
The Accumulation Distribution indicator tracks buying and selling pressure by weighting each period’s trading volume according to where the price closes within its high-low range and adding that Money Flow Volume to a cumulative total.
An A/D line moving in the same direction as price can confirm trend strength. A rising line against falling price creates bullish divergence, while a declining line against rising price creates bearish divergence and may reveal hidden weakness.
Its strongest use is confirmation. A/D provides information that price-only indicators can't because trading volume is built directly into the calculation, but it still can't identify actual buyers and sellers, predict reversal timing, or fully account for price gaps. Used with price action and complementary indicators, it can make the relationship between price movements and underlying volume pressure easier to interpret.
FAQ
Is Accumulation Distribution a leading or lagging indicator?
Accumulation Distribution is generally treated as a confirmation or cumulative volume indicator rather than a pure leading indicator. Divergence can sometimes appear before a price trend changes, but it doesn't reliably predict when a reversal will occur.
What does a rising Accumulation Distribution Line mean?
A rising A/D line indicates that positive Money Flow Volume is dominating, usually because price is repeatedly closing toward the upper portion of its trading range. This is commonly interpreted as increasing buying pressure or accumulation.
What does a falling A/D line mean?
A declining Accumulation Distribution Line indicates that negative Money Flow Volume is dominating. When price and A/D both fall, the indicator generally confirms selling pressure behind the downward trend.
What is the difference between A/D and Chaikin Money Flow?
Both use the same general Money Flow Volume concept associated with Marc Chaikin. A/D maintains a cumulative total across periods, whereas Chaikin Money Flow calculates money flow across a defined look-back window and normally oscillates around zero.
Can Accumulation Distribution identify smart money?
Not directly. The indicator can reveal patterns interpreted as accumulation or distribution, but price and trading volume don't identify whether activity came from institutions, whales, market makers, retail traders, or another group.
Is bullish divergence on A/D a buy signal?
Bullish divergence is evidence that selling pressure may be weakening, not an automatic buy signal. Price can continue falling after divergence develops, so traders commonly look for confirmation from price action, support levels, trend structure, or other indicators.
Disclaimer
This content is for educational and informational purposes only and does not constitute financial, investment, or trading advice. Technical indicators can generate false signals, and historical price or volume patterns do not guarantee future market performance.
Author: Jared
Disclaimer
* The information is not intended to be and does not constitute financial advice or any other recommendation of any sort offered or endorsed by Gate.
* This article may not be reproduced, transmitted or copied without referencing Gate. Contravention is an infringement of Copyright Act and may be subject to legal action.
DEX aggregators integrate order data, price information, and liquidity pools from multiple decentralized exchanges, helping users find the optimal trading path in the shortest time. This article delves into 8 commonly used DEX aggregators, highlighting their unique features and routing algorithms.
The report shows that in Q1 2026, the crypto market will reach a stage of structural maturity, with Derivative trading making up more than 90% of total trading volume, exceeding $20 trillion. As Spot demand weakens, liquidity will become even more concentrated in top exchanges, reflecting a more cautious market sentiment and a shift toward leveraged and institutional trading.