For crypto traders, tracking Ichimoku cloud thickness helps assess support, resistance, and potential trend shifts before making trading decisions.
Key Takeaways
-
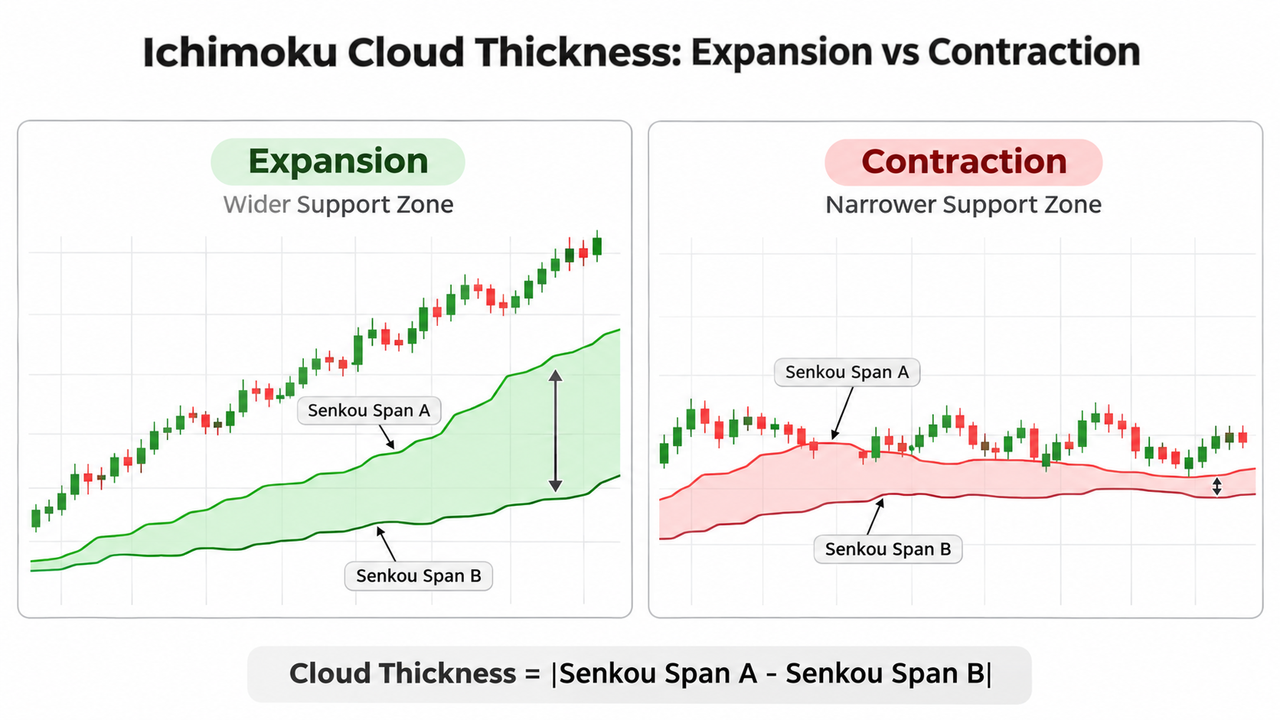
Ichimoku cloud thickness equals the absolute difference between Senkou Span A and Senkou Span B.
-
Cloud expansion occurs when the spans diverge, potentially reflecting stronger directional conditions or wider historical price ranges.
-
Cloud contraction occurs when the spans converge, sometimes preceding consolidation, breakouts, or trend reversals.
-
A thick cloud may represent a wider dynamic support or resistance zone, while a thin cloud offers a narrower barrier.
-
Trend direction, price action, and momentum should confirm changes in cloud thickness before generating trading signals.
What Is Ichimoku Cloud Thickness and How Does It Change?
Ichimoku cloud thickness measures the vertical distance between the two leading spans forming the Kumo, or cloud.
The Ichimoku Cloud indicator, also called Ichimoku Kinko Hyo or the one look equilibrium chart, combines trend direction, momentum, and support and resistance into one technical analysis system.
Unlike conventional moving averages, which commonly use closing prices, Ichimoku calculations primarily use the midpoint of the highest high and lowest low across specified periods.
Two boundaries determine cloud thickness:
-
Leading Span A (Senkou Span A): The average of the Conversion Line and Base Line, plotted 26 periods forward.
-
Leading Span B (Senkou Span B): The midpoint of the highest high and lowest low over 52 periods, also plotted 26 periods forward.
The space between these boundaries forms the cloud.
When they diverge, the cloud expands. When they converge, it contracts.
A large or thick cloud often represents a broader potential support or resistance zone. A thin cloud may indicate weaker structural separation, although thickness alone cannot establish whether a level will hold.
Importantly, cloud expansion isn't a direct volatility reading like the Average True Range (ATR). It reflects differences between historical price-range midpoints, which can widen during sustained market movements.
Key Components: Conversion Line, Base Line, Leading Span B, and Lagging Span
The Ichimoku cloud indicator uses five components, traditionally calculated with 9, 26, and 52-period settings.
| Component |
Calculation |
Purpose |
| Conversion Line (Tenkan-sen) |
9-period highest high and lowest low midpoint |
Short-term momentum |
| Base Line (Kijun-sen) |
26-period highest high and lowest low midpoint |
Medium-term equilibrium |
| Leading Span A |
Average of Tenkan-sen and Kijun-sen |
Faster cloud boundary |
| Leading Span B |
52-period highest high and lowest low midpoint |
Slower cloud boundary |
| Lagging Span (Chikou Span) |
Current closing price plotted 26 periods back |
Historical trend confirmation |
Both leading spans are plotted 26 periods forward, creating a projected structure for potential future support and resistance.
The lagging span compares the current closing price against past prices. It can help confirm trend direction, although it doesn't independently predict future price moves.
These conventional calculations are documented in Fidelity's Ichimoku Cloud reference.
How to Calculate Ichimoku Cloud Thickness
Cloud thickness is calculated using:
Cloud Thickness = |Senkou Span A − Senkou Span B|
The absolute value keeps thickness positive regardless of whether the cloud is bullish or bearish.
For example, suppose the leading spans at one calculation point are:
-
Senkou Span A = $102
-
Senkou Span B = $98
-
Cloud thickness = $4
At the next calculation point, Span A increases to $105 while Span B remains $98.
The cloud expands to $7.
A later reading of $103 and $100 produces a $3 thickness, indicating contraction.
To compare different assets or price levels, normalize the measurement:
Normalized Thickness (%) = (Cloud Thickness ÷ Current Price) × 100
If BTC trades at $100,000 and its cloud measures $2,000, normalized thickness equals 2%.
This makes comparisons more meaningful than raw dollar differences.
The catch is that cloud thickness changes with timeframe, settings, and historical price ranges. Compare equivalent chart intervals and align the spans by their calculation period or displayed position consistently.
How to Compare Ichimoku Cloud Expansion and Contraction Across Trends
Cloud thickness becomes more informative when combined with price position and cloud direction.
Step 1: Identify Trend Direction Using the Ichimoku Cloud
Start by determining where price trades relative to the cloud.
-
Above the cloud: Generally indicates a bullish trend.
-
Below the cloud: Generally indicates a bearish trend.
-
Inside the cloud: Often suggests consolidation or market indecision.
A green cloud forms when Senkou Span A is above Span B, while a red cloud forms when Span A falls below Span B.
Cloud color describes the relationship between the spans, not necessarily the current price trend.
Step 2: Compare Cloud Expansion and Contraction
Observe thickness changes across consecutive candles.
| Market condition |
Cloud behavior |
Possible interpretation |
| Bullish trend |
Green cloud expanding |
Widening bullish structure |
| Bearish trend |
Red cloud expanding |
Widening bearish structure |
| Trend losing momentum |
Cloud contracting |
Reduced separation between spans |
| Sideways market |
Thin, frequently twisting cloud |
Market indecision and potential false signals |
| Potential reversal |
Contraction followed by a cloud twist |
Changing historical trend structure |
An expanding green cloud alongside rising prices may support bullish momentum. An expanding red cloud below falling prices may reflect bearish sentiment.
Still, expansion can persist after momentum has peaked. Historical calculations naturally lag sudden market changes.
Step 3: Check the Conversion Line and Base Line Crosses
A bullish TK cross occurs when the Conversion Line crosses above the Base Line. A bearish TK cross occurs when it crosses below.
A bullish cross above the cloud generally carries stronger trend-following context than one occurring inside a choppy cloud.
The same applies in reverse for bearish signals.
Crosses become more useful when supported by MACD momentum comparisons or observable changes in price structure.
Step 4: Watch for a Cloud Twist and Price Breakout
A cloud twist, or Kumo Twist, happens when Senkou Span A crosses Senkou Span B.
This changes cloud color from green to red or red to green.
A bullish breakout occurs when price breaks above the cloud. A bearish breakdown occurs when price moves below it.
Neither guarantees a trend reversal.
A cloud twist following prolonged contraction may signal changing market dynamics, but traders should also examine breakout confirmation and retests.
How Cloud Thickness Helps Identify Future Support and Key Support Levels
A thick cloud often creates a wider potential support or resistance area, especially in trending markets.
For example, a trader monitoring the BTC/USDT spot chart on Gate.com might observe Bitcoin approaching the upper boundary of a thick red cloud.
That cloud could act as dynamic resistance, with both leading spans identifying different price levels where selling pressure might emerge.
A thin cloud creates a narrower zone. Price may cross it more easily, but a thinner cloud doesn't guarantee a successful breakout.
Combining cloud boundaries with validated support and resistance levels can provide stronger context than relying on cloud thickness alone.
Ichimoku Cloud vs Moving Averages for Identifying Trends
Ichimoku offers a more complete view of trend direction, momentum, and projected support or resistance than a single moving average.
Traditional moving averages are simpler and easier to interpret. Ichimoku's multiple components can help filter some market noise, although its added complexity may also create conflicting signals.
The difference becomes clearer when comparing linear regression and Ichimoku Cloud trend analysis: regression measures statistical trend direction, while Ichimoku combines several historical price relationships.
Neither consistently predicts overbought or oversold conditions. Momentum oscillators are more directly suited to those readings.
Limitations of Ichimoku Cloud Thickness in Choppy Markets
Cloud expansion isn't always evidence of a strong trend.
A widening cloud can result from earlier volatility rather than current buying or selling pressure. Similarly, contraction doesn't automatically predict a reversal.
In sideways ranges, repeated TK crosses and cloud twists can produce false signals.
Three precautions matter:
-
Compare thickness across consistent timeframes and indicator settings.
-
Confirm trend strength with price action, volume, or ADX readings.
-
Test interpretations through crypto paper trading before risking capital.
Using multiple timeframe confirmation can also reveal whether a contracting lower-timeframe cloud represents a temporary pause within a larger trend.
Conclusion
Comparing Ichimoku cloud expansion and contraction helps traders assess changes in trend structure, momentum, and potential support or resistance.
Expanding clouds indicate widening separation between the leading spans; contracting clouds indicate convergence. The strongest interpretation comes from combining thickness with price position, TK crosses, and broader market conditions.
Cloud thickness remains a historical technical indicator, not a guarantee of future direction.
Frequently Asked Questions
Does a thicker Ichimoku Cloud indicate a stronger trend?
Not necessarily. A thick cloud suggests a wider potential support or resistance zone, but trend strength also depends on price direction, momentum, and market participation.
What does Ichimoku Cloud contraction mean?
Cloud contraction occurs when Senkou Span A and Senkou Span B move closer together. It may reflect consolidation, narrowing historical price-range differences, or changing trend conditions.
Can a cloud twist predict a trend reversal?
A cloud twist signals that the leading spans have crossed. It may accompany a reversal, but traders generally need price action and momentum confirmation.
Is cloud thickness more reliable on higher timeframes?
Higher timeframes may reduce some short-term noise, but they respond more slowly to market changes. No timeframe consistently eliminates false signals.
What happens when price breaks through a thin cloud?
A break through a thin cloud can suggest a potential change in trend direction. Confirmation from closing prices, volume, and nearby support or resistance helps distinguish a sustained breakout from a false move.
Disclaimer: Technical indicators use historical market data and cannot guarantee future results. Cryptocurrency trading involves volatility and potential financial loss.