For traders deciding when to enter, the important difference is between a temporary price break and a level that buyers or sellers continue defending. Volume, candlestick patterns, and clear invalidation levels help make that distinction.
Key Takeaways
-
Breakout confirmation involves a candle closing beyond support or resistance, followed by evidence that price can hold the broken level.
-
The break and retest pattern waits for price to return to the breakout point before considering an entry.
-
High breakout volume, declining volume during the pullback, and renewed momentum strengthen confirmation.
-
Bullish and bearish breakout setups use the same logic but reverse the direction of price movement.
-
False breakouts remain possible, making stop-loss placement, position sizing, and risk management essential.
What Is Breakout Confirmation in Breakout Trading?
A price breakout occurs when an asset moves beyond a recognized support level, resistance level, trend line, or established trading range.
Support represents an area where buying interest may slow a decline, while resistance represents an area where selling pressure may limit an advance. These levels are usually zones rather than exact prices, as described in CME Group's explanation of support and resistance.
A bullish breakout happens when price moves above resistance. A bearish breakout happens when price falls below support.
However, price crossing a level isn't sufficient evidence of a genuine breakout. A candle may briefly trade beyond resistance and close below it, creating a false signal.
Breakout confirmation examines whether market participants can sustain price movements beyond the key level.
Three observations matter:
-
A completed candle closes beyond the breakout level.
-
Trading volume and momentum support the initial move.
-
Price holds the broken level during a subsequent retest.
The third condition separates a basic breakout signal from a retest strategy.
How the Break and Retest Pattern Works
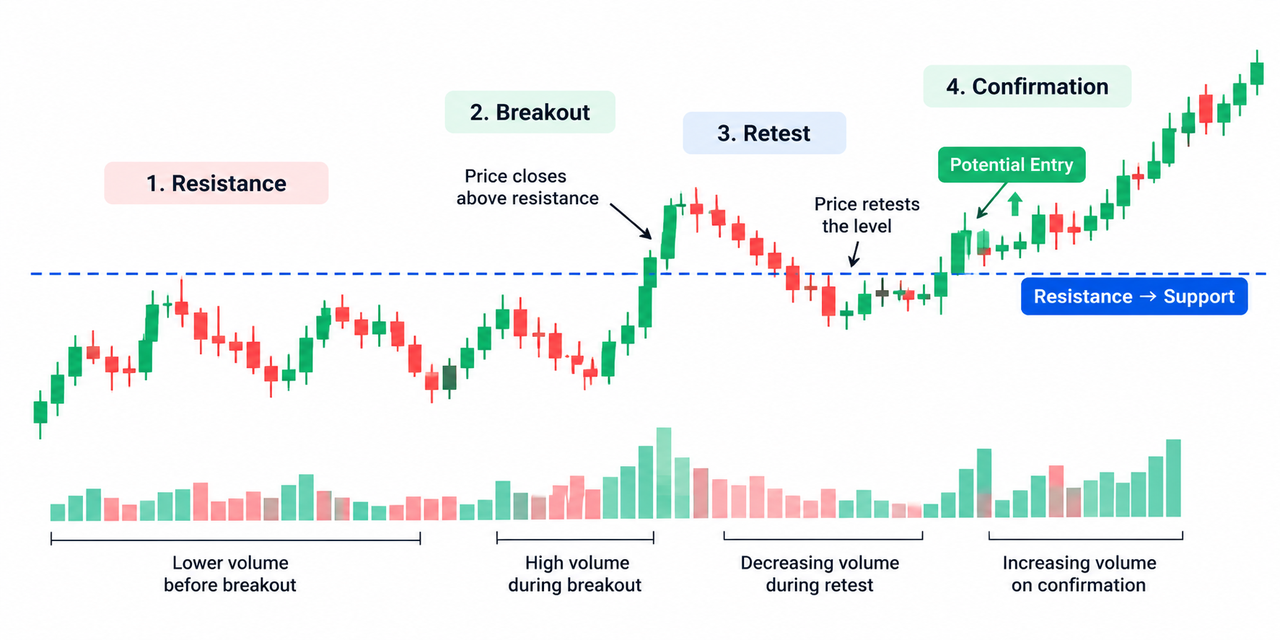
A break and retest pattern forms when price breaks a significant level, pulls back toward it, and then attempts to continue in the original breakout direction.
The logic comes from market psychology. After a bullish break, traders who missed the initial move may look for an entry near previous resistance. Meanwhile, existing holders may defend that price level.
Former resistance can become new support. The reverse applies after a bearish break, when previous support may become resistance.
A typical bullish sequence looks like this:
Resistance → Breakout → Pullback → Support Retest → Bullish Confirmation
For a bearish breakout:
Support → Breakdown → Upward Retest → Resistance Confirmation → Bearish Continuation
Not all breakouts produce retests. Strong momentum sometimes carries price away without returning to the breakout point.
Waiting can mean missing a trade, but entering too early creates exposure to false breakouts.
How to Confirm a Breakout With a Retest Before Entry
Step 1: Identify Key Support and Resistance Levels
Start by identifying price levels that previously caused repeated reversals, consolidations, or significant reactions.
Horizontal highs and lows, trend lines, and previous trading ranges can help establish the breakout point.
Strong levels usually reflect repeated market interaction rather than one isolated candle.
A trader can use support and resistance validation to distinguish meaningful price zones from temporary fluctuations.
Higher timeframes, such as four-hour and daily charts, generally contain less short-term noise than five-minute charts. However, they produce fewer signals and require wider stops.
Step 2: Wait for a Confirmed Bullish Break or Bearish Break
Once price reaches the key level, wait for a completed candle to close beyond it.
A bullish break requires a close above resistance. A bearish break requires a close below support.
A candle wick crossing the level without a supporting close is weaker evidence.
The breakout should also fit the broader market context. Movement aligned with the prevailing trend may have stronger follow-through than a breakout moving against the dominant trend.
Step 3: Check Volume and Momentum
A valid breakout often attracts increased trading participation.
Compare breakout volume with average volume over a consistent lookback period, such as 20 candles.
Above-average volume strengthens the signal, while low volume raises questions about participation. This interpretation is consistent with Charles Schwab's research on volume confirmation.
During a healthy retest, volume may decline as price pulls back, then increase when price bounces.
Traders can combine volume and ATR analysis to evaluate whether the initial move has meaningful participation and volatility.
Momentum indicators, including RSI and MACD, provide additional confirmation signals. They should support price action rather than replace it.
Step 4: Wait for the Retest Pattern
After the breakout occurs, watch whether price returns toward the broken level.
In a bullish setup, former resistance should begin acting as support. In a bearish setup, previous support may become resistance.
A retest doesn't need to touch the exact breakout price. Markets often react within a narrow zone.
For example, price might briefly move below newly established support before recovering. A single wick does not necessarily invalidate the setup.
Repeated candle closes back inside the previous range are more concerning.
Step 5: Confirm Price Action Before Entry
The retest becomes more meaningful when a completed candle shows rejection of the broken level.
Common candlestick confirmation signals include:
-
Bullish pin bar: A long lower wick suggests buyers rejected lower prices.
-
Bullish engulfing candle: Buying pressure overcomes the previous bearish candle.
-
Bearish rejection candle: An upper wick suggests sellers defended former support.
-
Continuation candle: Price closes in the breakout direction after testing the level.
A strong confirmation candle indicates that buyers or sellers may be defending the level, but the interpretation remains probabilistic.
Some traders wait for price to exceed the confirmation candle's high or low before considering an entry.
Breakout Trading Strategies: Entry and Exit Points
Consider a hypothetical BTC/USDT breakout setup.
Bitcoin consolidates below resistance at $70,000, then closes above it with elevated volume.
Price subsequently pulls back toward $70,000, forms a bullish rejection candle, and starts moving higher.
| Trading component |
Illustrative level |
| Breakout resistance |
$70,000 |
| Confirmed entry point |
$70,200 |
| Stop-loss |
$69,600 |
| Risk per BTC |
$600 |
| Profit target |
$71,400 |
| Risk-reward ratio |
1:02 |
The figures are hypothetical, not current market prices or trading recommendations.
For a live chart comparison, a trader using Gate.com's spot markets can examine BTC/USDT price action, volume, and nearby support zones before evaluating a retest setup.
Risk management begins with the invalidation level. For bullish setups, a stop-loss is commonly positioned below the retest support zone; bearish setups generally place it above resistance.
The Average True Range (ATR) can help account for normal price fluctuations when evaluating stop distance.
Some traders use 1:2 as a minimum planned risk-reward ratio and limit intended risk to 1–2% of trading capital per position. These are conventions, not universal rules.
Why False Breakouts Happen and How to Avoid False Signals
False breakouts happen when price temporarily crosses a level but reverses before establishing sustained movement.
Common warning signs include low breakout volume, immediate reversals, weak follow-through, and candles repeatedly closing inside the previous range.
Sharp price movements during periods of high volatility can also trap retail traders who react to the initial move.
A failed breakout may be particularly disruptive when institutional traders and other market participants are adjusting positions around widely watched levels.
Waiting for a retest reduces dependence on the initial price spike. It does not eliminate false signals.
Comparing trend strength with ADX and SuperTrend may help identify weak directional conditions.
Limitations of Break and Retest Trading Strategies
Retest setups can fail even when volume, candle closes, and momentum initially look convincing.
A breakout may reverse because market liquidity changes, selling pressure increases, or new information alters expectations.
Lower timeframes frequently produce noisy retests. Higher timeframes can provide clearer structure but require patience and potentially larger stop distances.
Stop-loss orders also cannot guarantee an exact exit price. FINRA's guidance on stop orders explains how rapid market movements can produce executions at prices different from the intended stop.
Every trader must evaluate position size, transaction costs, slippage, and their own risk tolerance.
Conclusion
Breakout confirmation through a retest focuses on whether price can defend a newly broken support or resistance level before an entry is considered.
A candle close beyond the level, meaningful trading volume, a controlled pullback, and renewed price action provide a stronger combined signal than the initial breakout alone.
The catch is that some legitimate breakouts never retest, while apparently successful retests can still fail. The strategy works best as a structured decision process, not a prediction of future results.
Frequently Asked Questions
How do you confirm a breakout before entering a trade?
Wait for a candle to close beyond support or resistance, assess volume, and observe whether price holds the broken level during a retest. A confirming candlestick strengthens the setup, although it does not guarantee success.
Waiting for a retest can reduce exposure to false breakouts and provide a clearer invalidation level. However, immediate breakout entries may capture moves that never pull back.
What happens when a breakout fails after the retest?
A failed breakout occurs when price returns into the previous trading range and cannot sustain movement in the breakout direction. This can invalidate the original setup and trigger predefined risk controls.
Which timeframe works best for breakout confirmation?
Four-hour and daily charts often provide clearer structural levels, while shorter timeframes produce more frequent setups and additional noise. The appropriate timeframe depends on the trading strategy and acceptable risk.
Can breakout confirmation work without high volume?
Yes. Some legitimate breakouts develop with moderate volume, particularly in less liquid markets. However, unusually low participation combined with weak follow-through generally provides less convincing confirmation.
Does a successful retest guarantee a new trend?
No. A retest shows that a price level has attracted a reaction, but broader conditions may still change. As the SEC's investor bulletin on performance claims explains, past performance cannot reliably predict future results.
Disclaimer
Cryptocurrency trading involves substantial risk, including volatility, slippage, liquidity constraints, and potential loss of capital. Technical indicators, historical patterns, and breakout trading strategies do not guarantee future results. Traders should assess their own financial circumstances, risk tolerance, and applicable legal requirements before making trading decisions.