For day traders and swing traders, this approach provides broader market context, although agreement between charts doesn't guarantee a successful trade.
Key Takeaways
-
Multiple timeframe analysis combines higher, intermediate, and lower charts to assess market direction, price structure, and entry signals.
-
The higher timeframe identifies the primary trend, while shorter charts help locate potential entry and exit points.
-
Using three timeframes can simplify market analysis and reduce conflicting signals.
-
Aligning price action, support and resistance levels, and momentum across timeframes may improve trade selection.
-
Risk management remains necessary because volatile crypto markets can produce false breakouts even when multiple charts agree.
What Is Multiple Timeframe Trading?
Multiple timeframe trading is a technical analysis method that examines price action over different periods to identify trends, potential reversals, and trading opportunities.
A timeframe refers to the period represented by each candle. On a daily chart, one candle covers one day, while a 1-hour chart displays hourly price movements.
The same cryptocurrency might appear bullish on a 15-minute chart but bearish on the weekly chart. Neither observation is necessarily incorrect. Each reflects a different part of the market's price movement.
Multi time frame analysis connects these observations. Instead of relying on a single chart, traders consider the broader trend, market structure, and shorter-term momentum before making trading decisions.
For example, a short-term price rally may occur within a larger downtrend. Confirming trend strength through price, volume, and momentum helps distinguish sustained buying pressure from temporary upward movement.
How Multi Timeframe Analysis Works
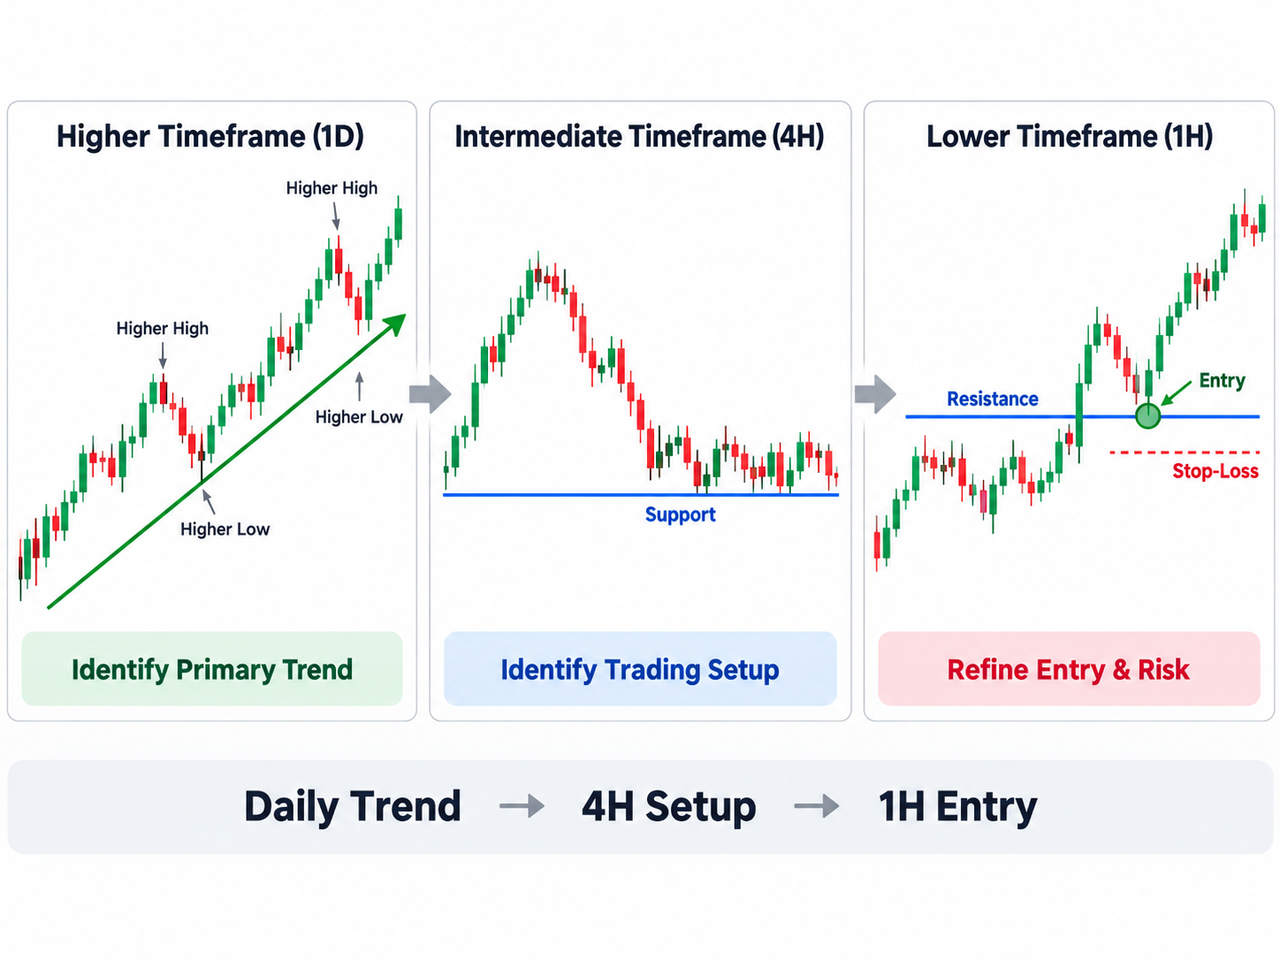
Multiple time frame analysis generally follows a top-down approach, starting with the higher timeframe and moving toward smaller charts.
| Timeframe |
Main purpose |
What traders examine |
| Higher timeframe |
Identify the primary trend |
Overall direction, major support and resistance |
| Intermediate timeframe |
Locate trading setups |
Pullbacks, ranges, market structure shifts |
| Lower timeframe |
Refine execution |
Entry signals, breakout retests, stop-loss placement |
Higher Timeframe: Identify the Primary Trend
The higher timeframe establishes whether the broader market is trending upward, downward, or sideways.
Traders examine higher highs, higher lows, moving averages, and major price levels.
For example, a daily chart showing successive higher highs suggests an upward daily trend, even when the hourly charts experience temporary declines.
A bullish daily chart can still conflict with a bearish weekly chart. The timeframe matching the intended holding period should guide the primary trading bias rather than assuming every short-term signal is equally important.
The intermediate timeframe helps identify trading ranges, corrections, and potential shifts in market structure.
Suppose Bitcoin remains in a daily uptrend but begins consolidating on the 4-hour chart. Traders may observe whether buyers continue defending key support or whether price breaks below the consolidation range.
Validating support and resistance levels through repeated price reactions can help distinguish established trading zones from temporary fluctuations.
Lower Timeframe: Fine-Tune Entries
The lower timeframe acts as the entry chart.
A trader might wait for a bullish reversal candle, rising volume, or a confirmed resistance breakout before considering an entry.
A breakout confirmation and retest may provide additional evidence that buyers are defending a previously established resistance level.
The catch is that smaller timeframes contain more market noise. A strong-looking entry signal may quickly fail if it contradicts the broader trend.
Which Different Timeframes Work Best for Crypto Trading?
The appropriate timeframe combination depends on trading style, expected holding period, and execution speed.
| Trading style |
Higher timeframe |
Intermediate timeframe |
Entry timeframe |
| Scalping |
30-minute |
15-minute |
5-minute |
| Day trading |
4-hour |
1-hour |
15-minute |
| Swing trading |
Weekly |
Daily |
4-hour |
| Position trading |
Monthly |
Weekly |
Daily |
These are illustrative combinations rather than fixed rules.
Scalping typically requires fast execution and precise market entries. Day traders often concentrate on hourly charts and intraday movements, while swing traders hold positions for several days or weeks.
For intraday trading, the 30M, 15M, and 5-minute combination can work as a structured hierarchy. The 30-minute chart establishes direction, the 15-minute chart identifies a potential setup, and the 5-minute chart helps pinpoint entry timing.
Shorter timeframes generate more frequent signals, but they don't necessarily create better opportunities. Traders should also consider liquidity, spreads, and price volatility.
How to Use Multiple Timeframes for Crypto Trading: Practical Example
Consider a hypothetical BTC/USDT setup. A trader using the BTC/USDT spot market on Gate.com can examine the same trading pair across different chart periods.
Step 1: Identify the Daily Trend
Suppose Bitcoin trades near $70,000 while the daily chart shows higher highs and higher lows.
Major support appears near $68,000, suggesting a bullish higher-timeframe bias.
Step 2: Check the 4-Hour Market Structure
The 4-hour chart shows a pullback toward $69,000 followed by consolidation.
Buyers begin defending this zone, but the setup remains unconfirmed.
Step 3: Confirm the 1-Hour Entry
On the 1-hour chart, price breaks above hypothetical resistance at $69,500 and successfully retests the level.
Increasing trading volume provides additional confirmation, although a false breakout remains possible.
Step 4: Define Risk and Exit Levels
Assume the following hypothetical trade parameters:
| Parameter |
Price |
| Entry |
$69,600 |
| Stop-loss |
$68,900 |
| Take-profit |
$71,000 |
| Risk per BTC |
$700 |
| Potential reward per BTC |
$1,400 |
| Reward-to-risk ratio |
2:01 |
The stop-loss should reflect where the trading setup becomes invalid, while position sizing determines the amount of capital exposed.
This example illustrates how higher-timeframe direction and lower-timeframe execution can work together. It isn't a price forecast or trading recommendation.
How to Combine Technical Indicators Across Multiple Timeframes
Technical indicators can support multi timeframe analysis when each serves a distinct purpose.
A moving average on the higher timeframe can help identify the broader trend. The intermediate chart might use the relative strength index (RSI) to assess momentum, while the lower chart focuses on price action and volume.
For example, an RSI and MACD strategy can provide momentum confirmation, but neither indicator should replace the underlying market structure.
During volatile market conditions, the average true range (ATR) can help estimate typical price fluctuations and assess whether a stop-loss is unusually tight.
Adding numerous indicators that measure similar movements can create redundant signals rather than independent confirmation.
Risk Management: Key Support, False Signals, and Market Conditions
Multiple timeframe analysis provides broader context, but it cannot eliminate trading losses.
Crypto markets can reverse quickly because of unexpected news, changing liquidity, or leveraged liquidations. Even aligned timeframes may produce misleading signals during sudden volatility.
Traders should establish invalidation levels, account for trading fees and slippage, and avoid excessive leverage. Stop-loss orders may also execute at worse prices than expected during rapid market moves.
The Commodity Futures Trading Commission warns that virtual currency markets involve substantial risks, including volatility and leveraged losses.
Common Mistakes in Multiple Timeframe Analysis
Using too many timeframes can cause analysis paralysis. Traders may find conflicting signals without establishing which chart should guide their decisions.
Other common mistakes include:
-
Ignoring the long-term trend while reacting to short-term candles.
-
Combining mismatched timeframes that don't suit the holding period.
-
Entering before a breakout or candle close confirms the setup.
-
Overtrading whenever smaller timeframes generate new signals.
-
Assuming aligned technical indicators guarantee a successful trade.
A consistent three-timeframe hierarchy can reduce unnecessary complexity, although the trading strategy still needs to adapt to changing market conditions.
Conclusion
Multiple timeframe trading separates market direction, setup identification, and execution across different charts. Higher timeframes establish context, intermediate charts reveal trading structure, and lower timeframes help refine entry points.
The method is particularly useful when short-term price action appears inconsistent with the broader trend. Still, timeframe alignment should support trading decisions rather than replace risk management or guarantee future performance.
FAQ
How many timeframes should traders use?
Three timeframes are a common starting point: one for the primary trend, another for market structure, and a third for execution. Additional charts may help certain strategies but can introduce conflicting signals.
Is multiple timeframe trading suitable for beginners?
Yes. Beginners can use daily, 4-hour, and 1-hour charts to understand market direction before examining shorter-term entries. A consistent process is generally easier to follow than switching between numerous intervals.
What happens when higher and lower timeframes disagree?
Conflicting signals may indicate a temporary correction, consolidation, or developing reversal. Traders can prioritize the timeframe relevant to their holding period, wait for additional confirmation, or avoid the setup.
Can multiple timeframe analysis reduce false signals?
It may filter some weak signals by checking whether lower-timeframe setups agree with the broader market trend. However, alignment doesn't establish a guaranteed success rate or prevent losses.
Does multiple timeframe trading work in sideways markets?
Yes, but its application changes. Higher charts can identify trading range boundaries, while lower charts help observe reactions near support and resistance. Trend-following signals can become less reliable during consolidation.
Disclaimer
This content is for educational purposes only and does not constitute investment advice. Cryptocurrency trading involves substantial risks, including rapid price movements and potential capital losses. Technical indicators, historical patterns, and past performance do not guarantee future results. Trading restrictions and product availability may vary by jurisdiction.