For crypto traders planning entries and exits, this distinction matters. A level that looks convincing on a chart can fail within minutes. Knowing how to validate strong support and resistance levels helps traders avoid weak setups, recognize false breakouts, and manage risk before committing capital.
Key Takeaways
-
Support forms where buying interest may slow a price decline, while resistance develops where selling pressure may limit an advance.
-
Historical price reactions, repeated tests, and higher-timeframe alignment help identify significant support and resistance levels.
-
Candlestick rejection, volume confirmation, and successful retests provide stronger evidence than a price touch alone.
-
Support and resistance work better as price zones than as exact horizontal lines.
-
Strong levels can still fail, so traders should define invalidation points, stop-loss placement, and profit targets before entering.
What Makes Support and Resistance Levels Strong?
Support and resistance levels represent areas where market participants have previously shown enough buying interest or selling pressure to influence price movement.
A support level acts like a psychological floor. Buyers may perceive the asset as undervalued at that price, increasing demand and slowing further declines.
Resistance behaves like a psychological ceiling. As price reaches a familiar high, traders may take profits or place sell orders, creating selling pressure.
These reactions reflect collective market psychology, not fixed barriers.
According to CME Group's support and resistance education, previous highs and lows, trend lines, moving averages, and significant price levels can all establish potential support or resistance areas.
A level becomes more meaningful when several independent observations support it.
For example, a historical resistance zone that also aligns with a previous daily high and increased trading volume deserves more attention than an isolated price touch.
However, repeated tests don't guarantee strength. Each test can also consume resting liquidity, eventually making a level easier to break.
How to Identify Support and Resistance Using Historical Price Data
Historical price data provides the starting point for identifying key levels. Rather than drawing lines through every minor swing, focus on areas where price movement noticeably changed direction.
Step 1: Find Support and Resistance at Previous Price Highs and Lows
Start with a daily or four-hour price chart.
Look for swing highs where upward movement stopped and swing lows where a price decline reversed. These points reveal areas where buyers or sellers previously influenced the market.
For intraday trading, the daily high and low can establish broader boundaries, while session highs and lows identify more immediate reference points.
Give more weight to clearly visible turning points than minor price fluctuations.
Step 2: Draw Support and Resistance Zones Around Reactions
Support and resistance rarely occur at one exact price.
Suppose BTC repeatedly rebounds between $64,800 and $65,100. Marking that entire area as potential support is more useful than drawing a single line at $65,000.
Apply the same approach to resistance zones where several candle highs or closing prices cluster.
Horizontal levels are useful in sideways markets, while trend lines can identify rising support or declining resistance.
Psychological anchors such as $60,000 or $70,000 may also attract attention because traders often cluster orders around round numbers.
Step 3: Check Multiple Trading Timeframes
Higher-timeframe levels generally carry more weight because they reflect broader market structure.
A resistance area visible on the daily chart may matter more than a temporary ceiling on a five-minute chart.
A practical approach is to identify major levels on the daily chart, refine zones on the four-hour chart, and observe entry signals on the 15-minute chart.
The purpose is alignment, not requiring every timeframe to produce identical signals.
How to Validate a Price Level Using Price Action
Finding a potential level is only the first stage. Validation depends on how price behaves when it returns.
Look for Rejection Candlesticks
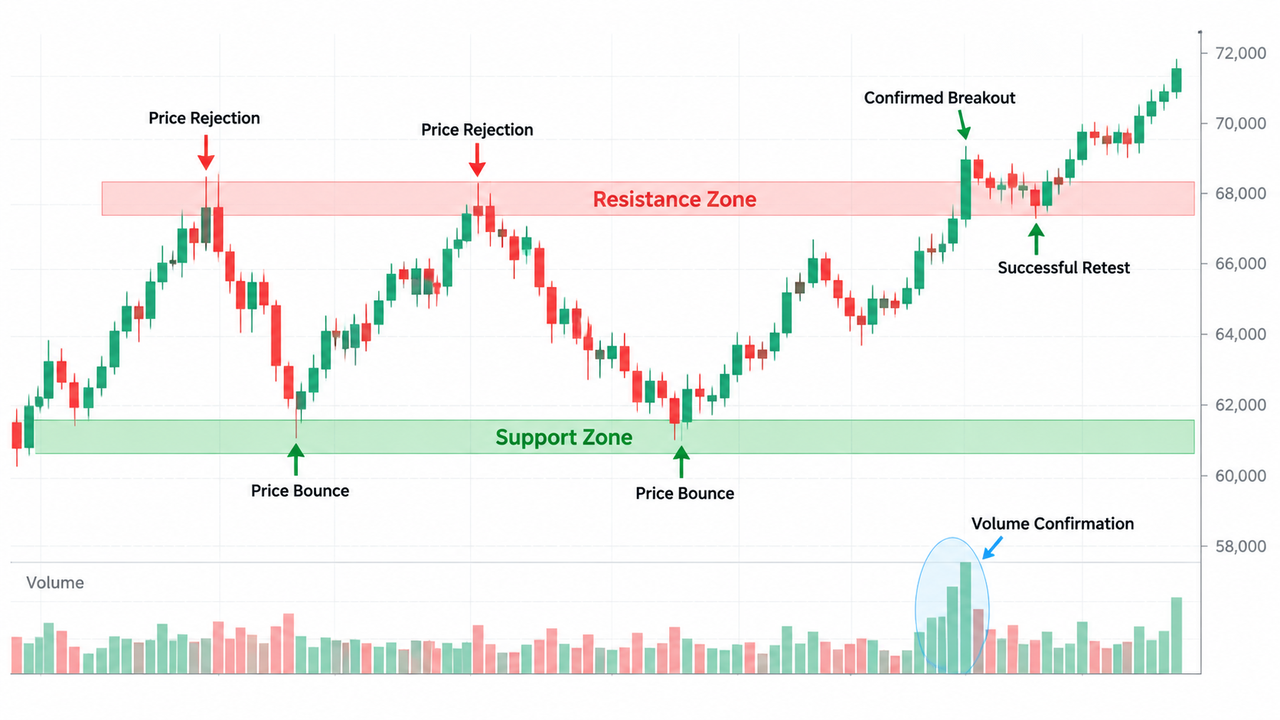
A long lower wick near support can indicate that buyers absorbed selling pressure and pushed price upward.
At resistance, a long upper wick may indicate rejection by sellers.
Bullish engulfing patterns, bearish engulfing patterns, and other reversal candlesticks can provide additional context.
However, a wick alone isn't sufficient confirmation. Waiting for a candle to close and observing whether subsequent price action supports the rejection can reduce premature entries.
The price action trading approach emphasizes market structure and actual price reactions rather than relying exclusively on indicator signals.
Confirm the Reaction With Trading Volume
Volume helps distinguish meaningful participation from relatively weak price movement.
A support bounce accompanied by expanding trading volume may indicate stronger buying pressure. A resistance rejection with elevated volume can suggest active selling.
Volume should be compared with recent bars on the same timeframe.
A volume spike doesn't prove that a level will hold, especially when aggressive buying or selling continues through the zone.
Traders can use volume indicators to assess whether participation is increasing or fading.
Check Confluence With Moving Averages
Moving averages can act as dynamic support or resistance because their values change as prices evolve.
For example, a historical support zone near the 50-period EMA may attract additional attention during an uptrend.
CME Group's moving average education describes how different moving average periods can help traders assess shorter-term and longer-term support or resistance.
Other useful references include pivot points, Fibonacci retracements, and VWAP.
The pivot points and Fibonacci retracement approach can help identify overlapping price zones, but indicators derived from similar historical prices aren't necessarily independent confirmation.
What Happens When Price Breaks Previous Support or Resistance?
A price break can signal a change in market structure, but not every breakout becomes a sustained trend.
Previous resistance may become new support after price moves above it. Similarly, old support can turn into resistance following a breakdown.
The most useful confirmation often comes from a retest.
Consider this hypothetical BTC setup:
-
BTC repeatedly encounters resistance between $68,000 and $68,200.
-
Price closes above $68,200 with elevated volume.
-
BTC returns toward the former resistance zone.
-
Buyers defend the area and price begins making higher lows.
-
The zone becomes potential new support.
A successful retest adds credibility because the market has demonstrated buying interest after the breakout.
The catch is that a breakout followed by a quick return below resistance can indicate a false breakout or liquidity sweep.
This is why breakout indicators work best alongside price action, volume, and market structure.
How to Compare Strong and Weak Support and Resistance Levels
| Validation factor |
Stronger evidence |
Weaker evidence |
| Historical price action |
Several meaningful reactions |
One isolated touch |
| Trading timeframe |
Higher-timeframe alignment |
Only a very short timeframe |
| Trading volume |
Elevated participation during reaction |
Thin or declining participation |
| Candlestick confirmation |
Clear rejection and follow-through |
Brief wick without confirmation |
| Indicator confluence |
Independent structural references align |
Single unconfirmed indicator |
| Breakout retest |
Price holds beyond the broken zone |
Price immediately returns inside |
These factors should be evaluated together, not treated as a guaranteed scoring system.
Order book analysis can add context by revealing large passive buy or sell walls near significant price levels. However, displayed liquidity can be canceled or moved before execution.
Using Validated Levels to Plan Entries and Exits
Support and resistance trading generally follows three approaches: buying near validated support, selling near resistance in a range, or entering after a confirmed breakout.
For example, a trader analyzing BTC/USDT on Gate.com Spot Trading can observe the price chart, compare current volume with historical reactions, and monitor the order book before evaluating a setup.
In a range, traders may plan entries near support and use resistance as a potential profit target. Breakout traders may instead wait for a close beyond resistance and a successful retest.
Stop-loss orders are commonly placed beyond the support or resistance zone where the original setup would become invalid.
Risk remains. As the SEC's investor bulletin on stop orders explains for securities markets, a stop trigger doesn't guarantee execution at the specified price. Similar execution concerns can arise in volatile crypto markets.
Avoid placing stops at arbitrary distances without considering volatility, nearby liquidity, and position size.
Common Mistakes When Identifying Support and Resistance
Treating every price touch as an opportunity creates unnecessary trades. Other mistakes include drawing too many resistance lines, ignoring the broader market trend, and assuming an old level must remain relevant indefinitely.
A level that held repeatedly during low volatility can fail once strong momentum enters the market.
Traders should also avoid relying on one indicator. Combining unrelated signals through indicator confluence may improve context, but excessive confirmation can delay entries until much of the price move has passed.
Support and resistance aren't an exact science. Their usefulness depends on market conditions, liquidity, timeframe, and how participants respond when price returns.
Conclusion
To identify support and resistance effectively, begin with historical price reactions and validate potential zones using candlestick behavior, trading volume, higher-timeframe structure, and breakout retests.
The strongest-looking level is not necessarily the one price has touched most often. It's the area where multiple observations suggest meaningful market participation and where a clear invalidation point can be defined.
These levels can improve trading decisions, but historical reactions don't guarantee future price behavior.
FAQ
How many touches make a support or resistance level strong?
There is no universal number. Two or three distinct reactions may establish a useful level, but their quality, timeframe, trading volume, and surrounding market structure matter more than the number of touches alone.
How do you identify support and resistance in crypto trading?
Examine historical swing highs and lows, mark significant price zones, and compare them across multiple timeframes. Then assess candlestick rejection, volume, and any relevant moving averages or previous breakout levels.
Can previous support become resistance?
Yes. After price breaks below support, that same area can become resistance if sellers dominate when price returns. This change is commonly called a support-resistance flip.
Are moving averages reliable support and resistance levels?
Moving averages can act as dynamic support or resistance, particularly during established trends. Their effectiveness varies with timeframe, market volatility, and the moving average period used.
How can traders avoid false breakouts at resistance?
Waiting for a candle close beyond resistance, examining trading volume, and observing a successful retest can help filter weak breakouts. None of these methods guarantees that price will continue in the expected direction.
Disclaimer
This content is for educational purposes only and does not constitute financial or investment advice. Support and resistance analysis involves uncertainty, and crypto prices can move rapidly through historical levels. Traders should consider their risk tolerance, available liquidity, trading costs, and applicable regulations before making trading decisions.