The Ichimoku Cloud indicator combines trend direction, momentum, dynamic support and resistance, and signal confirmation into a single charting system. Swing traders use its five lines and shaded cloud to assess whether a market is trending, consolidating, weakening, or potentially reversing.
Abstract
-
The Ichimoku Cloud indicator uses five components to evaluate trend direction, momentum, support, resistance, and confirmation.
-
Price above the cloud generally supports a bullish trend, while price below it supports a bearish trend.
-
Tenkan-sen and Kijun-sen crossovers show shorter-term momentum relative to medium-term market balance.
-
The Chikou Span checks whether current price strength agrees with earlier price structure.
-
Signals are less decisive when price is inside the cloud or the lines are flat and repeatedly crossing.
What Is the Ichimoku Cloud Indicator?
The Ichimoku Cloud indicator, also called Ichimoku Kinko Hyo, translates to “one look equilibrium chart” and is designed to show market balance at a glance. In practice, it is a technical-analysis system that combines trend direction, momentum, support and resistance, and signal confirmation on one price chart through five components, including the shaded cloud.
As a comprehensive indicator, Ichimoku helps swing traders and other technical analysts with identifying trends, support or resistance, and momentum without stitching together several separate tools. This introduction focuses on how the Ichimoku Cloud’s components work, how traders read its trading signals, how it compares with other indicators, and where its limitations matter in real trading decisions.
This makes Ichimoku useful for swing trading. A swing trader usually needs more than an early entry signal. The trader also needs confirmation that price position, momentum, and market structure support the same interpretation. The Ichimoku Cloud offers a single framework for reading market trend and trading signals, although no configuration guarantees that a trend will continue.
What Are the Five Ichimoku Components?
| Component |
Standard calculation |
Main purpose |
| Tenkan-sen |
Midpoint of the 9-period highest high and lowest low |
Short-term momentum |
| Kijun-sen |
Midpoint of the 26-period highest high and lowest low |
Medium-term balance |
| Senkou Span A |
Average of the Conversion Line and Base Line, plotted 26 periods ahead |
Faster cloud boundary |
| Senkou Span B |
Midpoint of the 52-period highest high and lowest low, plotted 26 periods ahead |
Slower cloud boundary |
| Chikou Span |
Current closing price plotted 26 periods back |
Historical confirmation |
Unlike the SMA indicator, Ichimoku lines are mainly calculated from the midpoint of selected high-low ranges rather than an average of closing prices. The Ichimoku Cloud consists of five key components: Conversion Line, Base Line, Senkou Span A, Leading Span B, and Lagging Span.
The Tenkan-sen, or Tenkan Sen conversion line, reflects shorter-term market balance. A rising line supports improving momentum, while a falling line suggests weakening short-term structure. It resembles a fast trend reference but does not apply the recent-price weighting used by the EMA 20 indicator.
The Kijun-sen, or Kijun Sen base line, represents medium-term equilibrium and acts as a medium term trend indicator. A rising Kijun-sen supports a bullish interpretation, while a falling one supports a bearish interpretation. A flat Kijun-sen can indicate consolidation and may act as support or resistance.
Senkou Span A is the leading span plotted ahead with Senkou Span B, and these leading span lines create the cloud boundaries. The cloud is projected forward to display potential future support or resistance based on existing market structure. It does not predict future prices.
The Chikou Span, also called the lagging span, plots the latest closing price 26 periods behind the current candle. It compares the current market price with past prices as a trend confirmation tool. A Chikou Span above earlier candles supports bullish confirmation, while one below earlier price action supports bearish confirmation.
How Does the Ichimoku Cloud Confirm a Trend?
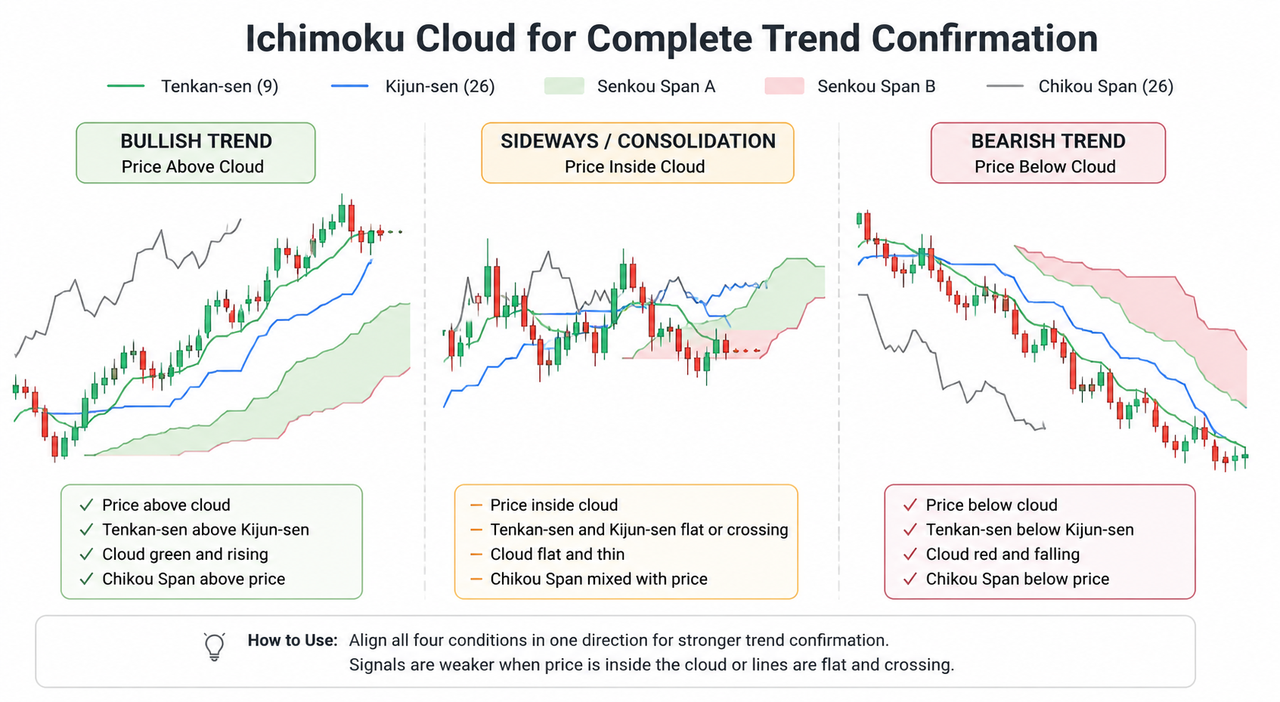
The Ichimoku Cloud indicator gauges momentum and provides stronger trend confirmation when price position, cloud direction, line order, and the Chikou Span all support the same trend.
| Market condition |
Price position |
Line relationship |
Chikou Span |
| Strong bullish structure |
Above the cloud |
Tenkan-sen above Kijun-sen |
Above earlier price |
| Developing bullish structure |
Breaking above the cloud |
Bullish crossover forming |
Moving into open space |
| Uncertain structure |
Inside the cloud |
Flat or repeatedly crossing |
Mixed with earlier candles |
| Developing bearish structure |
Breaking below the cloud |
Bearish crossover forming |
Moving below earlier price |
| Strong bearish structure |
Below the cloud |
Tenkan-sen below Kijun-sen |
Below earlier price |
Price relative to the cloud provides the broadest trend filter. Traders assess the market price versus the cloud to judge trend strength and possible trend shifts. Price above the cloud supports a bullish bias, price below it supports a bearish bias, and price inside it suggests uncertainty. The Kumo cloud can also act as key support in bullish phases and dynamic resistance levels in bearish phases.
A bearish trend is confirmed when Leading Span A is below B.
This layered framework differs from the SuperTrend indicator, which primarily expresses direction through a volatility-adjusted line positioned above or below price.
How Can Swing Traders Read Ichimoku Signals?
Swing traders can evaluate an Ichimoku setup in five stages.
1. Check price against the cloud
Price above the cloud establishes a possible bullish environment. Price below it establishes a possible bearish environment, and this first read of current price moves on the price chart is a practical starting point for identifying trends. Signals forming inside the cloud are weaker because the market may be consolidating or transitioning, and in choppy conditions they are more prone to false signals.
2. Review the projected cloud
A rising future cloud formed by the leading span boundaries supports bullish structure, while a falling future cloud supports bearish structure and helps traders anticipate future support. A large or thick cloud can mark stronger support or resistance, while a thick cloud may do the same; thinner clouds can imply weaker support, although thickness alone cannot confirm a breakout.
3. Compare Tenkan-sen and Kijun-sen
A Tenkan-sen crossover above Kijun-sen is a bullish signal. A crossover below Kijun-sen is a bearish move that can act as a sell signal. A move where the Conversion Line crosses above the Base Line also signals bullish momentum. The location matters: a conversion line crossing above the cloud is a stronger buy signal with clearer trend alignment than one inside or below it.
This resembles crossover interpretation in the MACD indicator, although Ichimoku also considers cloud location and historical confirmation.
4. Examine the Chikou Span
The Chikou Span, also called the lagging span, acts as a trend confirmation tool by testing whether the signal agrees with earlier price structure. A bullish setup becomes clearer when this line compares current price with past prices in a way that helps avoid false signals and confirm bullish or bearish structure. The opposite conditions strengthen bearish confirmation.
5. Wait for the candle to close
Price may briefly cross a cloud boundary and then reverse. Waiting for a confirmed close outside the cloud can reduce premature interpretations and some false signals, especially when price changes are small and the market is not clearly trending, although false breakouts can still occur.
Example of Complete Bullish Confirmation
Suppose price closes above a rising cloud after consolidation, creating a bullish breakout on the price chart. Tenkan-sen crosses above Kijun-sen, both lines begin rising, and the Chikou Span moves above earlier price action, which can generate bullish signals when the broader market trend is aligned.
The setup provides four aligned observations:
-
Price is showing bullish momentum.
-
The projected cloud supports a positive trend structure.
-
Short-term momentum is stronger than medium-term balance.
-
The current market price is stronger than past prices from 26 periods earlier.
A pullback toward Kijun-sen would not automatically invalidate the trend. The structure would weaken if price returned inside the cloud, Tenkan-sen crossed below Kijun-sen, or the Chikou Span became trapped among earlier candles, all of which can point to potential reversals.
Ichimoku Cloud vs Moving Average Ribbon
The Ichimoku Cloud and Moving Average Ribbon both evaluate trend quality, but they organize market information differently.
| Feature |
Ichimoku Cloud |
Moving Average Ribbon |
| Calculation |
High-low range midpoints |
Multiple moving averages |
| Trend display |
Price relative to a projected cloud |
Alignment of fast and slow averages |
| Momentum |
Tenkan-Kijun relationship |
Ribbon slope and expansion |
| Historical confirmation |
Chikou Span |
Not a standard component |
The Moving Average Ribbon indicator emphasizes the order, slope, and separation of several averages. Ichimoku adds projected support and resistance and historical confirmation, making it more comprehensive but visually more complex.
Limitations of the Ichimoku Cloud Indicator
The Ichimoku Cloud indicator becomes less reliable when the market is sideways, highly volatile, or repeatedly crossing the cloud than it is in trending markets.
Its main limitations include:
-
The five-line display can overwhelm inexperienced users.
-
Confirmation may appear after part of a move has already occurred.
-
Sideways markets can create repeated crossovers and conflicting signals, often leading to false signals.
-
Default settings may behave differently across assets and timeframes.
-
The indicator does not determine position size, maximum loss, or risk tolerance.
-
Every component is derived from price, so line agreement does not independently prove that a trade will succeed.
Swing traders may use Ichimoku for trend structure and the Parabolic SAR indicator for trailing-exit reference points, while combining it with other indicators for confirmation instead of repeating the same signal.
Technical indicators organize historical price data. They cannot fully account for unexpected news, liquidity shocks, leverage-driven volatility, or changes in broader market conditions. Ichimoku also does not directly show overbought or oversold conditions, so traders may use momentum tools to identify overbought alongside oversold conditions more clearly.
FAQ
Is the Ichimoku Cloud indicator suitable for beginners?
The Ichimoku Cloud indicator is suitable for beginners who learn it in stages. Price relative to the cloud should be understood first, followed by Tenkan-sen, Kijun-sen, and Chikou Span confirmation.
What timeframe is best for the Ichimoku Cloud?
No timeframe is best for every market. Swing traders often assess Ichimoku on a four-hour, daily chart, or weekly chart, depending on the intended holding period and the asset’s volatility.
Is price above the Ichimoku Cloud always bullish?
Price above the cloud supports a bullish bias but is not automatically a buy signal or a guarantee of continued gains. Confirmation is stronger when current price is above the cloud, Tenkan-sen is above Kijun-sen, and the Chikou Span confirms the move above earlier price action.
What does price inside the cloud mean?
Price inside the cloud generally indicates uncertainty, consolidation, or a transition between trends. Traders may wait for a confirmed close outside the cloud before assigning a stronger directional bias.
Does the Ichimoku Cloud predict future prices?
The Ichimoku Cloud does not predict future prices. Its leading spans are displayed ahead of current price, but their values are calculated from historical and current trading ranges.







