That difference matters in trending markets. A rising regression slope can show that price has been advancing steadily, but it says little about where dynamic support may develop. Ichimoku adds those zones, although its five components create more visual clutter and can react slowly when price suddenly breaks out.
Key Takeaways
-
Linear Regression reduces historical price movements to a best-fit line, with its slope showing trend direction and the rate at which the fitted trend is changing.
-
Ichimoku Cloud combines five components to assess trend direction, momentum, trend confirmation, and potential support and resistance levels.
-
Linear Regression is usually cleaner for objective statistical or rule-based analysis, while Ichimoku provides more market context on a single chart.
-
Price above the Ichimoku Cloud generally supports a bullish bias; price below it supports a bearish bias, while price inside the Cloud suggests weaker trend conditions.
-
Both indicators rely on historical data. Linear Regression can mislead in non-linear markets, while Ichimoku can lag during abrupt trend shifts or breakouts.
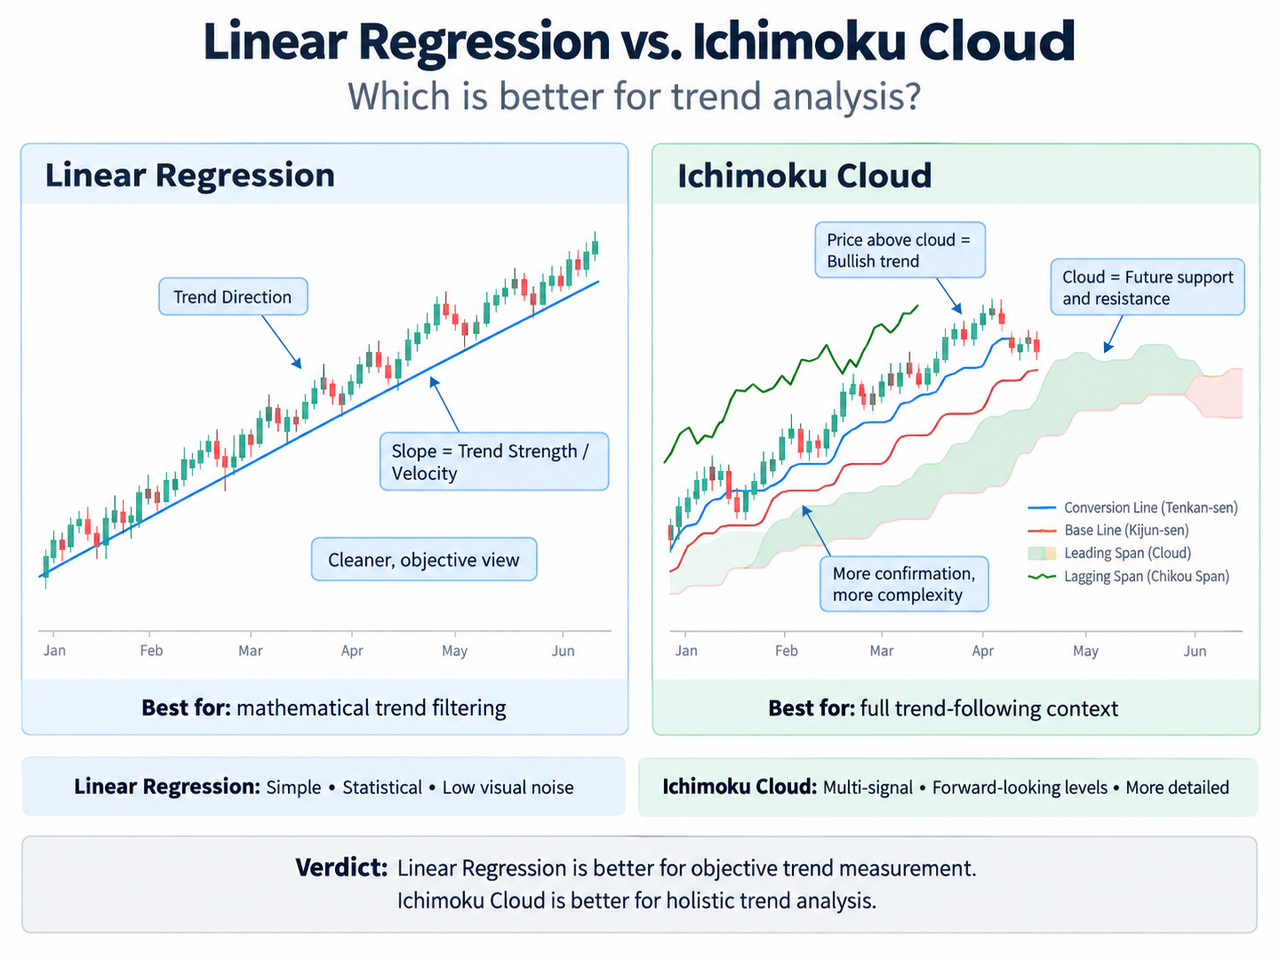
Linear Regression vs. Ichimoku Cloud: Which Is Better for Trend Analysis?
The practical answer depends on what “trend analysis” needs to accomplish.
| Factor |
Linear Regression |
Ichimoku Cloud |
| Main purpose |
Quantify statistical trend |
Assess trend, momentum and support/resistance |
| Trend direction |
Regression slope |
Price relative to Cloud and component alignment |
| Trend strength |
Slope magnitude and price dispersion |
Cloud structure, line alignment and confirmations |
| Future levels |
Limited |
Projects Cloud 26 periods forward |
| Chart complexity |
Low |
High |
| Best fit |
Mechanical and quantitative analysis |
Multi-factor trend-following analysis |
| Main weakness |
Assumes a reasonably linear relationship |
More complex and can lag sudden moves |
Linear Regression fits a straight line through historical data by minimizing squared residuals. The U.S. National Institute of Standards and Technology's explanation of linear least-squares regression describes the underlying statistical method used to fit such a relationship. In chart analysis, time is commonly treated as the independent variable and price as the dependent variable.
If the slope is positive, the fitted trend is rising. A negative slope indicates falling price direction, while a near-flat slope suggests little directional movement. NIST likewise describes straight-line slope as a common way to identify whether sequential data contain a trend.
The Linear Regression Indicator therefore turns price noise into a single directional gradient rather than asking a trader to draw a trend line manually.
How the Ichimoku Cloud Indicator Identifies Trends
The Ichimoku Cloud takes a broader approach. Developed by Japanese journalist Goichi Hosoda, with its origins dating to the 1930s, the system uses five components built from historical price midpoints. The CMT Association describes Ichimoku as a system for evaluating trend direction, support and resistance, momentum, and trend strength within the same framework.
Its components are:
-
Conversion Line (Tenkan-sen): short-term midpoint.
-
Base Line (Kijun-sen): medium-term midpoint.
-
Leading Span A (Senkou Span A): derived from the Conversion Line and Base Line and projected forward.
-
Leading Span B (Senkou Span B): longer-period midpoint projected forward.
-
Lagging Span (Chikou Span): the current closing price plotted 26 periods back.
Leading Span A and Leading Span B form the Cloud, or Kumo. Because those spans are plotted 26 periods ahead, Ichimoku gives traders a forward-shifted view of potential support and resistance rather than predicting future prices in a statistical forecasting sense.
The Ichimoku Cloud Indicator is therefore more than a short-term trend indicator. It combines short-, medium-, and longer-term market structure into one trading system.
Conversion Line, Base Line and Leading Span Signals
A basic Ichimoku interpretation starts with the current closing price.
Price above the Cloud normally indicates a bullish trend or bullish momentum. Price below the Cloud points toward a bearish trend or bearish sentiment. If price trades inside the Cloud, the overall trend is less clear, and support and resistance may be weaker or contested.
The Conversion Line and Base Line add another layer. A bullish signal can occur when the Conversion Line crosses above the Base Line, while a cross below can produce a bearish signal. The location of that crossover matters: a bullish crossover above the Cloud generally carries different context from one occurring inside or below it.
Cloud structure also matters. A thick Cloud can represent a broader potential support or resistance zone, while a thinner Cloud may be easier for price to penetrate. Traders shouldn't treat Cloud thickness as a stand-alone measurement of trend strength, though; price action and the other Ichimoku components still need context.
The Moving Average Ribbon also uses several trend lines, but moving averages usually rely on averaged closing prices. Ichimoku instead uses high-low midpoints and shifts some calculations forward and backward, giving it both predictive-looking and historical perspectives.
Lagging Span and Future Support and Resistance
The Chikou Span, or Lagging Span, helps with trend confirmation by placing the current closing price 26 periods behind the present bar. If the Lagging Span sits above past prices while current price is also above the Cloud, the signals broadly support the same bullish interpretation. The reverse can reinforce a bearish bias.
This is one reason Ichimoku can filter market noise better than a single moving average. Several components must align before a strong trend-following interpretation develops.
The Cloud itself supplies future support and resistance. For example, when price breaks above the Cloud after trading below it, traders may interpret the move as a potential bullish breakout. Future Senkou Span levels can then act as reference zones if price pulls back.
By comparison, tools such as Pivot Points and Fibonacci Retracement identify support and resistance differently: Pivot Points calculate predefined levels, while Fibonacci analysis measures retracement proportions from selected price swings.
Identifying Trends With Linear Regression
Linear Regression becomes especially useful when the trader wants one repeatable answer: what direction best fits these past prices?
Suppose a 30-period regression line on a daily chart has a steadily positive slope. That indicates an upward statistical relationship between time and price during those 30 observations. If the slope becomes flatter, the trend's fitted velocity is weakening even if price hasn't yet produced an obvious reversal.
The catch is non-linear price action. Crypto markets can accelerate, form parabolic moves, gap between regimes, or reverse sharply. A straight line may fit the previous data perfectly well while becoming a poor description of current market conditions.
This differs from the Zig Zag Indicator, which filters smaller price movements to emphasize swing highs and lows rather than estimating one best-fit direction through all observations.
Example Strategy: Using Both Indicators Together
Linear Regression and Ichimoku don't have to compete.
Consider BTC on a daily chart. A trader first sees a positive regression slope, suggesting that historical prices are following an upward statistical trend. Price is also above the Ichimoku Cloud, the Conversion Line is above the Base Line, and the Lagging Span sits above past prices.
Those independent signals strengthen the case that the market is in a stronger trend than the regression slope alone suggests.
For a live example, the BTC/USDT market on Gate.com can be used to compare current price action with different indicator settings and timeframes. The market page includes the trading chart and current market data needed to examine how indicator signals behave against real price movements.
If price then breaks below the Cloud while the regression slope starts flattening or turning negative, the two tools are again pointing toward the same potential trend shift. This is trend confirmation, not certainty.
When Linear Regression Is Better
Linear Regression may be the better trend confirmation tool when:
-
the trader wants mathematical clarity and repeatable calculations;
-
a strategy needs a numeric representation of trend direction;
-
chart simplicity matters;
-
the market is moving in a reasonably linear trend;
-
the analysis is being incorporated into systematic or mechanical trading rules.
It also pairs naturally with other technical indicators. A regression slope could be combined with RSI to check momentum or with OBV to see whether volume behavior supports the direction of price.
When the Ichimoku Cloud Is Better
Ichimoku is often more useful when the trader needs a comprehensive indicator for trend following rather than one statistical measurement.
It can simultaneously show current trend direction, bullish or bearish bias, potential support, resistance zones, momentum relationships, trend confirmation, and future support and resistance. That holistic view can reduce the need to stack several separate indicators on the chart.
Its weakness is complexity. Five plotted components can make charts difficult to read, particularly for beginners, and the calculations still depend on past prices. During sudden breakouts, historical high-low midpoints can react more slowly than current price.
Risks, False Signals and Market Conditions
Neither indicator can reliably predict trend reversals on its own.
Linear Regression can produce false signals when market behavior isn't approximately linear. A steep slope may simply reflect a short-lived price move or an outlier. Changing the lookback period can also materially change the result.
Ichimoku has different problems. Price may repeatedly cross a thinner Cloud in sideways conditions, generating bullish and bearish signals without a lasting trend. A breakout above the Cloud can fail, and a large or thick Cloud doesn't guarantee stronger support.
Moving averages remain simpler and cleaner for traders who mainly want a basic trend-following reference. Indicators such as ADX can also help evaluate trend strength without trying to identify support and resistance.
Conclusion
For Linear Regression vs. Ichimoku Cloud, Linear Regression is better suited to traders who want an objective statistical measure of trend direction and velocity. Ichimoku Cloud is stronger when trend analysis needs to include momentum, confirmation, dynamic support, resistance, and forward-shifted market structure.
Using both can be more informative than forcing a universal winner. Regression can quantify whether a directional trend exists, while Ichimoku can show how that trend fits into broader price structure.
Both rely on historical data, so neither can eliminate false signals or guarantee future price movements. Technical analysis should be combined with appropriate risk management, and anyone making investment decisions should consider the risks involved and seek independent financial advice where appropriate.
FAQ
Is Linear Regression better than Ichimoku Cloud for identifying trends?
Linear Regression is usually cleaner for identifying the mathematical direction and velocity of a trend. Ichimoku Cloud provides more information because it combines trend direction, momentum, confirmation, and support and resistance levels.
Does the Ichimoku Cloud predict future prices?
No. The Cloud projects Leading Span A and Leading Span B 26 periods forward, but those values are calculated from historical price data. They represent projected support and resistance structure rather than guaranteed future prices.
What does price above the Ichimoku Cloud mean?
Price above the Cloud is generally interpreted as a bullish trend or bullish bias. A stronger interpretation may come when the Conversion Line is above the Base Line and the Chikou Span also confirms the direction.
Can Linear Regression identify overbought or oversold conditions?
A regression channel can show when price has moved unusually far from its fitted trend, but that doesn't automatically mean the market is overbought or oversold. Momentum indicators such as RSI are specifically designed to assess those conditions.
Can traders combine Linear Regression with Ichimoku Cloud?
Yes. Linear Regression can quantify trend direction while Ichimoku supplies trend confirmation, support and resistance, and broader market structure. Agreement between independent signals can reduce reliance on any single indicator, though it cannot eliminate trading risk.
Disclaimer: This content is for educational and informational purposes only and does not constitute financial or investment advice. Technical indicators use historical data and can produce false signals. Market conditions can change quickly, and past price behavior does not guarantee future results.







