For day traders and swing traders, choosing complementary indicators matters more than adding dozens to a price chart. Crypto markets operate around the clock, and sudden price movements can make individual buy and sell signals unreliable. The right combination improves decision-making without pretending to predict future price movements.
Key Takeaways
-
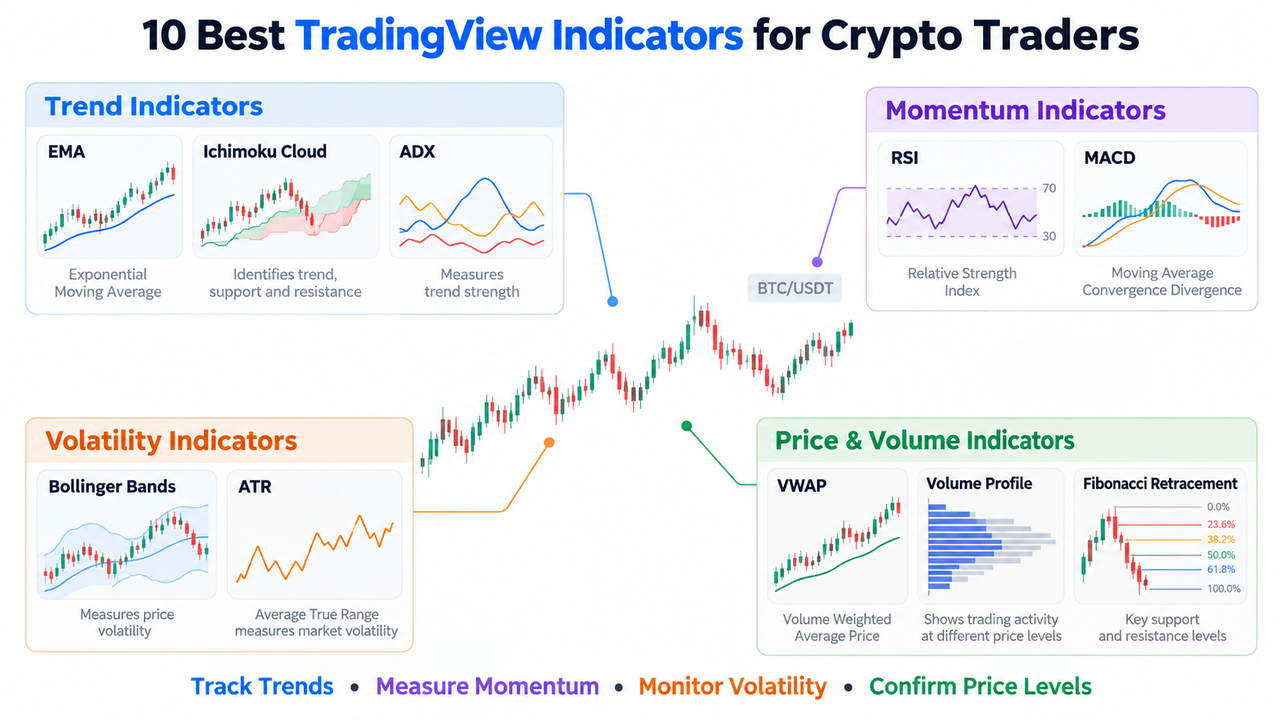
The best TradingView indicators measure four important market conditions: trend direction, momentum, volatility, and volume.
-
RSI and MACD help assess momentum, while EMA and Ichimoku Cloud identify existing trends.
-
Bollinger Bands and ATR measure market volatility, while Volume Profile identifies heavily traded price levels.
-
Combining two or three complementary indicators can reduce conflicting signals and chart clutter.
-
No indicator guarantees accurate entry and exit points, particularly during fast-moving crypto markets.
What Are TradingView Indicators?
TradingView indicators are mathematical tools that transform historical price movements, trade volume, and market data into visual signals.
They help traders identify support and resistance levels, confirm trends, evaluate market sentiment, and assess potential reversals.
TradingView includes built-in indicators and community-developed custom indicators. Its indicator library supports different trading styles, including scalping, day trading, and swing trading.
Beginners often start with technical indicators for beginners before experimenting with more advanced combinations.
10 Best TradingView Indicators for Crypto Trading
The following indicators cover different market functions rather than ranking tools solely by popularity.
| Indicator |
Category |
Primary Use |
| RSI |
Momentum |
Overbought and oversold conditions |
| MACD |
Momentum |
Momentum shifts and crossovers |
| EMA |
Trend |
Short- and medium-term direction |
| VWAP |
Price and volume |
Volume-weighted average price |
| Bollinger Bands |
Volatility |
Price extremes and compression |
| ATR |
Volatility |
Price fluctuations and stop distances |
| Volume Profile |
Volume |
Significant support and resistance |
| ADX |
Trend strength |
Trending versus ranging markets |
| Fibonacci Retracement |
Price structure |
Potential pullback levels |
| Ichimoku Cloud |
Trend |
Trend direction and support zones |
-
Relative Strength Index (RSI)
The Relative Strength Index (RSI) is a momentum oscillator ranging from 0 to 100.
Readings above 70 commonly indicate overbought conditions, while readings below 30 suggest oversold conditions.
However, RSI can remain elevated throughout a strong rally. Traders therefore assess divergences and price structure rather than treating every extreme reading as a reversal.
The RSI indicator is particularly useful when momentum changes before price breaks a significant support or resistance level.
-
Moving Average Convergence Divergence (MACD)
Moving Average Convergence Divergence (MACD) measures momentum using the relationship between two exponential moving averages.
Its standard configuration uses 12-period and 26-period EMAs, alongside a nine-period signal line.
A bullish crossover may indicate improving momentum. Negative readings below the zero line suggest the faster EMA remains below the slower EMA.
The MACD indicator helps traders assess momentum changes, although crossovers can produce false signals in sideways markets.
-
Exponential Moving Average (EMA)
An exponential moving average places greater weight on recent prices, making it more responsive than a simple moving average.
Common settings include:
-
EMA 9 for short-term momentum.
-
EMA 20 for immediate trend direction.
-
EMA 50 for broader intraday trends.
When price remains above rising EMAs, traders may interpret the structure as bullish.
The EMA 9, EMA 20, and EMA 50 combination can help confirm trends, but frequent crossovers during consolidation increase whipsaw risk.
-
Volume Weighted Average Price (VWAP)
Volume Weighted Average Price (VWAP) calculates the average traded price weighted by volume over a selected period.
Price trading above VWAP may indicate bullish intraday positioning, while sustained trading below it suggests weakness.
For example, a trader examining the BTC/USDT spot market on Gate.com might compare a breakout with VWAP to assess whether price has moved above its volume-weighted average.
Unlike an ordinary moving average, VWAP incorporates trading volume and depends on its selected anchor or reset period.
-
Bollinger Bands
Bollinger Bands consist of a central moving average, an upper band, and a lower band.
The standard configuration uses a 20-period SMA with bands positioned two standard deviations away.
Contracting bands indicate reduced volatility and may precede significant expansion. A price touching the upper band, however, doesn't automatically generate a sell signal.
The relationship between Bollinger Bands and Keltner Channels can help distinguish volatility expansion from changing trend direction.
-
Average True Range (ATR)
Average True Range (ATR) measures volatility using price ranges and gaps over a specified period, commonly 14 candles.
A rising ATR indicates larger price fluctuations, not necessarily bullish momentum.
Suppose Bitcoin has an hourly ATR of $250. A stop positioned just $20 away from entry could be vulnerable to ordinary price noise.
Traders use ATR when planning stop distances and position sizes, although wider stops require smaller positions to maintain the same monetary risk.
-
Volume Profile
Volume Profile displays trading volume across price levels rather than simply plotting volume over time.
High Volume Nodes indicate prices where substantial trading activity occurred. These areas can become important support or resistance zones.
Low-volume regions may experience faster price movement, although liquidity conditions also matter.
TradingView's Volume Profile documentation identifies the Point of Control as the price with the highest traded volume during the selected period.
Rising volume during a breakout can support its credibility, while weak participation warrants caution.
-
Average Directional Index (ADX)
ADX measures trend strength without independently identifying bullish or bearish direction.
Readings above 25 conventionally suggest a stronger trend, while readings below 20 indicate weak or ranging conditions.
Traders can combine ADX with EMAs to distinguish directional moves from sideways fluctuations.
The ADX indicator becomes especially useful when a momentum signal appears during uncertain market conditions.
-
Fibonacci Retracement
Fibonacci Retracement identifies potential support and resistance levels using ratios derived from the Fibonacci sequence.
Common retracement levels include 23.6%, 38.2%, 50%, 61.8%, and 78.6%. The 50% level is a trading convention rather than a Fibonacci ratio.
When price approaches a retracement zone, traders observe whether volume and candlestick behavior support a bounce.
Fibonacci retracement levels are reference zones, not guaranteed reversal prices.
-
Ichimoku Cloud
Ichimoku Cloud combines several calculations to display trend direction, momentum, and potential support or resistance.
Its main components include the Tenkan-sen, Kijun-sen, Senkou Span A, Senkou Span B, and Chikou Span.
Price above the cloud generally indicates bullish positioning. Price inside the cloud suggests weaker directional clarity.
The Ichimoku Cloud indicator can support swing trading decisions, although its multiple lines require practice to interpret correctly.
How to Choose Indicators on TradingView for Day Trading
The most practical approach combines indicators that measure different conditions.
| Trading Objective |
Suggested Combination |
| Trend-following |
EMA + ADX + Volume |
| Momentum trading |
MACD + RSI + Volume |
| Breakout trading |
Bollinger Bands + Volume Profile |
| Intraday trading |
VWAP + RSI + ATR |
| Swing trading |
Ichimoku Cloud + MACD |
For example, a 15-minute breakout above resistance becomes more convincing when trading volume increases and momentum strengthens.
Traders using five-minute to one-hour charts often focus on quicker momentum and volume changes. Higher timeframes provide useful context for the prevailing trend.
TradingView also supports custom indicators, including modified SuperTrend systems and Wyckoff-inspired range tools. Their reliability depends on calculation logic, settings, and whether historical signals repaint.
How to Reduce False Signals and Manage Risk
Indicators process historical data, meaning signals can lag behind actual market moves.
A trend indicator may react slowly to sudden reversals, while a momentum oscillator may repeatedly generate entry and exit signals in choppy markets.
Combining price structure, volume confirmation, and volatility measurements is more useful than stacking similar oscillators.
Risk management remains essential. The U.S. Securities and Exchange Commission's investor guidance on day trading warns that short-term trading can produce substantial financial losses.
Position size should reflect stop distance, liquidity, and acceptable loss. Stronger ADX readings may increase confidence in trend conditions, but they don't justify unlimited leverage.
Conclusion
The best TradingView indicators for crypto traders depend on trading style and market conditions. RSI and MACD measure momentum, EMA and Ichimoku identify trends, Bollinger Bands and ATR track volatility, while VWAP and Volume Profile add price-and-volume context.
Using complementary tools alongside support and resistance, price action, and defined risk limits creates a more disciplined decision-making process. No combination eliminates false signals or guarantees future performance.
FAQs
What is the best TradingView indicator for beginners?
RSI and EMA are practical starting points because their calculations and signals are relatively easy to interpret. Using both provides momentum and trend information without excessive chart complexity.
Which TradingView indicator is best for day trading?
VWAP is useful for evaluating intraday price positioning, while RSI tracks momentum and ATR measures volatility. The best combination depends on the asset, timeframe, and trading strategy.
Which indicators confirm crypto breakouts?
Volume, ADX, and momentum indicators can support breakout analysis. Rising participation and strengthening momentum make a breakout more credible but cannot guarantee continuation.
Can TradingView indicators predict future crypto prices?
No. TradingView indicators analyze historical and current market data to identify potential price movements. They cannot reliably predict future prices or eliminate market uncertainty.
Are custom TradingView indicators better than built-in indicators?
Not necessarily. Custom indicators may combine calculations or automate specific signals, but they can also introduce repainting, overfitting, and unclear assumptions. Transparent calculations and realistic backtesting matter more than complexity.
Disclaimer: This content is for educational purposes only and does not constitute financial or investment advice. Cryptocurrency trading involves substantial risk, including possible loss of capital. Technical indicators and historical patterns do not guarantee future results.







